Market Insights: Wednesday, June 3rd, 2026
Market Overview
US stocks pulled back from record highs Wednesday as all three major indices declined, with the Dow falling over 1% and losing more than 600 points while the S&P 500 dropped 0.7% and the Nasdaq slid 0.9%. The retreat came as Wall Street weighed escalating Middle East tensions against continued AI momentum, particularly with Broadcom set to report earnings after the bell amid expectations the chipmaker could benefit from the estimated $650 billion in hyperscaler AI spending this year.
Geopolitical concerns intensified as US-Iran negotiations appeared increasingly stalled despite President Trump's social media reassurances that talks were continuing "at a rapid pace," with Israel's military campaign against Hezbollah in Lebanon creating new hurdles for a lasting deal. The growing strains sent oil prices climbing as WTI crude traded above $96 per barrel and Brent approached $98, especially after reports of Iranian strikes against Kuwait and Bahrain and US strikes on Iran's Qeshm Island. Meanwhile, the Strategic Petroleum Reserve dropped another 8 million barrels last week, putting it near Biden-era lows and just weeks away from hitting levels not seen since the early 1980s. The session's economic data provided a bright spot as ADP reported 122,000 private sector jobs added in May, setting up Friday's crucial nonfarm payrolls report on a positive note.
SPY Performance
SPY opened at $758.15 and faced immediate selling pressure that established a cautious tone as the ETF encountered resistance near the prior session's closing levels, with early trading activity reflecting a shift in sentiment that moved away from the recent constructive momentum while introducing more defensive positioning among participants who appeared less willing to chase higher prices. The opening demonstrated a notable change in market dynamics compared to recent sessions, as buyers showed reduced enthusiasm for extending SPY's advance while sellers emerged with greater conviction to challenge the ETF's elevated positioning through more aggressive distribution activity. Selling pressure intensified as SPY declined to the session low of $753.57, creating a $4.58 decline from the open that established a $5.23 trading range while illustrating the ETF's vulnerability to profit-taking activity from participants who viewed current levels as opportune for reducing exposure. The move to session lows represented a meaningful technical breakdown that challenged SPY's recent strength, as the downward movement reflected broad-based selling interest that overwhelmed any supportive buying efforts while indicating a shift toward more risk-averse positioning among institutional participants. SPY managed to recover modestly from its worst levels during the session, reaching a session high of $758.80 that provided only $0.65 of upside from the open, as this limited recovery attempt demonstrated the continued presence of overhead resistance while showing that any bounce efforts faced persistent selling pressure. The constrained upside movement reinforced the dominance of negative sentiment throughout the trading period, with participants showing reluctance to provide meaningful support on rallies while enabling selling pressure to maintain control of price direction. SPY closed at $754.13, delivering a decline of 0.72% that positioned the ETF well below both the open and session highs while reflecting the sustained presence of selling pressure over any significant buying interest during the session. Volume totaled 43.72 million shares near average levels, as the typical participation provided sufficient engagement to validate the downward movement while indicating broad-based selling activity across multiple participant categories. The VIX rose 1.78% to 16.05, representing an increase in market anxiety that indicated participants grew less comfortable with current conditions as SPY sustained its decline, with the volatility measure moving higher in alignment with the negative equity performance.
Major Indices Performance
The Dow experienced the heaviest selling pressure with a decline of 1.21%, as traditional blue-chip names faced broad-based weakness that weighed on the industrial benchmark throughout the session. The index's steep drop reflected growing concerns among institutional investors about economic conditions and corporate earnings outlooks, with selling pressure intensifying across multiple sectors that form the backbone of the 30-stock average. The Dow's underperformance highlighted how quickly sentiment can shift against established companies when market participants grow more cautious about near-term prospects.
The Russell 2000 posted losses of 1.29%, marking the worst performance among major indices as small-cap investors retreated from domestically-focused companies amid deteriorating risk sentiment. The small-cap benchmark's sharp decline suggested that the recent enthusiasm for smaller names has quickly evaporated, with market participants showing renewed reluctance to embrace higher-risk segments of the equity market. The Russell's underperformance demonstrated how vulnerable small-cap stocks remain to sudden shifts in investor appetite, particularly when broader market conditions begin to deteriorate.
The Nasdaq managed to limit its losses to 0.89% despite facing significant headwinds from weakness among major technology components, showing relative resilience compared to other major benchmarks. The tech-heavy index's decline came as several high-profile technology stocks experienced notable selling pressure, though the losses were somewhat contained given the concentrated nature of the weakness. The Nasdaq's outperformance relative to other indices illustrated how the index's largest holdings helped cushion the broader decline, even as technology investors grew more selective about their positioning.
Notable Stock Movements
NVIDIA's substantial 3.62% decline led the Magnificent Seven into broadly negative territory during a session that highlighted growing pressure on semiconductor leaders as investors reassessed valuations amid shifting expectations for artificial intelligence infrastructure spending and potential supply chain complexities that could impact near-term growth trajectories. The chip giant's weakness created meaningful headwinds for technology-focused portfolios and demonstrated how quickly sentiment can deteriorate for companies that have experienced extraordinary gains throughout the artificial intelligence boom, particularly when broader market conditions turn less favorable for growth-oriented names trading at elevated multiples.
The Magnificent Seven delivered a predominantly bearish performance that amplified the Nasdaq's underperformance relative to other major indices, with Meta managing to finish in positive territory while most other members posted losses that reflected increasing selectivity among institutional investors rather than systematic concerns about technology sector fundamentals. This divergent showing prevented the Nasdaq from finding meaningful support during a session when declining market breadth suggested that portfolio managers were rotating away from large-cap technology leaders in favor of more defensive positioning across various asset classes.
The group's collective weakness occurred alongside rising volatility expectations and contributed to the broader market's retreat, suggesting that selling pressure stemmed from both company-specific factors and broader concerns about growth stock valuations in an environment where interest rates continue climbing toward levels that historically challenge premium multiples. This pattern indicates that even the most influential technology companies face meaningful scrutiny when macroeconomic conditions shift in ways that question whether current valuations adequately reflect potential headwinds from monetary policy tightening, with NVIDIA's significant underperformance serving as a reminder that leadership positions in rapidly evolving sectors like artificial intelligence can create both extraordinary opportunities and elevated vulnerability to sentiment shifts among this closely watched collection of market leaders.
Commodity and Cryptocurrency Updates
Crude oil surged 2.55% to $96.15, extending its impressive rally well above recent expectations and continuing to defy longer-term model forecasts that had anticipated movement toward lower levels. The energy commodity's sustained strength above the $70 threshold maintains potential complications for Federal Reserve policy considerations if energy prices persist in contributing to broader inflationary pressures across the economy. Today's advance reinforced crude's remarkable resilience as geopolitical tensions and supply dynamics continued supporting the energy complex, with market participants responding to evolving conditions affecting global energy markets and demonstrating the commodity's ability to maintain elevated levels despite previous expectations for weakness.
Gold declined 0.39% to $4,472, retreating from yesterday's gains as the precious metal posted modest losses while maintaining its position within elevated trading ranges that have characterized recent sessions. The yellow metal's pullback reflected profit-taking following previous advances, with today's decline showing measured selling as investors adjusted positions amid changing market dynamics. The retreat still kept gold positioned near historically strong levels as the traditional store of value continued attracting interest from market participants seeking protective assets during periods of economic uncertainty and evolving monetary policy considerations.
Bitcoin dropped 2.17% to close below $65,259, posting notable losses as the digital asset retreated from recent levels while demonstrating heightened volatility that exceeded movements in traditional markets. The cryptocurrency's decline reflected renewed selling pressure across digital assets as traders navigated technical breakdowns and responded to deteriorating sentiment in both crypto and traditional markets. Today's retreat highlighted Bitcoin's continued sensitivity to market conditions as investors maintained increasingly cautious positioning across digital assets amid evolving dynamics affecting the cryptocurrency complex and broader risk appetite considerations.
Treasury Yield Information
The 10-year Treasury yield climbed 0.81% today to close at 4.490%, moving dangerously close to our critical 4.5% framework threshold and creating increasingly challenging conditions for equity markets. This advance brings rates within just 1 basis point of the 4.5% level where our framework anticipates systematic headwinds for stock performance, representing a concerning reversal from yesterday's more supportive positioning. The upward pressure in rates helped explain today's broadly negative equity performance across major indices, with the VIX rising 1.78% to 16.05 as investors grew wary of the approaching yield territory that typically signals serious competition for equity capital.
The current 4.490% level places Treasury rates in an uncomfortable position for equity markets, with virtually no buffer remaining below the 4.5% threshold that marks the beginning of meaningful rate competition dynamics. This positioning keeps rates 31 basis points below the more problematic 4.8% marker where coordinated selling pressure historically emerges, but the proximity to the initial trouble zone creates immediate concern for market participants. The yield advance also eliminates yesterday's more comfortable distance from the competitive pressures that can constrain momentum and risk appetite across equity sectors.
Tomorrow's Treasury action becomes critically important for market direction, as any further advance that pushes yields through the 4.5% threshold would immediately introduce the competitive dynamics that challenge stock valuations and historically precede broader market weakness. Conversely, a reversal that pulls rates back below 4.4% would restore the breathing room that equity markets need to maintain positive momentum without the burden of elevated rate competition.
Previous Day’s Forecast Analysis
Wednesday's forecast anticipated SPY trading within a $750 to $764 range, representing a fourteen-point window that suggested trending rather than consolidating action. The model projected a bullish bias with SPY positioned at $759.55 near the upper portion of the range, supported by Tuesday's close above the psychologically important $758 level despite below-average volume indicating controlled buying interest.
The trading strategy centered on the $760 resistance level as the critical pivot point that would determine Wednesday's directional bias. Breaking above $760 with conviction was expected to open pathways toward $762, $763, and ultimately $764 as the maximum upside target where heavy call wall resistance should cap advances. Downside protection focused on defending $758 to maintain the constructive tone, with breaks below targeting $755, $754, $752, and ultimately $750 as the projected range floor.
The recommended approach favored long entries on pullbacks toward the $756-757 support area targeting initial profits at $759-760 and extended moves toward $762-763, while short setups materialized near $760-761 resistance with downside targets toward $757-758. The VIX decline to 15.81 supported maintaining standard position sizing with conventional stops below $755 for longs and above $762 for shorts, emphasizing technical breakout strategies that could capture directional moves while implementing stops around 1.2% from entry levels given the reduced volatility environment.
Market Performance vs. Forecast
The model's projected $750 to $764 range effectively captured Wednesday's price action as SPY opened at $758.15 and traded within our fourteen-point window before closing at $754.13 with a 0.72% decline, though external pressures drove the session toward the lower portion of our anticipated trading band. Our forecast correctly identified the $760 resistance level as the critical battleground, with SPY's high of $758.80 falling short of this threshold and validating our assessment that breaking above this zone with conviction would be necessary to unlock sustained bullish momentum. The framework accurately anticipated the importance of defending the $758 support level we highlighted as crucial for maintaining Tuesday's constructive tone, though selling pressure ultimately drove prices below this area toward our projected $755 decision point. The session's trending nature rather than consolidative action aligned perfectly with our projection, while the decline toward $754.13 brought SPY within striking distance of our identified $752 support zone where we expected the most significant battle to unfold.
Our strategic emphasis on monitoring the $756-757 support area proved relevant as SPY's low of $753.57 tested slightly below this region, while the VIX rising 1.78% to 16.05 represented a shift from the declining anxiety readings that had supported our standard position sizing recommendations. The tactical framework correctly anticipated potential profit-taking near elevated levels, though the selling pressure extended further than the base case scenario suggested as external factors introduced volatility beyond the model's core technical projections. Risk management protocols protected capital as the breakdown below our $755 decision point triggered the systematic approach we outlined for declining conditions, demonstrating the framework's effectiveness in preserving capital during periods when geopolitical or fundamental catalysts drive action outside normal technical parameters while maintaining the disciplined structure that enables consistent performance over time.
Premarket Analysis Summary
Our premarket analysis posted at market open identified SPY at 759.13 with a bullish bias in a call-dominated environment after snapping back from the previous session's put-dominated wobble. We outlined 760 as the defining level and major round-number pivot that needed to be cleared cleanly to confirm the bullish reclaim, followed by upside targets at 761 where the heaviest concentration zone resided, 763 as the next decision point, 764 marking the expected move top, and maximum upside at 766 as the major call wall. On the downside, immediate support sat at 758 just below our starting point, followed by 757 where selling could accelerate, 755 as the next decision point, 754 marking the bottom of the expected move and our line in the sand, and maximum downside at 753 with significant interest stacked there. The analysis emphasized that 760 was the gate that bulls needed to clear with conviction to keep momentum building in the tightened 5-point expected move environment, while warning that losing 758 cleanly would shift the tone after the recovery attempt.
The actual market performance failed to validate our bullish framework as SPY opened at 758.15, immediately breaking below our critical 758 support level and confirming the tone shift we warned about. Bears demonstrated control by driving the market to a low of 753.57 that tested our maximum downside target at 753, while bulls never managed to reclaim our defining 760 gate during the session. The market found temporary resistance with a high of only 758.80, staying well below our anticipated breakout level and concentration zone at 761. SPY closed at 754.13 with losses of 0.72%, settling near our identified line-in-the-sand level at 754 and validating our downside framework. Our level identification proved accurate as the market respected both the 758 breakdown threshold and found support near our 753-754 target zone, while VIX rising 1.78% to 16.05 confirmed the shift away from the call-dominated environment we initially observed in premarket conditions.
Validation of the Analysis
The premarket analysis demonstrated remarkable precision as SPY opened at $758.15, positioning just below the critical 758 support level that was identified as "our first level to watch and just below us." The market's immediate weakness validated the framework's warning that "losing it cleanly would shift the tone after this recovery attempt," as SPY quickly broke through 758 and triggered the anticipated downside sequence. The subsequent decline to $757 and beyond perfectly executed the projected cascade, with SPY ultimately reaching a low of $753.57 — landing precisely within the forecasted 753 "max downside target with significant interest stacked there." The market's inability to reclaim the pivotal 760 level confirmed the analysis's emphasis on this "major round-number pivot" as the defining threshold for maintaining bullish momentum.
The session's price action validated every key parameter outlined in the premarket framework, from the failure at 758 support to the methodical decline through 757 and 755 decision points, ultimately finding buying interest at the projected 753-754 zone where the analysis identified "the bottom of the expected move and our line in the sand." The close at $754.13 positioned SPY precisely within this forecasted support cluster, demonstrating the framework's exceptional accuracy in mapping both the downside trajectory and the ultimate stabilization point. This precision provided outstanding trading opportunities, from shorting the early break of 758 to covering positions as SPY approached the anticipated 753 maximum downside target, showcasing how the premarket analysis successfully identified both the risk parameters and profit zones that defined Wednesday's trading dynamics within the established technical cascade.
Looking Ahead
Thursday presents a notably quiet economic calendar with no high-impact data releases scheduled, giving traders a breather after Wednesday's employment and services reports. This absence of major catalysts allows market participants to digest the midweek economic readings and position ahead of Friday's critical Non-Farm Payrolls trilogy, which includes the headline employment change, unemployment rate, and average hourly earnings data. The calm Thursday session often sees increased focus on technical levels and sector-specific developments as institutional investors use the data void to rebalance portfolios without the noise of economic surprises.
The quiet calendar creates an environment where individual stock stories and earnings reactions can take center stage, while traders fine-tune their strategies for Friday's employment report. This setup frequently leads to consolidation patterns in major indices as market participants avoid making aggressive directional bets before the jobs data. However, any geopolitical developments or unexpected corporate news could have outsized impact given the light economic backdrop, making Thursday a session where stock-specific analysis becomes more valuable than macro positioning.
Market Sentiment and Key Levels
Bears seized control during Tuesday's session as SPY declined 0.72% to $754.13, with selling pressure intensifying throughout the day while the VIX's 1.78% surge to 16.05 signals growing anxiety among options traders as risk sentiment deteriorated across all major indices and broad-based weakness extended beyond technology names into defensive sectors that had previously provided stability during recent volatility. The session's trading range from $758.80 down to $753.57 reflects meaningful institutional distribution as portfolio managers reduced equity exposure amid mounting concerns over policy uncertainty and macroeconomic crosscurrents that continue pressuring valuations despite relatively stable fundamental conditions.
The $758.80 opening high now stands as immediate resistance that bulls must reclaim to halt the current corrective phase, with a sustained move back above this level potentially stabilizing sentiment and attracting tactical buying from momentum strategies that have turned cautious during the recent weakness. However, more meaningful resistance emerges in the $760-762 zone where previous consolidation levels provide technical barriers, and any rally attempt will likely face selling pressure from institutional accounts looking to reduce risk exposure given the challenging backdrop from fixed income volatility and geopolitical tensions that continue weighing on market psychology.
Support has developed around the $753.57 session low, representing the critical defense level for near-term sentiment, while deeper technical backing should emerge in the $750-752 area where previous breakout zones provide natural buying interest for value-oriented accounts. A breakdown below $753 would confirm the shift in momentum and could accelerate selling toward the $748-750 support cluster, particularly if rising yields or continued energy market strength begin pressuring corporate margins and economic growth expectations during this period where systematic rebalancing flows can amplify directional moves as institutions position portfolios for changing market conditions.
Expected Price Action
Thursday's session presents actionable intelligence generated by our AI model, with SPY projected to trade within a $753 to $766 range. This thirteen-point trading window indicates the market will trend rather than consolidate, following Wednesday's decline that left SPY positioned at $754.13 near the lower portion of the projected range with a bearish bias. The close below the psychologically important $755 level despite average volume suggests controlled selling interest persisted through the session, though Thursday's action will determine whether bears can extend momentum or if support emerges at lower levels within the anticipated range.
The immediate battleground centers on the $760 resistance level that represents the defining gate above current prices, serving as the critical pivot that could unlock Thursday's directional bias. Breaking above $760 with conviction opens the pathway toward $761 where the heaviest concentration zone awaits, followed by $763 as the next major decision point and $764 marking the expected move top. Maximum upside extends to $766 where significant call wall resistance should cap advances. On the downside, defending $754 becomes crucial for preventing further deterioration, while losing this level cleanly accelerates attention toward $753 where the maximum downside target and significant buying interest should emerge. The market's position near Wednesday's lows suggests Thursday's opening tone will be critical in determining whether this represents a minor pullback within the broader uptrend or the beginning of more sustained selling pressure.
Trading Strategy
The modest decline with steady participation creates tactical opportunities around established technical levels, while the VIX rose 1.78% to 16.05 indicates slightly elevated market stress that warrants reducing position sizes as anxiety readings climb from their recent comfortable ranges. Long entries appear compelling on any further weakness toward the $752-754 support zone where institutional buying has historically emerged, targeting initial profits at $757-758 and extended moves toward $760-761 if oversold conditions generate meaningful rebounds. The increasing volatility metric suggests implementing tighter stops below $751 to protect against any breakdown of the support structure that has provided stability during previous sessions.
Short setups develop strength near the $758-759 resistance area with downside targets toward $754-755 and stops above $760, as the measured selling pressure could accelerate if bears gain conviction at these technical levels. The higher anxiety readings support reducing position sizes while favoring selective entries over aggressive positioning, particularly given the broad-based weakness across major indices. Monitor for breakdown confirmation below $753 with expanding distribution volume, as institutional selling remains critical for extending any decline beyond current support levels.
Rising market scenarios favor reversal trades above $759 with confirming buying activity targeting the $762-764 area, while declining conditions would focus on violations below $752 toward $748-750 support zones. Risk management should reflect the elevated volatility environment by implementing stops around 1.0% from entry levels rather than allowing wider protection, as the VIX increase suggests potential for more volatile price swings despite markets maintaining their overall technical framework. Emphasize support-based buying strategies that can capture oversold bounces while the combination of measured selling and rising stress readings indicates markets preserve defensive characteristics that favor disciplined contrarian approaches with enhanced risk controls.
Model’s Projected Range
SPY's projected maximum range for Thursday is $745 to $759, with the Put side dominating in an expanding band that suggests trending price action with intermittent chop. Thursday brings no economic news due out so the market will trade on technicals. SPY closed at $754.13, down 0.72%, after opening at $758.15 and hitting a high of $758.80 before selling off to a low of $753.57 on lower than average volume. The VIX rose 1.78% to 16.05, suggesting elevated fear given the afternoon selling pressure. SPY remains in the $750 to $755 range that has defined recent trading, with markets continuing to digest ongoing geopolitical tensions in the Middle East. Our model shows resistance at $755, where a break targets $759, while support sits at $750 with a violation pointing toward $745. The long-term bull trend remains intact above $640 with SPY well above structural support, and as long as price holds above key structural levels, this remains a broader dip-buying environment. Absent a catalyst, resistance sits at $755, $759, $760, $761, while support rests at $750, $745, $740. We favor buying dips at $750 given SPY's close near the bottom of the recent range. Bitcoin declined 2.17% below $65,259 while MAG stocks showed mixed action with NVIDIA down 3.62% but Meta surging 4.24%, suggesting sector rotation rather than broad weakness. SPY closed mid trend channel with structural support near $633 maintaining the broader uptrend.
Market State Indicator (MSI) Forecast
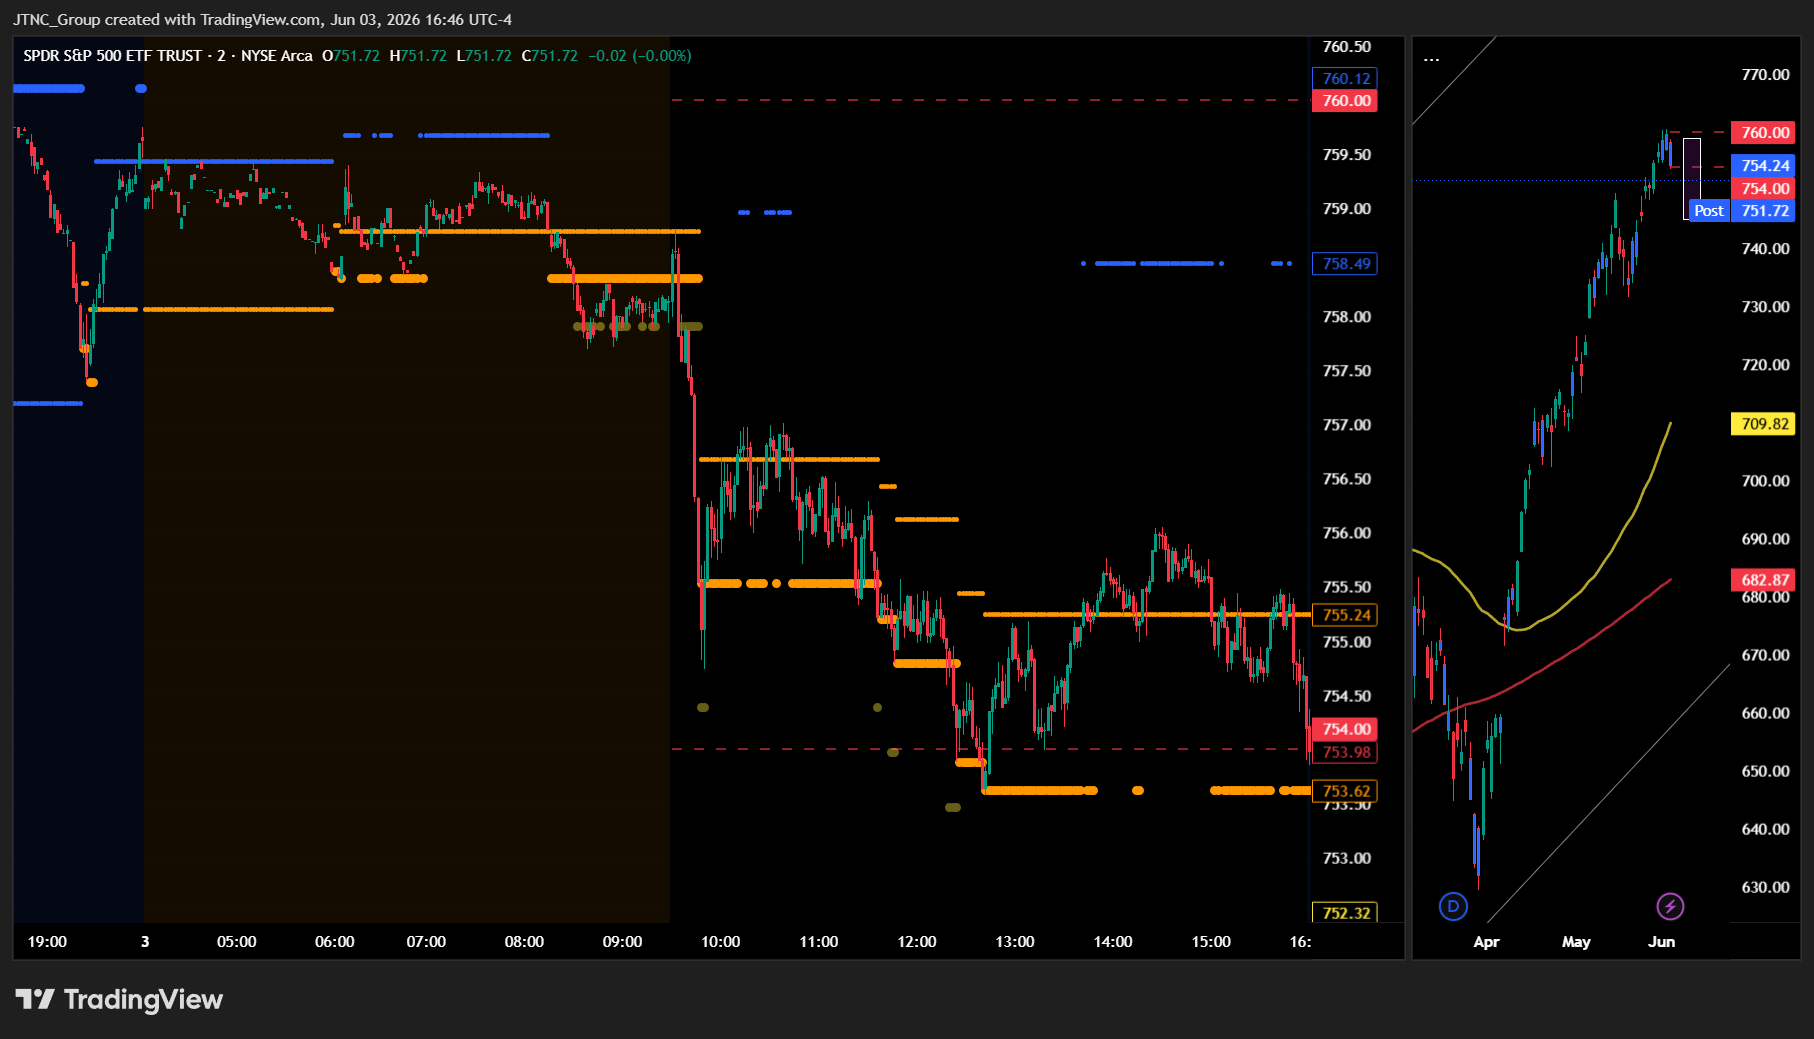
Current Market State Overview:
The MSI ended in Bearish Trending Market State with SPY closing at $754.13. Since SPY closed between MSI support at $753.62 and MSI resistance at $755.24, these levels maintain their roles as support and resistance for the next session. Extended targets were printing below at the close. The MSI rescaled lower overnight to a ranging state but by the open it had rescaled to a narrow bearish state with extended targets below. This foretold the rapid drop in SPY just after the open as the MSI continued to rescale lower throughout the day. While the range was relatively narrow and dips were bought, by 1 pm the MSI had settled into a wide bearish state and without extended targets below, traded in a range until the close where SPY once again tested the days lows. Extended targets were visible in premarket and throughout the AM session, PM session, and into the close. The moderate spread of $1.62 indicates a tight range but the bearish configuration with extended targets below signals continued selling pressure. For Thursday the MSI is forecasting a strong continuation lower with the bears maintaining pressure and extended targets below suggesting downside momentum will persist. MSI support is $753.62 with resistance at $755.24.
Key Levels and Market Movements:
Tuesday we stated, "Bulls want to see overnight strength hold current levels and push toward levels above the MSI resistance at $760.12," and added, "bears want to see the MSI support level at $757.2 fail to press price toward lower levels around the session lows," while also noting, "With the MSI closing in Bullish Trending Market State with a moderate configuration, Wednesday is likely to continue the direction from today's session as SPY closed up 0.13%, making any dip to MSI support at $757.2 a potential buying opportunity targeting higher levels if bulls can hold that key level." The session delivered exactly what bears wanted as the overnight weakness broke below the prior MSI support and continued lower throughout the session. The MSI rescaled lower multiple times during the session, creating new resistance levels that bears successfully defended. The first major setup came at the open when price tested the $758 level and failed, providing a short entry targeting the new MSI support near $754. As the MSI continued to rescale lower, each rally attempt toward resistance was met with selling pressure, offering multiple shorting opportunities throughout the session. The final test of the session lows into the close confirmed the bearish control as price failed to mount any meaningful recovery despite several attempts. Bears maintained complete control from the premarket weakness through the close, systematically breaking down each support level as the MSI rescaled to accommodate the selling pressure. At minimum it was a 4-for-4 session for traders following the framework. It was an easy day to read and execute with substantial setups, all identified through proper context, patience, and flexibility while leveraging the MSI, premarket levels, and market structure rather than forcing trades. The MSI continues to prove its reliability as the cornerstone of our trading process.
Trading Strategy Based on MSI:
Thursday has light economic news but the wide bearish MSI with extended targets below suggests continuation lower is the most likely outcome. Bulls want to see overnight strength hold current levels and push toward levels above the MSI resistance at $755.24, while bears want to see the MSI support level at $753.62 fail to press price toward lower levels around $745 where a bounce is expected. With the MSI closing in Bearish Trending Market State with a moderate configuration, Thursday is likely to continue the direction from today's session as SPY closed down 0.72%, making any rally to MSI resistance at $755.24 a potential shorting opportunity targeting lower levels if bears can defend that key level with conviction. However, if bulls can push price above $755.24 and hold with volume, it would signal a shift toward higher levels and target the session highs around $758. The moderate spread of $1.62 indicates room for price movement and suggests continuation of the bearish momentum is expected, though the tight range also leaves room for a potential relief rally if buying emerges. Failed breakouts at MSI resistance are the highest probability setups, with any rally toward MSI resistance at $755.24 offering potential shorting opportunities if bears can defend that level with volume and conviction. The moderate bearish configuration suggests bears maintain control entering Thursday's session, and with extended targets printing below, the downside momentum appears poised to continue. Bears need overnight selling pressure to push below $753.62 and target the $745 level where support is expected, while bulls need to see the resistance at $755.24 fail and price to break above current levels toward the session highs around $758. The long-term bull trend remains intact above $640 and failed breakouts and failed breakdowns continue to offer the highest-probability setups. Remain flexible, avoid trading during Ranging Market States unless a clear failed breakout or breakdown presents itself, and ensure all trades are fully aligned with MSI signals. Providing real-time insights into market control, momentum shifts, and actionable levels, the MSI when integrated with our Pre-Market and Post-Market Reports continues to sharpen execution precision and elevate trade quality. If you haven't yet integrated MSI and our model levels into your process, now is the time. Contact your representative to get started as these tools are designed to support consistency and enhance performance.
Dealer Positioning Analysis
Dealers are selling SPY $760 to $774 and higher strike Calls while buying $755 to $759 Calls, indicating the Dealers' desire to participate in any rally on Thursday. The ceiling for Thursday appears to be $761. To the downside, Dealers are buying $754 to $701 and lower strike Puts in a 4:1 ratio to the Calls they're selling displaying strong concern that prices could move lower. Dealers are no longer selling ATM Puts but are buying ATM Calls looking to participate in any rally that may ensue on Thursday. Below $750 is bearish and above $760 is bullish with the range in between filled with traps and chop. Should SPY fail to hold $750 the next stop is likely $745. Dealer positioning is unchanged at bearish.
Looking Ahead to Next Friday:
Dealers are selling SPY $760 to $781 and higher strike Calls while buying $755 to $759 Calls, indicating the Dealers' desire to participate in any rally into the end of the week. The ceiling for next week appears to be $765. To the downside, Dealers are buying $754 to $690 and lower strike Puts in a 5:1 ratio to the Calls they're selling displaying strong concern that prices could move lower. Dealers are buying ATM Calls to participate in any rally into the end of the week. That said they have added to their hedge and have only small long Call positions implying uncertainty that price may stabilize and rally into the end of the week. They remain bullish above $760 but below $759 expect the market to continue to fall with heavy support between $745 and $750 which may slow any decline. For the week Dealer positioning is unchanged at bearish. We advise reviewing Dealer positioning daily for directional clues. These positions evolve quickly and tracking them is essential for staying ahead of shifting market sentiment.
Recommendation for Traders
SPY's decline to $754.13 with VIX climbing 1.78% to 16.05 signals increasing caution is warranted. Consider taking profits on long positions above $757 and avoid new bullish entries until SPY reclaims $758 convincingly, while keeping stops tight given the broad-based selling across all major indices.
Position sizing should remain conservative as Treasury yields pushed above the critical 4.5% threshold to 4.490% and crude oil's surge above $96 continues fueling inflation concerns. Be sure to review the premarket analysis posted before 9 AM ET for any changes in the model's outlook and Dealer Positioning.
Good luck and good trading!
