Market Insights: Monday, June 2nd, 2025
Market Overview
Stocks pushed higher on Monday despite renewed tensions between the U.S., China, and the European Union over trade. While headlines around tariffs and retaliatory rhetoric initially weighed on sentiment, markets once again shook off the noise to post solid gains, continuing May’s bullish momentum into June. The S&P 500 gained roughly 0.4% and the Nasdaq rose 0.7%, with the Dow adding just 0.1%. The bounce came after President Trump reignited tariff fears late Friday by vowing to double duties on imported steel and aluminum to 50%. China quickly responded Monday, accusing the U.S. of breaking the Geneva tariff truce, while the European Union publicly pushed back on Washington’s escalating stance. Despite the renewed saber-rattling, investors largely took the developments in stride. As Ed Yardeni noted, compared to April’s more violent reactions, markets are now “barely reacting” to new tariff volleys. The U.S. dollar softened amid concerns that rising inflation and weaker growth could compound the effects of trade friction, while gold rose on renewed safe-haven interest. Meanwhile, ISM data showed continued contraction in U.S. manufacturing, with imports falling to their lowest since 2009, a sign that global demand pressures are beginning to bite. With all eyes now turning to this week’s heavy economic calendar, culminating in Friday’s jobs report, investors are increasingly focused on how trade risks and rate expectations may shape the Fed’s path forward.
SPY Performance
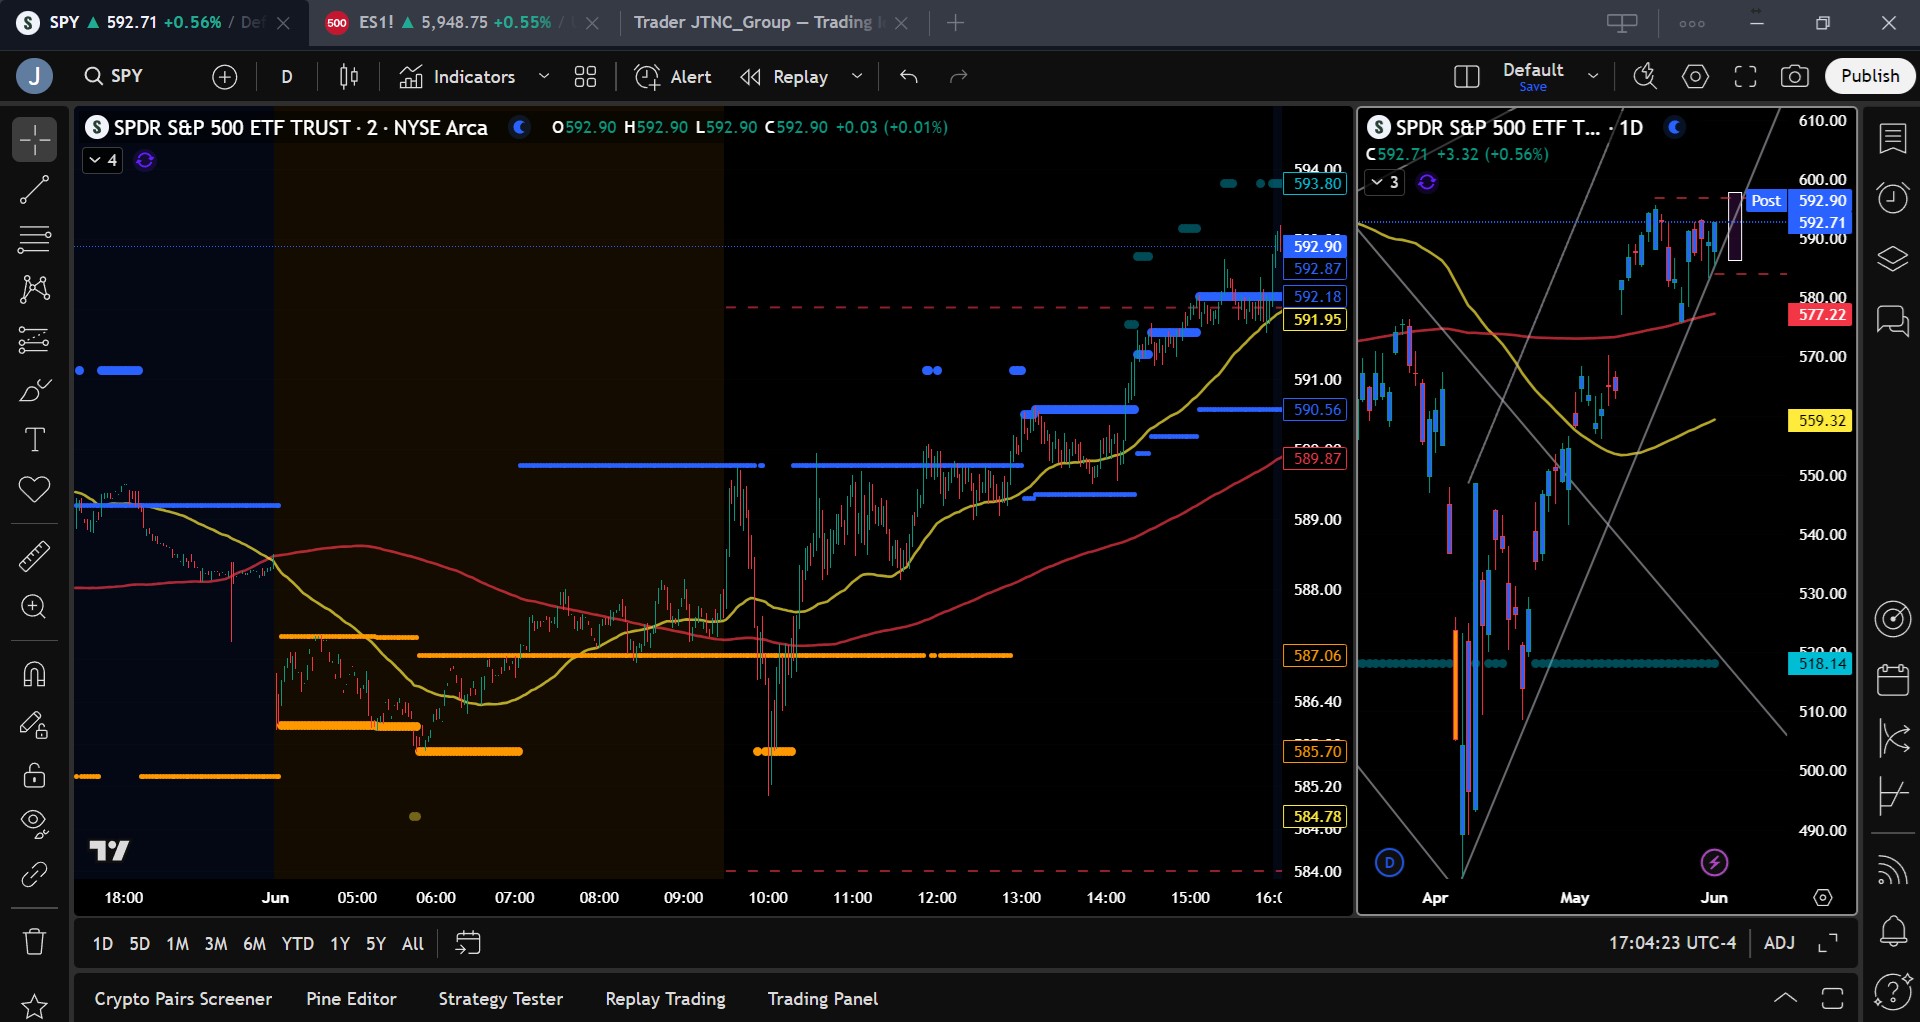
SPY rose 0.55% on Monday to close at $592.61 after opening at $587.88. The index briefly dropped to $585.07 before reversing higher into the close, peaking at $592.78. The bounce off the $585 level reinforced its importance as a key support zone, while volume came in at an average 55.67 million shares. The rally helped SPY regain lost ground and set up a test of overhead resistance. With bulls defending lower levels and regaining control late in the day, the broader uptrend remains intact, although continued gains may face headwinds as resistance thickens above $593.
Major Indices Performance
The Nasdaq led Monday’s session with a 0.67% gain, powered by strength in big tech names like Meta. The S&P 500 followed with a 0.4% rise, while the Dow inched up just 0.08%, reflecting some lag in value stocks amid trade concerns. The Russell 2000 posted a more modest 0.23% advance, consistent with cautious investor positioning in smaller caps amid macro headwinds. Sector performance skewed toward growth and tech, as cyclicals and defensives traded mixed. Markets appeared resilient despite rising geopolitical risks and weaker-than-expected manufacturing PMI data, underscoring an ongoing appetite for equities heading into a data-heavy week.
Notable Stock Movements
Meta led the Magnificent Seven with a standout 3.65% gain, fueling optimism in the tech space. Most other members of the group also traded in the green, helping lift the broader market. Alphabet and Tesla were the lone exceptions, each dropping over 1% as investors booked profits after recent runs. The mixed action in this influential group reflected an ongoing rotation, but with leaders like Meta pushing higher, sentiment around tech leadership remained positive. These names continue to drive the Nasdaq and overall risk appetite, keeping the group’s direction closely watched.
Commodity and Cryptocurrency Updates
Crude oil surged 3.87% to $63.14, bucking recent trends as the dollar slipped. Despite this short-term bounce, our model continues to anticipate a decline toward the $50 level over time, driven by rate-driven dollar strength. Gold rallied 2.73% to $3,406 as investors sought safety amid escalating trade rhetoric and a weaker economic backdrop. Bitcoin was relatively flat, slipping 0.12% to close just above $104,800. We remain buyers of Bitcoin between $83,000 and $77,000, but we caution against entries below $77,000 due to increased downside risk.
Treasury Yield Information
The 10-year Treasury yield climbed 0.59% to 4.441%, inching closer to the 4.5% danger zone for equities. While the move was modest, it signaled continued pressure on bonds as inflation and trade risks remain elevated. Yields under 4.5% still offer a supportive backdrop for equities, but the market remains sensitive to any breakout above that threshold. A continued rise could shift sentiment and spark equity weakness, especially with several key data prints looming.
Previous Day’s Forecast Analysis
Friday’s forecast anticipated a range between $583 and $595 with a modestly bullish bias above $585. Upside targets were identified at $590, $592, and potentially $597, while downside support was expected at $583 and $580. The strategy favored long trades above $583, cautioning against shorts unless $585 failed decisively. It also suggested momentum might be weakening and advised traders to fade moves into resistance unless supported by strength. Overall, the model called for two-way price action with clarity likely to emerge after Powell’s remarks or new economic data.
Market Performance vs. Forecast
Monday’s session validated the prior forecast nearly point for point. SPY opened at $587.88, dipped to $585.07, then reversed and surged into the close to end at $592.61, right into the upper end of the projected range. The $585 level once again proved to be critical support, and the reversal from that zone provided an ideal long entry for traders following the script. Resistance near $592 was tested but not meaningfully broken, in line with the forecast’s expectation of upside capped by weakening momentum. The projected range of $583 to $595 held firm, and both the bias and trading strategy performed exceptionally well in real-time.
Premarket Analysis Summary
In Monday’s premarket analysis posted at 8:19 AM, SPY was trading at $587.51 with a bias level set at $588.50. The note anticipated early weakness unless the index could reclaim $588.50 quickly. Downside targets were $587, $584, and $580, while upside levels included $590, $592, and $597. The tone leaned cautious, favoring short trades into resistance and long trades only if strength returned above $590. It also emphasized that rallies could fade quickly without sustained momentum and advised profit-taking on any upside strength.
Validation of the Analysis
The premarket analysis proved highly accurate. SPY struggled early, dipping just below $585 before staging a sharp reversal. The bounce from that support zone aligned perfectly with the analysis, which highlighted $584 and $580 as viable long entry zones if a reversal took shape. Once SPY reclaimed $588.50 and moved above $590, it quickly climbed toward the $592 target. Traders who followed the plan, fading weakness and taking profits into resistance, were rewarded with clean setups and well-timed entries. Monday’s tape once again showcased the value of the premarket roadmap.
Looking Ahead
Tuesday brings the JOLTS Job Openings report in the premarket, a data point that could influence near-term Fed expectations. While not typically a major market mover, any significant miss or surprise could generate volatility in early trading. With Wednesday’s ADP and Friday’s Nonfarm Payrolls still ahead, traders are positioning cautiously, balancing hopes for softening labor data against the risks of inflation remaining sticky. Tariff headlines continue to pose an unpredictable wildcard.
Market Sentiment and Key Levels
SPY closed Monday at $592.61, maintaining its position just below key resistance and comfortably above critical support at $585. Market sentiment remains cautiously bullish, with bulls still in control so long as SPY holds above $585. Immediate resistance levels now sit at $593, $595, and $597, while support can be found at $585, $583, and $580. A sustained move above $593 could pave the way to retest recent highs near $598.50, while a break below $585 could shift momentum and invite selling into the mid-$570s. Traders should remain focused on these boundaries as macro catalysts unfold this week.
Expected Price Action
Our AI model projects a range between $587 and $595 for Tuesday. This slightly narrower range reflects the loss of momentum and a likely period of consolidation. The bias remains bullish above $585, and bulls are expected to test resistance between $593 and $597. If SPY clears $597, we could see a run toward $600 and possibly new highs. However, failure to hold above $585 would shift the spotlight to $583 and $580. This is actionable intelligence: watch for consolidation early, with potential directional movement developing as traders react to Tuesday’s JOLTS data and brace for the week’s more impactful releases.
Trading Strategy
Traders should favor long setups above $585, with upside targets at $593, $595, and potentially $597. A break above $597 would suggest a push toward $600 is underway. Shorts can be initiated near $593 or higher if signs of exhaustion appear, especially on failed breakouts. On the downside, if SPY loses $585, look for support at $583 and $580 for potential bounce zones. Tighten stops on long trades near resistance, especially as volatility could rise with each new data release. The VIX dipped to 18.37, suggesting a calm market, but traders should not get complacent as macro risk remains elevated, and sharp reversals remain possible.
Model’s Projected Range
The model’s maximum projected range for Monday is $586.25 to $597.75, with the Call side dominating in a narrowing band suggesting choppy price action punctuated by brief trending moves. Manufacturing PMI came in weaker than expected, initially pressuring equities. Looking ahead, the JOLTS job openings report is scheduled for release in the premarket on Tuesday, followed by the ADP employment report on Wednesday. However, investor attention is firmly focused on Friday’s Jobs Report, which is expected to have the most significant impact on market direction. No major headlines are anticipated in the interim, although the potential for surprise developments from the White House remains. During Monday’s session, the market initially sold off from the $590 level but found support at the key $585 zone. From there, SPY reversed course and rallied into the close, ending the day up 0.56%, just shy of $593. As long as SPY closes above $585, the bulls maintain the upper hand. Although momentum has moderated, the model continues to suggest a high probability of retesting last week’s highs near $598.50 before any meaningful pullback occurs. A breakout to new all-time highs is still on the table. Key resistance levels are now observed at $593, $595, $597, and $600, while support levels are seen at $585, $583, and $580. SPY also bounced off the lower edge of its bullish trend channel, closing just above it. However, the steep slope of the current channel appears unsustainable, and a redrawing of the channel to reflect a shallower uptrend may be warranted, although the upward trend itself remains intact. Above $593, resistance is accumulating, which could limit near-term gains. Additional supply zones are forming above $597 and again above $600. On the downside, firm support is building below $585, extending to around $575. As a result, SPY may continue to trade in a range between $575 and $595 unless a new catalyst emerges to drive a breakout. If SPY holds above $585 on Tuesday, a push toward $597 remains likely. However, a break below $585 could trigger a more meaningful pullback and revive bearish sentiment. What was previously a battleground between $565 and $585 has now shifted to the $575–$595 range, where institutional investors appear to be reducing exposure and increasing downside protection. Trading volume was average, indicating a relatively balanced session. Since early April, market direction has been heavily influenced by macroeconomic data, bond yields, inflation trends, tariffs, and fiscal policy, a dynamic expected to persist absent a major policy change. Lastly, the VIX declined by 1.08% to 18.37, remaining comfortably below the critical 23 level, which typically signals a supportive environment for equities. Given ongoing volatility and macroeconomic uncertainty, traders are advised to remain nimble and responsive to evolving market conditions in the days ahead.
Market State Indicator (MSI) Forecast
Current Market State Overview:
The MSI is currently in a Bullish Trending Market State with SPY closing above MSI resistance turned support. There are extended targets printing into the close implying a fairly strong bull trend which may see follow through on Tuesday. Overnight the market sold off and tested the $585 level once again before rallying into the open to as high as $589.79. The MSI moved from a narrow range, weak bearish state to a ranging state and then back to a bearish state as SPY resisted the push above $590. But the narrow range bearish state did not have any extended targets and as such, SPY reversed and the MSI rescaled to a ranging state then rescaled higher several times to a bullish state with extended targets printing for much of the move into the close. Currently MSI support stands at $590.56 with resistance at $592.18.
Key Levels and Market Movements:
On n Friday, we noted: “We expect a continuation of the current range-bound environment, with a potential retest of today’s lows followed by a possible rally toward $595.” We also stated, “Upward momentum appears intact, and dips are likely to be bought,” and finally, “We continue to favor long setups on pullbacks, with support extending down to $583. Tactical shorts may be considered above $592.” With this actionable plan in hand, SPY opened the day just shy of $590 at MSI resistance and set up a textbook failed breakout. While we typically avoid trading the MSI in a ranging state, this setup at major resistance was too clean to ignore. We entered short with an initial target at MSI support at $587. This level was hit quickly, and with the MSI rescaling lower into a bearish state, we set T2 at MSI support at $585.70 where we assessed odds of success at over 69%. After a brief dip below this level, another textbook failed pattern prompted a reversal long as SPY reclaimed $586. Given the weak MSI (lacking extended downside targets), strong support at $585, and overall bullish control, the long was a clear call. We set T1 at MSI resistance at $587 and held for a second target at $589.75. This level was reached before 11 AM. We then moved our stop to breakeven and trailed the remaining 10% of the position. With two solid trades in the bank, we shifted to profit protection mode. SPY continued to cooperate, climbing through a series of bullish rescalings with extended targets. We ultimately exited the remainder at the close above $592. A strong start to the week, two-for-two, thanks to a clear, well-structured plan and disciplined execution. The MSI provided invaluable insight into market control, timing shifts, and actionable levels, allowing for precise entries and exits. Paired with our structured trading framework and model levels, the MSI remains an indispensable tool for consistency and performance.
Trading Strategy Based on MSI:
JOLTS job data carries only a minor potential to influence markets on Tuesday. The bigger risk remains tariff-related headlines from the White House. However, traders appear increasingly desensitized to these developments. Should fresh headlines emerge, the best approach remains to trade the market in front of you. Absent a major catalyst, we anticipate a continuation of the current environment, with SPY potentially testing $589 overnight before resuming its move higher toward $595 or even $597. Upward momentum remains intact, and dips continue to be bought. As long as $585 holds, upside potential extends to $597. A break below $585 shifts focus to $583, with a failure there potentially triggering a deeper decline toward $580 or lower. Such a move would mark a key inflection point, possibly signaling a shift in control back to the bears and bringing the $575–$595 range into play, an area where institutional participants have been actively hedging long exposure. Barring that breakdown, the path of least resistance remains to the upside. A sustained move above March’s highs could pave the way for new all-time highs. We continue to favor long setups on pullbacks, with support extending down to $583. Tactical shorts may be considered above $593, but only in the event of a failed breakout accompanied by a weakening MSI. Currently, the MSI remains in a bullish state, supporting the case for continued follow-through on Tuesday. That said, sideways price action may develop, and two-way trading opportunities remain viable. As long as SPY holds above $585, long positions remain favorable. A sustained move below this level could invite renewed bearish pressure. Failed breakdowns continue to offer high-quality long entries—stay alert and ready to act when those setups emerge. As always, align your strategy with the MSI and avoid trading during Ranging Market States. Stay disciplined and responsive to shifts in momentum and structure. The MSI provides real-time insight into both, and when used alongside our Pre-Market and Post-Market Reports, it helps identify high-probability setups with greater precision. These tools keep you aligned with the tape and help reduce costly errors. If you haven’t yet integrated the MSI and model levels into your trading process, now is the time. Contact your representative to get started as these tools can make a meaningful difference in your consistency and performance.
Dealer Positioning Analysis
Summary of Current Dealer Positioning:
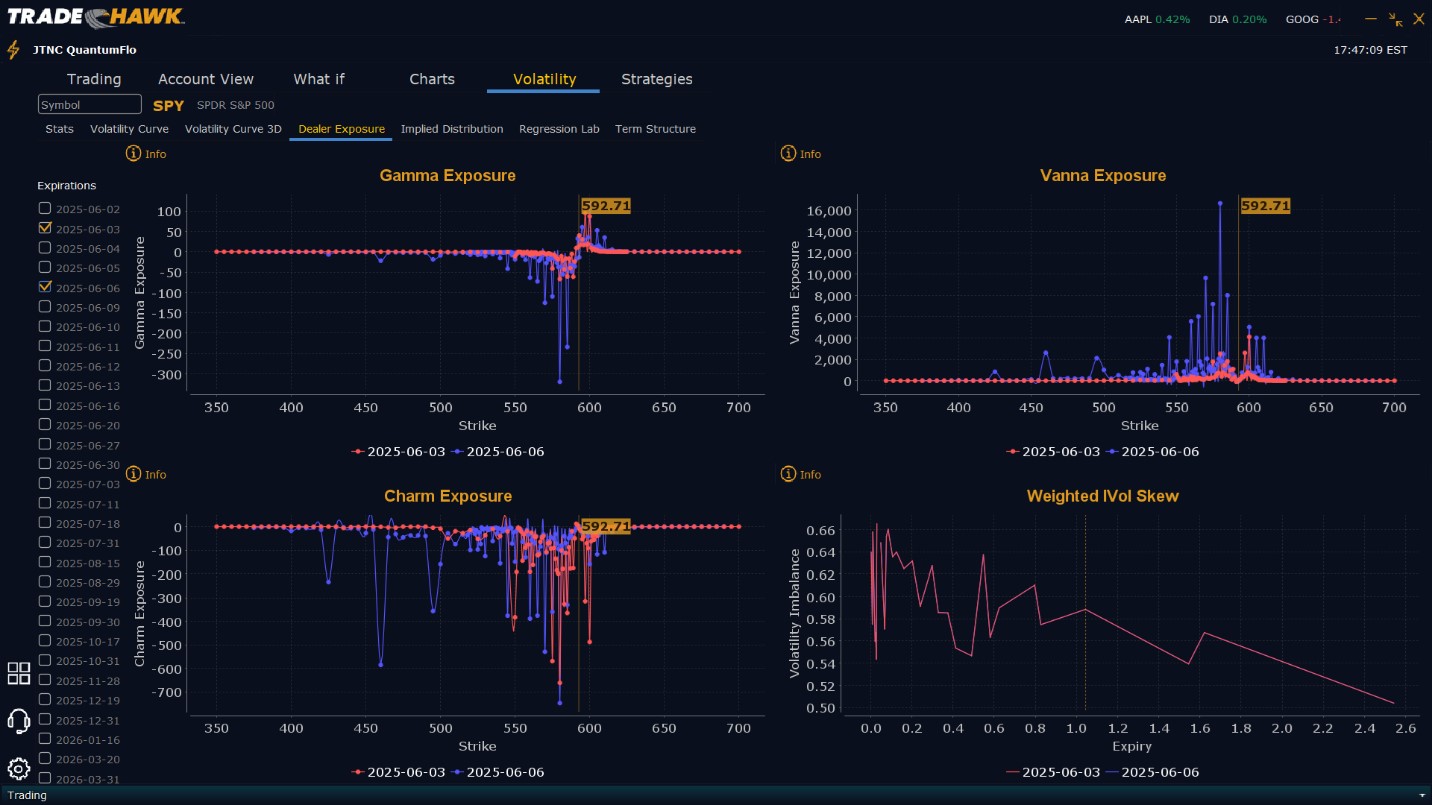
Dealers are selling SPY $593 to $605 and higher strike Calls indicating the Dealers belief that price may stall near the current levels. Any rally on Tuesday appears to have a peak of $597. To the downside, Dealers are buying $592 to $550 and lower strike Puts in a 2:1 ratio to the Calls they’re selling. Dealer positioning is unchanged from neutral to neutral for Tuesday.
Looking Ahead to Friday:
Dealers are selling $593 to $615 and higher strike Calls implying a likely ceiling in the market this week of $600. Dealers are positioned for a rally to this level but not beyond. To the downside, Dealers are buying $592 to $520 and lower strike Puts in a 3:1 ratio to the Calls they’re selling, reflecting a slightly bearish outlook for the week. Dealer positioning is unchanged from slightly bearish to slightly bearish. We advise reviewing Dealer positioning daily for directional clues. These positions evolve quickly and tracking them is essential for staying ahead of shifting market sentiment.
Recommendation for Traders
SPY closed firmly above $585 at $592.61, maintaining bullish momentum into a pivotal week. Long trades remain favorable above $585, with upside targets at $593, $595, and $597. A breakout beyond $597 could reignite momentum toward $600. If SPY slips below $585, watch for quick retests of $583 and $580, levels where buyers may defend. Short trades can be considered near resistance, especially on failed breakouts above $593, but should be managed tightly given the trend. The VIX dropped to 18.37, reflecting complacency, but with key economic data ahead, volatility could return quickly. As always, review the premarket analysis posted before 9 AM ET to account for any changes in the model’s outlook and in Dealer Positioning.
Good luck and good trading!
