Market Insights: Thursday, June 25th, 2026
Market Overview
Thursday's session was a study in contrasts, with the market split between relief from Micron's blowout earnings and fresh anxiety over Big Tech's cash burn and a hotter-than-expected inflation print. The Nasdaq slipped 0.6% while the S&P 500 hugged the flat line and the Dow edged up 0.2%, staying within striking distance of a new record thanks to its lighter tech exposure. Micron surged more than 15% after crushing earnings and guidance, easing some of the AI valuation fears that have rattled the market, but the hyperscalers couldn't shake concerns over dwindling free cash flow from heavy AI spending. Apple fell nearly 6% after raising prices on MacBooks and iPads due to surging memory and storage costs, and Qualcomm jumped about 7% after announcing a push into data center chips and servers with a bold $15 billion revenue target in that space.
The PCE index — the Fed's preferred inflation gauge — showed prices heating up again in May, largely tied to the fallout from the Iran war, and that's enough to keep rate hike speculation firmly on the table. Oil markets caught a modest bid, with Brent crude ticking up to $75 a barrel and WTI settling near $71, as supply continued flowing back through the Strait of Hormuz following the easing of tensions.
SPY Performance
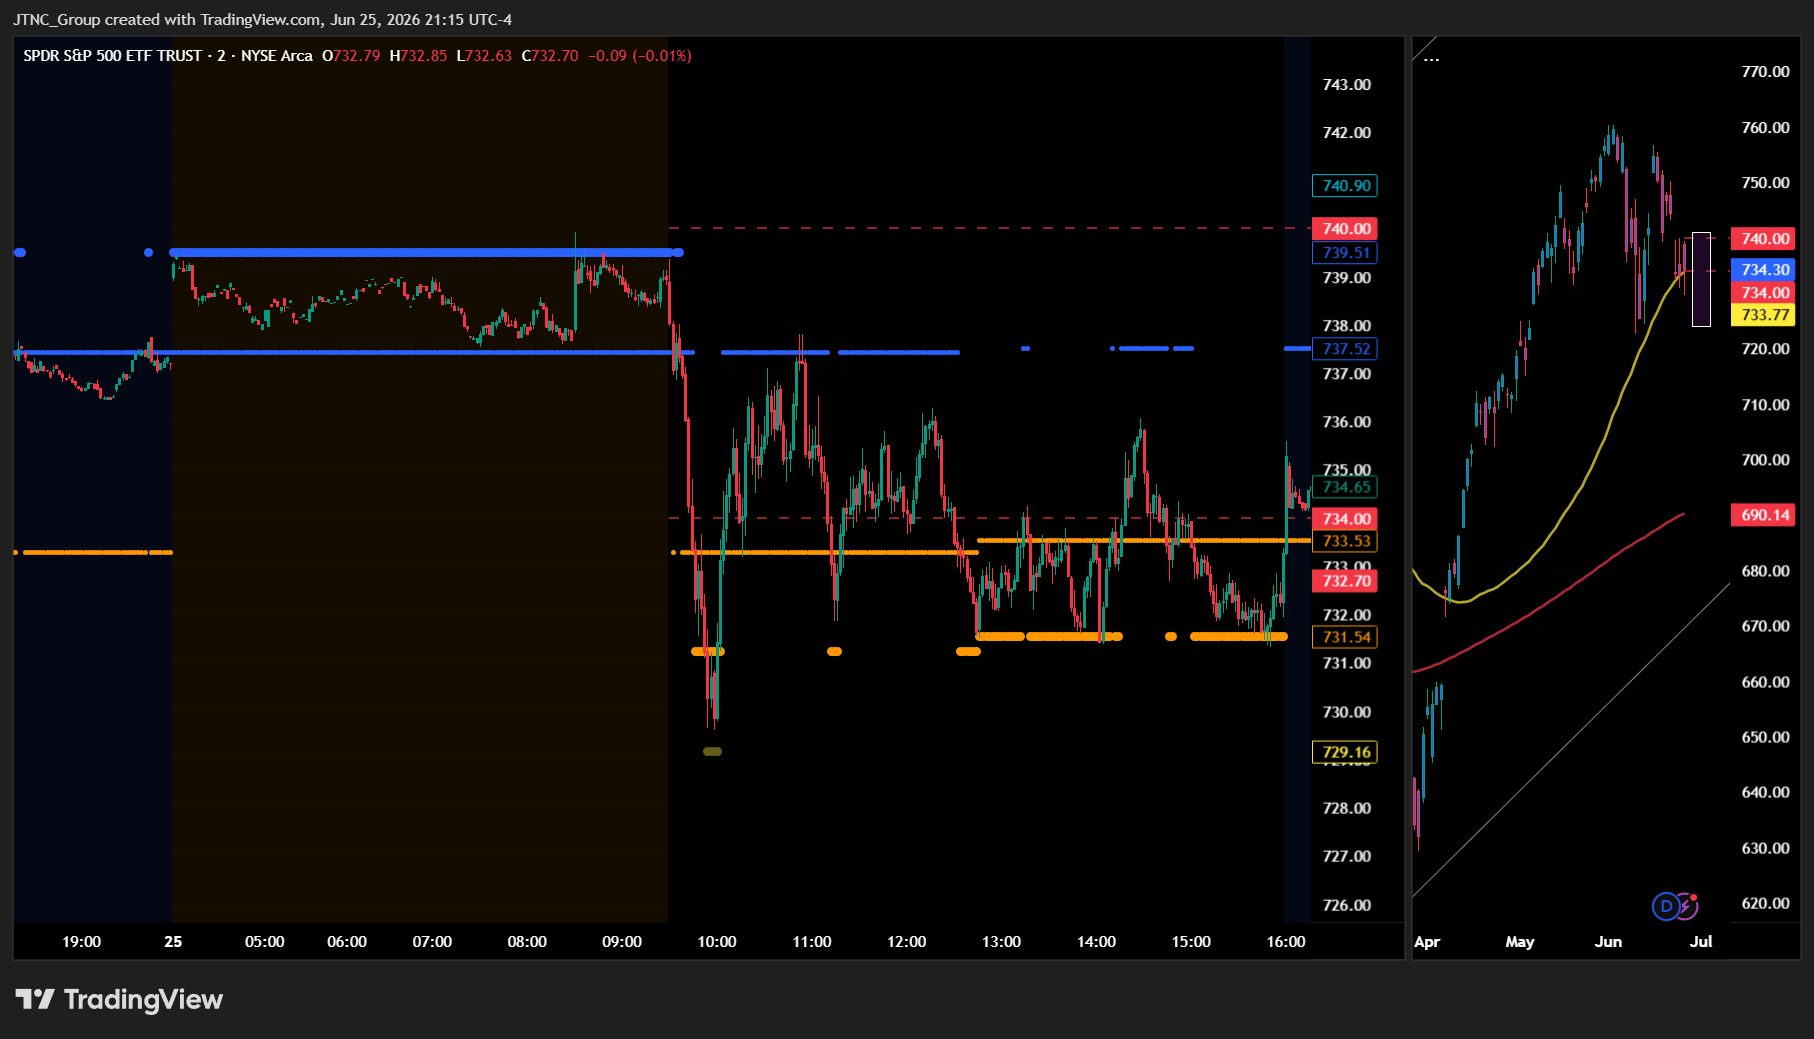
SPY opened at $738.91 and almost immediately ran into resistance, with the session high of $739.35 getting rejected early before the tape rolled over and spent the bulk of the day under pressure. The action had a distinctly defensive feel to it — not a chaotic selloff, but a slow, methodical drift lower that suggested sellers were in control without needing to be aggressive about it. There wasn't a single clean catalyst that flipped the switch, but the weight of recent technical damage kept a ceiling on any attempted bounce.
The low of $729.60 represented a meaningful intraday flush before buyers stepped in to stabilize things into the close, with SPY finishing at $733.50 — technically a gain of 0.04%, which rounds to flat on the day. Much like the prior session, that near-zero percent change masks what was actually a fairly choppy and uncomfortable ride. Closing flat after touching a session low more than nine points off the open is not the same as a quiet, orderly day — it's a recovery from weakness, which tells a different story about who's really in the driver's seat. Volume checked in at 47.27 million shares, near average, suggesting this wasn't a panic-driven move but rather a session where steady overhead supply continued to cap upside attempts. The VIX climbed another 3.27% to close at 19.24, and that's now a notable string of sessions where fear continues to find buyers even as SPY manages to close near unchanged. When protection keeps getting bid up on flat days, the market is quietly telling you the calm on the surface isn't the whole picture.
Major Indices Performance
The Russell 2000 was the top performer on the session, posting a gain of 0.34% in a day where conviction was hard to come by across the broader market. Small-caps punching above their weight like this is an interesting signal — when the mega-cap tech names are struggling, seeing the Russell hold its own and lead to the upside suggests there's still appetite for risk in the smaller, more domestically focused corners of the market. It's not a roaring endorsement, but small-cap resilience in a choppy tape is worth noting.
The Dow managed a gain of 0.14%, continuing its recent pattern of holding up better than the growth-heavy indices when sentiment gets wobbly. The blue-chip index benefited from the same dynamic that's been at work lately — investors leaning into value and defensively oriented names when the high-multiple tech trade gets uncomfortable. It wasn't a powerful move by any stretch, but green is green, and the Dow's ability to stay positive speaks to steady demand for its more traditional, dividend-paying components.
The Nasdaq was the laggard, dropping 0.46% as weakness in large-cap technology dragged on the growth index. The S&P 500 essentially finished flat on the day, but the Nasdaq bore the real weight of the session's selling pressure. The divergence between the Dow and Russell grinding higher while the Nasdaq slipped lower is a textbook rotation signature — money moving away from high-valuation growth names and finding shelter in smaller stocks and value-oriented plays. That kind of internal market shift doesn't always spell trouble ahead, but it's a dynamic worth watching as it develops.
Notable Stock Movements
Apple took center stage as the biggest drag on the Magnificent Seven today, sliding 6.12% in a session where the broader group once again posted a mostly red showing. A move of that size from Apple is impossible to ignore — this is the largest company in the world by market cap, and when it drops more than six percent in a single session, it doesn't just hurt portfolios, it reshapes sentiment across the entire large-cap tech space. Unlike a more volatile, momentum-driven name where a big swing might get shrugged off, Apple is a cornerstone holding in virtually every major fund and ETF, which means a loss like this tends to ripple outward fast.
The mostly red day from the Magnificent Seven is particularly striking when you consider how little the broader market actually moved. The Dow managed a modest 0.14% gain and small caps were slightly in the green, yet mega-cap tech couldn't find any traction. That kind of divergence tells a real story — when the tape is basically flat and the Magnificent Seven is still bleeding, the pressure isn't coming from macro panic, it's coming from something more targeted at this specific cohort. Apple's outsized decline carries enough index weight to do damage well beyond its own chart.
What makes today's weakness worth taking seriously is the context of the prior session's struggles as well. The Magnificent Seven has now put together back-to-back rough days, and with Apple — a stock that institutional money treats almost like a defensive position within tech — leading the losses, the group's footing looks shaky heading into the next session. The VIX rising 3.27% to 19.24 confirms that unease is still building under the surface, and until mega-cap tech finds a reason to stabilize, it's hard to make a convincing bull case for the group in the near term.
Commodity and Cryptocurrency Updates
Crude oil bounced back sharply on the session, climbing 2.27% to $71.94 and putting some distance back above that $70 psychological level that briefly looked vulnerable during yesterday's steep selloff. Crude has now rallied well above where most longer-term expectations had it anchored, and the supply and geopolitical dynamics driving that premium aren't showing any signs of fully fading. One rough session followed by a quick recovery is exactly the kind of pattern that keeps energy bulls engaged. The concern for Fed watchers is straightforward — crude holding above $70 and reclaiming ground keeps inflation pressures alive in the energy complex, and a sustained move at these levels or higher gives policymakers even less room to maneuver on rate cuts.
Gold snapped back nicely from yesterday's rough session, gaining 1.20% to close at $4,038 and reclaiming some of the ground lost when it cracked below that psychologically significant $4,004 level. The recovery reinforces the idea that institutional players weren't bailing on the trade — they were shaking out weak hands. The macro backdrop of elevated uncertainty and persistent inflation concerns continues to underpin the bull case, and one bad session followed by a quick reversal is exactly what a healthy uptrend in a safe-haven asset looks like.
Bitcoin couldn't participate in gold's recovery, sliding another 2.36% to close below $59,556 and extending what is increasingly looking like a meaningful correction from recent highs. The crypto market continues to trade in line with broader risk sentiment rather than charting its own path, and losing the $59,556 level is a notable technical development that bulls will need to address quickly. The next few sessions will matter — either Bitcoin finds its footing and reclaims lost ground, or the selling pressure deepens into something more structurally concerning.
Treasury Yield Information
The 10-year Treasury yield extended its recent pullback today, slipping another 1.33% to close at 4.390%. That's two consecutive sessions of relief, and yields are now sitting comfortably below the 4.5% threshold that separates manageable rate pressure from real headwinds for equities. The trend over the past couple of days has been constructive, and if it holds, it gives the broader market one less obstacle to deal with heading into the next session.
The buffer zones within our framework have improved slightly from yesterday. There are now 41 basis points of separation between current yields and the 4.8% level where selling pressure historically picks up, 61 basis points before the 5% threshold that signals serious market risk, and 81 basis points before the 5.2% level associated with a correction of 20% or more. Those cushions are incrementally better than yesterday's readings, but they're not wide enough to declare the all-clear — one hot inflation print or a hawkish tone out of the Fed could close that gap quickly.
What's interesting is that even with yields declining for a second straight session, equities barely responded. The Mag Seven were mostly red, the Nasdaq closed lower, and the VIX actually rose 3.27% to 19.24 — not exactly the reaction you'd expect if the market were cheering falling yields. That divergence suggests investors remain skeptical that this pullback in yields is durable. The key level to watch is whether 4.390% holds or if yields drift back toward 4.5% in coming sessions. A clean hold below that line would be a genuine positive signal. A reversal back above it would quickly reignite rate anxiety.
Previous Day’s Forecast Analysis
Thursday's forecast set up around a nineteen-point projected range with $727 as the downside floor and $746 as the max upside target, with the bias leaning modestly bearish given that Wednesday's close at $733.30 was sitting below the critical $738 gate level. The model made clear that the burden was squarely on the bulls to reclaim $738 with conviction before any real recovery could take shape — without that, the tape was expected to stay under pressure.
The key levels to watch were straightforward. On the upside, $738 was the immediate gate, $740 was the heavyweight resistance where the major call wall was concentrated, and $742, $743, and $746 rounded out the ceiling. On the downside, $736 was the first line of defense, $735 was identified as the heaviest negative gamma strike and the critical downside trigger, and a break there on volume was expected to accelerate selling toward $734, then $732, and ultimately $727 as the model's max downside and line in the sand.
The trading strategy called for reduced position sizing at roughly 70-75% of normal given the VIX sitting at 19.70, with wide stops to handle elevated intraday volatility. Long setups were favored in the $730-732 zone targeting $736-738 initially, with a secondary push toward $739-740 if participation improved, and stops placed below $729. Short setups made sense in the $736-738 band on any low-conviction bounce, targeting $732-733 first and $729-730 on a deeper flush, with a clean break below $732 reopening fresh short entries targeting $728-730 and stops above $735. The overarching message was patience — at 19.70 on the VIX, chasing extended moves was a losing game.
Market Performance vs. Forecast
Thursday's session delivered a fascinating case study in how the model's structural framework can anchor price action even when the tape opens in unexpected territory. SPY gapped up to open at $738.91, essentially tagging the forecast's critical $738 gate level right at the bell — the very level the model identified as the key upside tell and the threshold where conditions firm up into constructive territory. That gap-up open validated the directional logic embedded in the framework, as buyers clearly absorbed the overnight narrative and drove price directly into the zone the model had flagged as the defining decision point for the entire session.
What the forecast got right was the structural significance of $738 and the $739-740 resistance band. The session high of $739.35 essentially kissed that resistance cluster before sellers materialized, confirming the model's identification of $739-740 as the key decision point for whether bulls could extend any move — they couldn't, and the tape reversed from precisely the level the framework said to watch. From there, price worked its way back down through the session, ultimately finding the low at $729.60 and closing at $733.50, a nearly flat finish of 0.04% that mirrors Wednesday's behavior in character if not in direction. The downside action respected the structural layers the model outlined — $736 gave way and accelerated the move lower, exactly as the forecast described. Traders running short setups from the $736-738 band with targets toward $732-733 saw the thesis execute with precision, and those who followed the risk management guidance to keep stops defined had protocols working as intended throughout the session. The VIX rising 3.27% to 19.24 reinforced why position sizing discipline at 70-75% of normal remains the right posture in this environment, and the framework's emphasis on patience over chasing moves continues to prove its worth. The model's structural logic remains sharp, and Thursday's price action gave traders multiple clean reference points to work from throughout the day.
Premarket Analysis Summary
The premarket analysis posted at market open identified SPY at $737.89 in a call-dominated environment, building on two consecutive constructive sessions and pushing for further upside. The expected range spanned from $729 on the max downside up to $746 as the cap on the upside move. The defining gate was set at $738 — the immediate level just above spot where positive gamma would firm up and buyers could establish control. Above there, $740 was flagged as the heaviest concentration zone of the day and the major call wall, with $742 as the next decision point, $744 as additional resistance, and $746 capping the expected move as max upside. The bias was constructive given the back-to-back stabilization sessions, but the analysis was clear that $740 was the gate needed to confirm real conviction on the recovery. On the downside, $737 was the first level to watch with a clean break expected to stall the rally attempt, and $736 was identified as the negative gamma flip zone and immediate downside trigger where selling could accelerate. Further support was outlined at $734 and $732, with a notable put wall at $730 just above the $729 line in the sand at the bottom of the expected move.
The actual session sided decisively with the downside framework. SPY opened at $738.91, briefly flirting with the $738 gate, but the high of $739.35 fell well short of the critical $740 confirmation level — exactly the scenario the analysis warned about when it called $740 the defining test for upside conviction. From there, price reversed sharply, slicing through $737, $736, $734, and $732 in succession, with the low of $729.60 reaching all the way to the max downside target. The close at $733.50 landed in the weak zone the premarket had identified between $732 and $736, confirming the downside framework played out in full. VIX rising 3.27% to 19.24 reflected the renewed pressure, and the upside targets at $742, $744, and $746 went entirely untested on the day.
Validation of the Analysis
Today's session was another textbook example of the premarket framework delivering actionable intelligence before the open. The analysis set the stage with spot at 737.89 and immediately identified 738 as the "immediate gate" above, warning that 737 was the first level to watch on the downside and that losing it cleanly would "stall the recovery attempt." SPY opened at $738.91, briefly clearing that gate and tagging a session high of $739.35 — essentially kissing the 738-740 zone the premarket flagged as the "heaviest concentration zone of the day" before stalling out cold. Traders who understood that 740 was the gate needed to "confirm real upside momentum" knew immediately that $739.35 falling short of that level was a significant tell. The rejection at the call wall was clean, and the reversal that followed was swift.
Once the 738 gate failed to hold and price surrendered 737, the premarket's downside roadmap took over entirely. The analysis was explicit: losing 737 cleanly would be followed by 736 as the "negative gamma flip zone and a key battleground," with a break there putting 734, then 732 in play, and 729 identified as the "line in the sand" at the bottom of the expected move. SPY honored that sequence with remarkable precision, selling off from the open high all the way down to a session low of $729.60 — essentially tagging 729 to the penny. Every level the premarket outlined served as a logical entry, add, or target point for traders working the framework short. The close at $733.50 settled right between the 732 and 734 decision points, two levels the analysis had explicitly mapped as key zones on the way down. With the VIX surging 3.27% to 19.24, confirming the deteriorating conditions, today's session reinforced just how valuable having these levels defined before the open truly is.
Looking Ahead
Friday's economic calendar is quiet, with no high-impact releases scheduled to move the needle. That actually gives traders a clean runway to digest Thursday's Core PCE and Final GDP prints and position accordingly. After a session that could see meaningful volatility around those two heavyweight reports, a calm Friday lets the market settle into whatever narrative wins out.
With no catalysts forcing the hand, price action on Friday will likely be driven by follow-through from Thursday's data, end-of-week positioning, and any lingering sentiment shifts from the broader macro picture. It's the kind of session where the trend that establishes itself early tends to hold, so paying attention to the open and early tape will be key to reading how participants want to carry things into the weekend.
Market Sentiment and Key Levels
The directional bias today is cautiously tilted toward the bears, though the margin is thin enough to keep both sides guessing. SPY barely moved on a percentage basis, closing up just 0.04%, but the intraday story is more telling — the session opened near the highs, pushed to a peak of $739.35, then sold off to a low of $729.60 before recovering to close at $733.50. That kind of fade from the top of the range and a close stuck in the middle is not the behavior of a market with confident upside momentum. The VIX climbing 3.27% to 19.24 is worth watching carefully — it's now sitting just below the 20 threshold that tends to signal rising anxiety, and a sustained move above that level would give bears more ammunition heading into the next session.
Key resistance is $739.35, the intraday high from today's session. That level was tested early and promptly rejected, and bulls will need a strong catalyst with real follow-through volume to reclaim it. A convincing close above $739.35 would flip the tone meaningfully more constructive and suggest the earlier selling was just noise. On the downside, $729.60 is the critical support level to watch — that's where buyers stepped in today, and a break below it on elevated volume would be a serious warning signal, potentially opening the door to further downside toward the $726 area. The index divergence adds an important layer — the Dow and Russell 2000 both finishing in the green while the Nasdaq slipped -0.46% points to tech continuing to drag on overall market health, especially with the Magnificent Seven mostly red. Gold surging 1.20% to $4,038 reinforces that safe-haven demand is alive and active, and Bitcoin's -2.36% decline below $59,556 adds a quiet risk-off tone underneath the surface. Rising oil prices could keep inflation concerns in play as a headwind. Until bulls can defend $729.60 and reclaim resistance, the bears hold the edge.
Expected Price Action
Friday's session presents actionable intelligence generated by our AI model, with SPY projected to trade within a range defined by $729 on the downside and $746 as the max upside target. That seventeen-point window signals the market will trend rather than consolidate, and with Thursday's close at $733.50 sitting well below the critical $740 gate level, the bias leans modestly bearish heading into Friday — the bulls made little progress on the session despite opening near $739, and the burden remains on them to reclaim $738 before any meaningful recovery can gain traction.
The defining level heading into Friday is $738, which the model identifies as the immediate gate where positive gamma firms up and conditions turn constructive. A clean reclaim of $738 opens the door to $740, where the heaviest concentration zone of the day sits alongside the major call wall — that becomes the pivotal decision point for whether buyers can extend any recovery with conviction. Above $740, $742 is the next meaningful resistance, followed by $744, with $746 capping the expected move as max upside. On the downside, $737 is the first level to watch — losing it cleanly would stall any recovery attempt before it starts. Below there, $736 is the negative gamma flip zone and the immediate downside trigger, where selling could accelerate in a hurry. A break of $736 puts $734 in play as the next decision point, followed by $732 as key support. If $732 gives way, $729 is the model's line in the sand and max downside, with the notable put wall at $730 just above offering some cushion. The $740 gate is the upside tell, and $736 is the downside trigger — how Friday responds at those two levels will determine how the session ultimately resolves.
Trading Strategy
The VIX rising 3.27% to 19.24 is a meaningful uptick in fear that deserves attention, even as the session finished essentially unchanged on the surface. At 19.24, the fear gauge is elevated enough to keep position sizing dialed back to roughly 70-75% of normal, and any trader ignoring that signal is playing with fire in a tape that showed a nearly ten-point intraday range with very little net progress. Near-average volume on a session that went nowhere tells you the market is coiling rather than resolving, and that kind of compression tends to precede a sharp directional move once participants finally commit to a side.
Long setups look compelling in the $729-731 zone, which aligns tightly with the session low and represents the area where buyers stepped up and halted the decline during today's trading. Entries in that range should target $736-738 as the first profit zone, with a secondary objective near $739 if volume picks up and the tape begins to carry higher with conviction. Stops on longs belong below $728 to keep risk clearly defined and avoid getting dragged through a true breakdown. In a rising market scenario, a clean breakout above $739 on solid participation becomes the green light to add exposure, with upside targets stretching toward $743-744 and stops trailed up to $736 to protect the developing gain.
Short setups are most attractive in the $736-739 band, where any low-conviction bounce is likely to stall and fade back into the range. A failed rally that can't push through $739 and begins rolling over sets up a clean short with initial downside targets at $732-733 and a deeper flush toward $729-730 if sellers take real control of the tape. In a declining market scenario, a decisive break below $731 reopens short entries targeting $728-729, with stops placed above $734. With the VIX sitting at 19.24, keep stop-loss parameters in the 1.5-2% range from entry, scale back size on every new position, and never chase extended moves in either direction — volatility at this level rewards discipline and punishes overcommitment without exception.
Model’s Projected Range
SPY's projected maximum range for Friday is $724 to $742, with the Put side dominating in a contracting band that suggests choppy price action with intermittent trending periods. Friday brings PCE inflation data which the Fed closely watches and could drive significant volatility, particularly given the hawkish tone from last week's FOMC meeting and Bank of America's call for three rate hikes later this year. SPY closed at $733.50, essentially flat with a gain of just 0.04%, after opening at $738.91 and trading between a high of $739.35 and a low of $729.60 on near-average volume of 47.27 million shares. Despite Micron's blowout earnings that sent the memory chipmaker surging 16% after revenue quadrupled year over year to $41.46 billion, the broader market couldn't sustain gains as Apple dropped over 6% and Microsoft fell 3% after both announced consumer hardware price increases tied to higher memory costs. The long-term bull trend remains intact above $640 with SPY still well above structural support, though the Nasdaq's fourth consecutive decline and the VIX climbing 3.27% to 19.24 suggest growing unease beneath the surface. If our first resistance at $735 breaks, price targets $738, while a break of first support at $731 would target $728. Should $724 fail to hold, there is little to keep price from falling toward $720. Absent a catalyst, resistance sits at $735, $738, $740 and $742 with support at $731, $728, $725 and $724. SPY closed near the lower line of the downtrend channel with structural support near $640.
Market State Indicator (MSI) Forecast
Current Market State Overview:
The MSI ended in a Ranging Market State with SPY closing at $733.50. MSI support holds at $731.54 and resistance at $733.53, and since SPY closed inside the range, those levels remain in their respective roles heading into Friday. Extended targets were not printing at the close, though they did appear above during the AM session, offering a brief window of upside energy early in the day before sellers took control and pushed price significantly lower. In premarket, extended targets were visible above as well, which kept the overnight tone elevated and provided early directional energy for bulls heading into the open.
The MSI rescaled higher overnight, opening the day in a wide Bullish Trending state with extended targets above, keeping price elevated through the premarket session. At the open, the MSI reversed sharply as price dropped from $739 down to $729, with the MSI rescaling lower into a Ranging state with few extended targets below, suggesting the move was more of a stop hunt than a true directional breakdown. Price recovered partially through the afternoon but the MSI failed to rescale back into a Bullish Trending state, instead settling into a wide Ranging state into the close. The moderate spread of $1.99 gives price limited room within the current bands, which reinforces the sideways tone and keeps both levels close enough that clean breakouts in either direction remain possible with even a modest catalyst. The VIX rose 3.27% to 19.24, a reminder that underlying anxiety has not fully dissipated and remains a quiet headwind for any sustained push higher. The MSI is forecasting sideways to slightly higher price action for Friday as a continuation of today's action, though without extended targets at the close the move may be modest and is likely to find resistance at key levels above. MSI support is $731.54 with resistance at $733.53.
Key Levels and Market Movements:
Wednesday we stated, "Bulls want to see overnight strength hold above $733.3 MSI support and push price back through $737.47 resistance with enough conviction to trigger a rescale into a Bullish Trending state," and added, "Any rally toward $737.47 that stalls and reverses is a potential shorting opportunity targeting $733.3 MSI support and the levels below it, while any dip that holds and bounces near $733.3 could offer a quick long setup targeting $737.47 resistance above," while also noting, "If the Ranging state holds into the open and neither MSI level breaks with conviction, keep expectations measured, reduce size, and wait for the cleanest entries at the edges of the range where the risk-to-reward is most defined."
Thursday's session played out in dramatic fashion despite SPY ending the day nearly flat, up just 0.04%. The MSI rescaled higher overnight into a wide Bullish Trending state with extended targets printing above, which immediately gave traders a clear directional framework heading into the open — the overnight tape was elevated around $739 to $740, and the premarket extended targets confirmed that bulls were in control early. That was the first setup of the session as traders could lean long with the trend and target the extended levels above with the structure clearly on their side.
That setup reversed hard at the open. SPY opened at $738.91 and almost immediately began selling off, with the MSI rescaling sharply lower into a Ranging state as price dropped from $739 down to a session low of $729.60. The extended targets that had been printing above disappeared quickly, and with few extended targets appearing below during the drop, the MSI was signaling this was more likely a stop hunt than a sustained directional breakdown — a key distinction that kept disciplined traders from chasing the flush lower. That pivot from the Bullish Trending structure into a Ranging state was the clearest signal of the session, telling traders to stop leaning long at elevated levels and shift their focus to the MSI levels now defining the new range. Price began recovering through the afternoon with a partial bounce, but the MSI never rescaled back into a Bullish Trending state, and instead consolidated into a wide Ranging state into the close with SPY settling at $733.50. The second setup of the session came as price recovered off the lows and traders could buy the dip toward MSI support targeting resistance above within the newly established range. At minimum it was a 2-for-2 session for traders following the framework. It was an easy day to read albeit not an easy day to trade given the sharp intraday reversal and choppy afternoon recovery. But substantial setups were present, all identified through proper context, patience, and flexibility while leveraging the MSI, premarket levels, and market structure rather than forcing trades. The MSI continues to prove its reliability as the cornerstone of our trading process.
Trading Strategy Based on MSI:
Friday has light economic news so the market is likely to move more sideways to slightly higher than trend given the Ranging state at the close. The absence of extended targets at the close reinforces the idea that any upside Friday will be measured rather than explosive, and traders should calibrate their expectations accordingly. With the MSI settling into a moderate Ranging state and no clear directional catalyst on the calendar, the framework is pointing toward continued consolidation as the base case, with a slight upside lean that mirrors today's negligible gain.
Bulls want to see overnight strength hold above $731.54 MSI support and push price back through $733.53 resistance with enough conviction to trigger a rescale into a Bullish Trending state. A clean break and hold above $733.53 would be the clearest sign that Friday can extend the modest recovery that began Thursday afternoon and begin working toward the premarket levels that were rejected at the open. Bears want to see $733.53 continue to cap any overnight or opening strength and press price back toward $731.54 MSI support, and if that level gives way on volume, deeper tests toward lower premarket levels become the next natural target as the MSI would likely rescale lower and reintroduce more meaningful downside momentum. Any rally toward $733.53 that stalls and reverses is a potential shorting opportunity targeting $731.54 MSI support and the levels below it, while any dip that holds and bounces near $731.54 could offer a quick long setup targeting $733.53 resistance above.
Given the Ranging state and the absence of extended targets at the close, failed breakouts and failed breakdowns within the range are the highest-probability setups Friday. Fading moves at the extremes — shorting strength near $733.53 and buying weakness near $731.54 — fits the framework best until the MSI shows a clear directional resolve. With the moderate $1.99 spread keeping the two levels tight, traders should be patient and wait for clean tests at the edges rather than reaching for entries in the middle of the range where the risk-to-reward is less defined. If an unexpected catalyst emerges and the MSI rescales into a trending state, follow that signal immediately and trade with the structure rather than against it. If the Ranging state holds into the open and neither level breaks with conviction, keep expectations measured, reduce size, and focus on the cleanest setups at the boundaries.
The long-term bull trend remains intact above $640 and failed breakouts and failed breakdowns continue to offer the highest-probability setups. Remain flexible, avoid trading during Ranging Market States unless a clear failed breakout or breakdown presents itself, and ensure all trades are fully aligned with MSI signals. Providing real-time insights into market control, momentum shifts, and actionable levels, the MSI when integrated with our Pre-Market and Post-Market Reports continues to sharpen execution precision and elevate trade quality. If you haven't yet integrated MSI and our model levels into your process, now is the time. Contact your representative to get started as these tools are designed to support consistency and enhance performance.
Dealer Positioning Analysis
Dealers are selling SPY $736 to $750 and higher strike Calls, indicating the Dealers' belief that prices are unlikely to push meaningfully higher on Friday. The ceiling for Friday appears to be $738. To the downside, Dealers are buying $732 to $678 and lower strike Puts in a 3:1 ratio to the Calls they're selling, displaying moderate concern that prices could move lower. Notably, Dealers are selling ATM Puts in small size near $733 to $735, indicating their belief that prices will continue to rise Friday. Dealers do not sell ATM Puts unless they believe there is a floor in the market at $733. They remain hedged, however, implying limited upside conviction. Below $732 is bearish and above $734 is bullish. Should SPY fail to hold $733, the zone from $727 to $732 will be choppy and full of traps. Dealer positioning is unchanged at neutral/slightly bearish.
Looking Ahead to Next Friday:
Dealers are selling SPY $736 to $755 and higher strike Calls, indicating the Dealers' belief that upside will remain capped into the end of next week. The ceiling for next week appears to be $740. To the downside, Dealers are buying $730 to $628 and lower strike Puts in a 4:1 ratio to the Calls they're selling, displaying strong concern that prices could move lower. That said, Dealers are selling ATM Puts broadly near $731 to $735, signaling conviction that prices will continue to rise. Dealers do not sell ATM Puts unless they believe there is a floor in the market at $731. There is clear resistance at $736 to $740, and Dealers appear positioned for a continuation of the rally, anticipating further upside into early July. Remain bullish above $731, but below $729 and especially $725 the posture turns bearish. For the week Dealer positioning is unchanged at bearish. We advise reviewing Dealer positioning daily for directional clues. These positions evolve quickly and tracking them is essential for staying ahead of shifting market sentiment.
Recommendation for Traders
With SPY closing at $733.50 and VIX rising 3.27% to 19.24, bulls need to reclaim $739.35 resistance to shift momentum higher — failure there keeps shorts in control with $729.60 as the key level to watch below. Favor a cautious approach until price action clarifies direction.
Keep stops tight and size down in this choppy environment. Review the premarket analysis posted before 9 AM ET for any changes in the model's outlook and Dealer Positioning.
Good luck and good trading!
