Market Insights: Wednesday, June 24th, 2026
Market Overview
US stocks mostly failed to mount a recovery Wednesday after Tuesday's brutal tech selloff, with the Nasdaq and S&P 500 slipping another 0.4% and 0.1%, respectively. The Dow managed a modest 0.3% gain, benefiting from its lighter tech exposure. Selling pressure in AI-linked names continued as concerns over stretched valuations, massive capital spending, and the prospect of rising interest rates kept profit-taking alive across high-flying growth stocks. Micron extended its losses from Tuesday ahead of its after-the-bell earnings report, which Wall Street was watching closely as a read on real AI demand — especially notable given the stock's more than 250% rally this year.
Oil was the other big story, with Brent crude tumbling 4% to $73 a barrel and WTI dropping to near $70 — the lowest levels since early March. Tankers began moving through the Strait of Hormuz as US-Iran nuclear talks showed tentative progress, but uncertainty remains. Adding a fresh wrinkle, Iran and Oman have started discussing a fee system for ships transiting the strait, which complicates President Trump's pledge that the waterway would stay toll-free.
SPY Performance
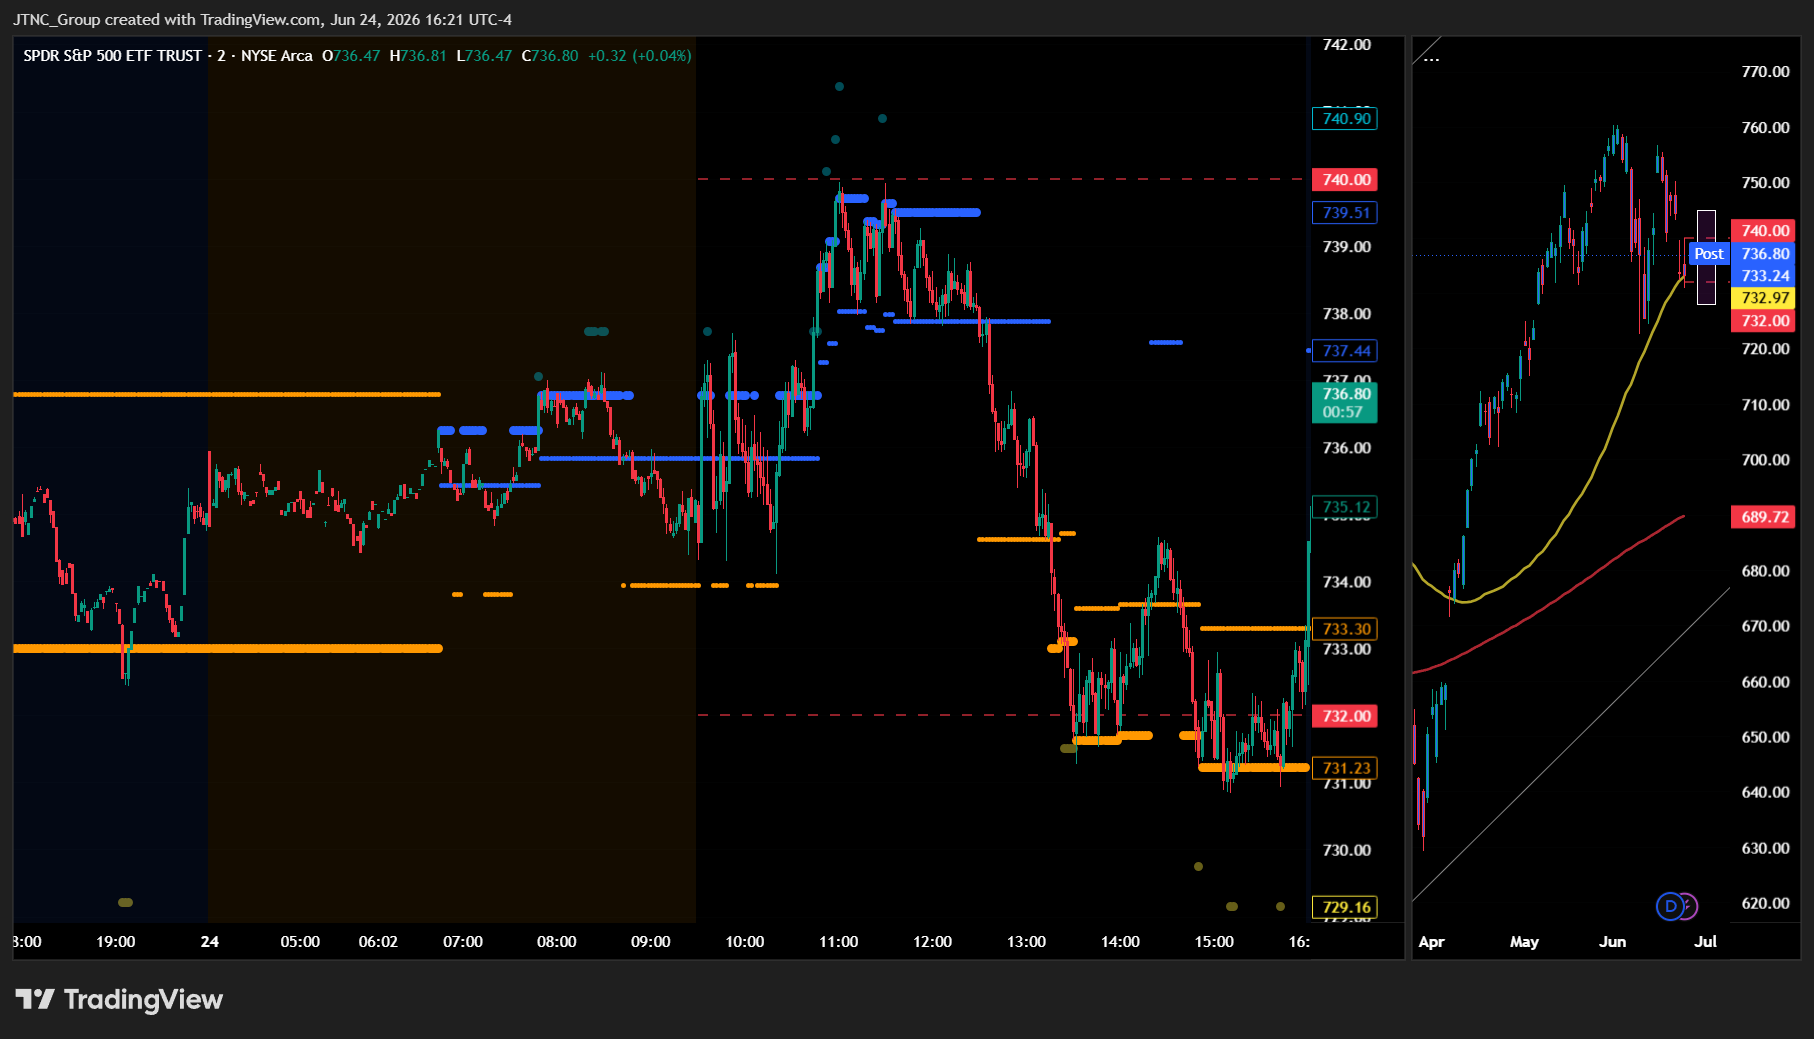
SPY opened at $735.17 and spent most of the session in a relatively tight range, with neither bulls nor bears able to establish meaningful control. The tone was indecisive from the start — not the kind of session where you see a clear narrative play out, but rather one where the market simply ground sideways as participants looked for a reason to commit in either direction and never found one.
The session high of $739.95 was tested but couldn't hold, and the low of $730.85 was touched without triggering any real sense of panic. SPY ultimately settled at $733.30, a loss of just 0.04% — essentially flat on the day. That sounds benign on the surface, but when you zoom out and consider the recent technical damage, a do-nothing session isn't exactly a ringing endorsement from the bulls. Holding flat after back-to-back rough days doesn't repair a damaged chart — it just delays the conversation. Volume came in at 45.35 million shares, near average, which tells you this was more of a quiet, directionless session than anything with conviction behind it. The VIX edged higher again, rising 1.08% to close at 19.70, marking another day of creeping fear despite the relatively contained price movement in SPY itself. Three consecutive sessions of VIX expansion — even modest ones — are worth paying attention to, as it reflects an underlying bid for protection that doesn't typically show up when the market is truly comfortable with its footing.
Major Indices Performance
The Dow was the standout on the session, gaining 0.35% and pushing against the grain of a broadly sluggish tape. Value-oriented and industrial names provided the lift, as money rotated away from the tech-heavy side of the market and found a home in the more defensive, dividend-friendly corners of the Dow. That kind of rotation is a classic sign of investors recalibrating risk without fully bailing on equities.
The Russell 2000 eked out a gain of 0.13%, a modest but noteworthy finish given the risk-off undertone that pressured other parts of the market. Small-caps are typically among the first to get hit when sentiment sours, so holding in positive territory — even slightly — speaks to some underlying resilience in the space. It wasn't a barn-burner, but it was enough to stay on the right side of the ledger.
The Nasdaq was the weakest of the major indices, slipping 0.43% as pressure in large-cap tech weighed on the growth-heavy index. The S&P 500 also finished fractionally lower, but the Nasdaq bore the brunt of the softness given its concentration in the names that took the hardest hits today. The divergence between the Dow's modest gain and the Nasdaq's decline is a familiar pattern — when tech stumbles and value holds firm, it tends to reflect a market that's repositioning rather than panicking, and today fit that mold almost perfectly.
Notable Stock Movements
Microsoft took the unwanted spotlight in the Magnificent Seven today, dropping 2.27% in a session where the broader group posted a mostly red showing. A loss of that magnitude from Microsoft carries real weight — this isn't a high-beta momentum name where big swings are part of the deal. Microsoft is the kind of steady, institutionally-owned anchor stock that tends to hold up when the rest of the group wobbles, so seeing it lead losses is a meaningful signal about where sentiment stands right now among large-cap tech investors.
The mostly red day from the Magnificent Seven stood in contrast to what was a nearly flat broader tape, which actually makes the group's weakness look worse in context. When the market overall barely moved and mega-cap tech still couldn't find its footing, that's not a sector being dragged down by panic selling — that's a sector carrying its own specific weight. Amazon was the lone standout finishing in the green, but one winner out of seven is hardly a reason to turn constructive on the cohort just yet.
What's worth noting is that the broader indices managed to hold together despite the Magnificent Seven's struggles, with the Dow eking out a 0.35% gain and small caps nudging fractionally higher. That divergence suggests some rotation away from mega-cap tech rather than outright market-wide fear, though the VIX ticking up 1.08% to 19.70 confirms that anxiety isn't fully off the table either. With Microsoft — one of the most defensively positioned names in the group — leading the decline, the Magnificent Seven's ability to reassert itself as a market driver in the near term is something traders will be watching closely heading into the next session.
Commodity and Cryptocurrency Updates
Crude oil took a hard hit on the session, dropping 4.29% to $70.07 — barely clinging to that $70 level that has served as a psychological anchor for the market. Despite today's sharp selloff, crude has spent a considerable stretch trading well above where most anticipated it would be, and the underlying dynamics that drove it there haven't fully unwound. One rough session doesn't erase the supply story or the geopolitical backdrop, but today's drop is a warning shot that the premium baked into prices could start coming out if demand concerns pick up steam. Even hovering right at $70, the Fed's inflation calculus remains complicated — energy prices at this level don't give policymakers much breathing room, and any snap-back rally would only deepen that headache.
Gold had an ugly session of its own, shedding 3.04% to close at $4,004 — a more significant pullback than the prior session's modest retreat and enough to crack a psychologically important round number on the way down. Still, context matters here. Gold has been trading at historically elevated levels, and even after today's damage, the yellow metal hasn't broken down in any way that threatens the longer-term bull case. The macro environment continues to provide a compelling reason to hold gold, and institutional players aren't reversing course on a core inflation and uncertainty hedge over one bad day.
Bitcoin followed the broader risk-off tone lower, falling 3.99% to close just above $60,170, extending what is now turning into a more meaningful correction from recent levels. The crypto market shed any pretense of independence today and moved firmly in line with the pressure hitting risk assets more broadly. Closing above $60,170 provides a thin but still-present technical foothold for bulls, and how Bitcoin responds from here will tell investors a lot about whether this is a shakeout or the beginning of a deeper retracement.
Treasury Yield Information
The 10-year Treasury yield finally caught a break today, pulling back 1.10% to close at 4.400%. That's a meaningful move in the right direction — yields have now dropped back below the 4.5% threshold that has been acting as the dividing line between manageable rate pressure and outright headwinds for equities. After hovering dangerously close to that level in recent sessions, today's retreat gives stocks a bit more breathing room heading into the next trading day.
The framework buffers have improved modestly with this pullback. There are now 40 basis points of separation between current yields and the 4.8% level where selling pressure historically accelerates, 60 basis points before the 5% threshold that signals serious market risk, and 80 basis points before the 5.2% level associated with a correction of 20% or more. Those cushions aren't enormous, but they're more comfortable than where yields were sitting just a session ago. The direction of travel today was constructive, and if this pullback has legs, it removes one of the more persistent overhangs that's been keeping institutional buyers cautious.
What's worth noting is that even with yields declining, the equity reaction was muted — SPY barely moved and the Nasdaq still finished in the red. That tells you the market isn't fully convinced this yield dip is sustainable. A single session of relief doesn't erase the recent pattern of grinding higher, and traders will be watching closely to see whether 4.400% holds or if yields quickly reclaim the 4.5% line. Any upside inflation surprise or hawkish Fed commentary could reverse today's progress in short order, putting equities right back in contested territory.
Previous Day’s Forecast Analysis
Yesterday's newsletter projected SPY trading within a range of $721 on the downside and $750 as the max upside target, a twenty-nine-point window that signaled trending rather than consolidating conditions. With Tuesday's close at $733.73 sitting below the critical $737 level, the bias leaned clearly bearish heading into Wednesday, with the burden placed squarely on the bulls to reclaim that level before any recovery could gain traction.
The model identified $737 as the defining gate where broken structure could attempt to repair, with negative gamma stacked overhead making any rally attempt an uphill battle. A successful reclaim of $737 was seen as opening the door to $740, then $742 as the major call wall, with $744 as the next resistance and $750 capping the upside. On the downside, $735 was flagged as the first critical level to watch given the heaviest negative gamma concentration, with a clean loss of that zone expected to accelerate selling toward $734, then $732. The $729 level was highlighted as the point of last hope where a major put wall and structural support converged, with failure there opening $721 as the model's max downside target.
The recommended trading strategy called for trimming position sizing to 70-75% of normal while widening stops to account for intraday whipsaws in an elevated volatility environment. Long setups were identified in the $730-732 zone targeting $736-738 initially, with secondary targets near $739-740, and stops placed below $729. Short setups carried stronger conviction given the conditions, with the $736-738 band flagged as the natural area to fade bounces, targeting $732-733 with a deeper flush potential toward $729-730. A clean break below $732 was seen as reopening short entries targeting $728-730, stops above $735, with stop-loss parameters kept in the 1.5-2% range from entry throughout.
Market Performance vs. Forecast
Wednesday's session unfolded in a way that validated the core directional framework while delivering a tighter, more contained range than the model's base case anticipated. SPY opened at $735.17, which landed right in the middle of the forecast's identified support zone between $734 and $736 — the model flagged $735 as the heaviest negative gamma zone and the first critical line to watch, and price essentially anchored to that level at the open, confirming the structural logic was well-calibrated. The session high of $739.95 pushed into the $739-740 resistance band the forecast explicitly identified as the initial profit target for long setups and the trigger zone for adding exposure — a near-perfect tag of that level before price retreated, giving traders who followed the framework a clean technical roadmap for the day.
What the forecast got right was the range definition and the key decision points. The $735 level as the pivot, the $739-740 band as resistance, and the $730-732 zone as downside support all held structural significance throughout the session, and Wednesday's price action respected each of those thresholds in sequence. The session low of $730.85 tested the lower boundary of the long entry zone the model had identified — $730-732 — and held, which is precisely why that level was flagged as the first credible area where buyers could defend the trend. The close at $733.30 represents a modest -0.04% decline, essentially flat on the session, which fits cleanly within the model's bear-leaning but non-trending scenario. Traders who entered longs near $730-732 with stops below $729 had risk management protocols working as designed throughout the session. The VIX edging up another 1.08% to 19.70 reinforced the guidance to keep position sizing at 70-75% of normal — disciplined exposure management remains the right approach at this volatility level, and the framework continues to provide the structural clarity needed to navigate it confidently.
Premarket Analysis Summary
The premarket analysis posted at market open identified SPY at $736.84 in a call-dominated environment, attempting to stabilize and recover after the prior session's sharp slide. The expected range spanned from $727 on the max downside up to $746 as the cap on the upside move. The defining gate was set at $738 — the level where conditions would firm up into constructive territory and confirm the recovery had legs. Above there, $740 was flagged as the heaviest concentration zone of the day and the major call wall, with $742 as the next decision point, $743 as additional resistance, and $746 capping the expected move as max upside. The bias was cautiously constructive, but the analysis made clear that $738 needed to be reclaimed and held with conviction given that spot was sitting right on the gamma flip zone. On the downside, $736 was the first level to watch, with a clean break expected to shift price back into weaker territory. The $735 strike was identified as the heaviest negative gamma level and the immediate downside trigger — the analysis specifically warned that losing $736 with volume would bring a swift test of $735, with potential acceleration below that. Further support was outlined at $734 and $732, with $727 serving as the line in the sand at the bottom of the expected move.
The actual session sided with the downside framework. SPY opened at $735.17, already below the critical $736 level the analysis had flagged as the first line of defense, meaning sellers had the upper hand from the start. The session never came close to reclaiming the $738 gate, with the high of $739.95 briefly threatening that level before getting turned away — confirming the resistance the analysis had identified there. The low of $730.85 sliced well through $732, extending into territory the analysis had only flagged as a possibility on a full breakdown, and the close at $733.30 landed in the weak zone between $735 and $732 where the premarket warned selling could pick up speed. VIX climbing 1.08% to 19.70 reinforced the continued pressure, with the upside targets at $740, $742, $743, and $746 going entirely untested on the day.
Validation of the Analysis
Today's session delivered another strong confirmation of the premarket framework, with SPY navigating the key levels mapped out before the open with impressive precision. The analysis opened with spot at 736.84 and immediately identified 736 as the first downside level to watch, warning that losing it cleanly would "shift price back into weaker territory" — and that's exactly how the day started. SPY opened at $735.17, already below 736, telling traders from the jump that the bears had the early edge and that the downside playbook was the one to follow.
The premarket laid out the downside sequence clearly: 735 as the "heaviest negative gamma strike," 734 as the next decision point, and 732 as key support. SPY honored that roadmap almost to the tick. Price tested and broke 735 early, continued through 734, and ultimately drove all the way down to a session low of $730.85 — pushing past 732 and threatening the deeper end of the expected move. Traders working the premarket framework had a well-defined trade from the moment 735 failed to hold, with 734 and 732 serving as logical add and target levels along the route lower. The close at $733.30 also confirmed 732 as a meaningful zone, with price recovering off the lows and settling just above that level by the end of the session.
On the upside, the 738 gate proved its worth as the defining ceiling the analysis said it would be. SPY rallied to a session high of $739.95, tagging the 738-740 zone almost perfectly before stalling out — right where the premarket called out "the heaviest concentration zone of the day" and "the major call wall." Traders who faded that push toward 740 with the analysis in hand had a clean, high-conviction setup with a clear invalidation level. Price rejected right at the call wall and fell back sharply, never threatening 742 or above. The VIX rising 1.08% to 19.70 further confirmed the unsettled conditions the analysis described, and the premarket's identification of 738 as the upside gate and 735 as the downside trigger proved to be the two most important numbers of the entire session.
Looking Ahead
Thursday brings two of the most market-moving data points the calendar has to offer — Core PCE Price Index and Final GDP, both dropping before the open. Core PCE is the Fed's preferred inflation gauge, so any deviation from expectations has the power to reprice rate cut odds almost instantly. A hotter-than-expected read puts the brakes on the easing narrative, while a soft print could give bulls fresh fuel heading into the back half of the week.
Final GDP lands alongside it, giving traders a clearer picture of how the economy actually performed. If both prints come in line or better, the setup favors continuation. If they conflict — say, soft growth but sticky inflation — expect the market to work through some volatility as participants figure out which data point matters more. Either way, Thursday is a live-fire session, and positioning going into the open will matter significantly.
Market Sentiment and Key Levels
The directional picture here is murky rather than definitively bearish, and that ambiguity itself tells a story. SPY shed just -0.04% on near-average volume of 45.35 million shares, which looks like a market stuck in neutral rather than one being driven by conviction in either direction. The session saw a decent intraday range — swinging from a low of $730.85 to a high of $739.95 — but the close at $733.30 landing closer to the lower half of that range suggests bulls couldn't hold the gains they briefly had. The VIX ticking up 1.08% to 19.70 keeps fear simmering just below the 20 level, a threshold that tends to draw attention when it's breached and held. It's not alarming on its own, but it's not the kind of volatility reading that gives bulls a clean green light either.
Key resistance sits at $739.95, today's intraday high. That level was tested and rejected, and any push back toward it will need a clear catalyst and follow-through volume to mean anything. A convincing close above $739.95 would shift the tone notably more constructive and suggest bulls are ready to build on recent levels. On the support side, $730.85 is the line in the sand from today's session low. A break below that on meaningful volume would be a credible warning sign and could open the door toward the $728 area and beyond. The divergence across indices adds texture — the Dow eking out gains while the Nasdaq slipped and the Magnificent Seven mostly finished red points to tech-specific drag as the primary pressure point rather than broad market deterioration. Gold dropping over 3% removes a key safe-haven signal, and Bitcoin's sharp pullback adds a quiet risk-off undercurrent. With yields pulling back slightly and crude selling off hard, there are crosscurrents working in multiple directions simultaneously. Bulls need a clean close above resistance to reassert control — until then, the tape belongs to whoever blinks first.
Expected Price Action
Thursday's session presents actionable intelligence generated by our AI model, with SPY projected to trade within a range defined by $727 on the downside and $746 as the max upside target. That nineteen-point window signals the market will trend rather than consolidate, and with Wednesday's close at $733.30 sitting below the critical $738 gate level, the bias leans modestly bearish heading into Thursday — buyers steadied the ship overnight in premarket, but the burden remains on the bulls to reclaim and hold $738 before any sustained recovery can take shape.
The defining level heading into Thursday is $738, which the model identifies as the immediate gate where conditions firm up into constructive territory. A clean reclaim of $738 with conviction opens the door to $740, where the heaviest concentration zone of the day sits alongside the major call wall — that level becomes the key decision point for whether the bulls can extend the move. Above $740, $742 is the next meaningful resistance, followed by $743 and ultimately $746 as the model's max upside and cap on the expected move. On the downside, $736 is the first level to watch — essentially where price sits, and losing it cleanly shifts the tape back into weaker territory fast. Below there, $735 is the heaviest negative gamma strike and the immediate downside trigger — a break of $735 on volume could produce a swift acceleration lower toward $734, then $732 as the next key decision point. If $732 gives way, $727 is the model's line in the sand and max downside. The $738 gate is the upside tell, and $735 is the downside trigger — how Thursday responds at those two levels will determine how the session ultimately resolves.
Trading Strategy
The VIX edging up 1.08% to 19.70 keeps the fear gauge in a zone that warrants continued respect, even if today's session was essentially a wash in terms of directional movement. At 19.70, volatility remains elevated enough to justify keeping position sizing at roughly 70-75% of normal, and stops need to stay wide enough to absorb the kind of intraday swings that come with this territory. The near-average volume on a nearly flat session signals that neither bulls nor bears were willing to commit with real conviction, which makes the range-bound price action both a caution sign and an opportunity — the next directional move could carry real force once the market picks a side.
Long setups look attractive near the $730-732 zone, which aligns closely with the session low and represents a key area where buyers stepped in during today's trading. Entries in that range target $736-738 as the first profit zone, with a secondary push toward $739-740 if participation picks up and the tape strengthens. Stops on longs belong below $729 to keep risk defined and prevent a deeper breakdown from becoming a damaging trade. In a rising market scenario, a convincing move above $739-740 on solid volume becomes the signal to add exposure, with upside targets in the $743-744 range and stops trailed up to $736 to protect gains as the trade develops.
Short setups make sense in the $736-738 band, where any low-conviction bounce is likely to run into resistance and stall. A failed rally in that range that can't hold above the open sets up a clean fade with initial downside targets at $732-733 and a deeper flush toward $729-730 if sellers take control with any real momentum. In a declining market scenario, a clean break below $732 reopens short entries targeting $728-730, with stops placed above $735. With the VIX sitting at 19.70, keep stop-loss parameters in the 1.5-2% range from entry, scale back size on every new setup, and resist chasing extended moves — volatility at this level rewards patience and punishes overcommitment every single time.
Model’s Projected Range
SPY's projected maximum range for Thursday is $724 to $745, with the Put side dominating in a contracting band that suggests choppy price action with intermittent trending periods. Thursday brings Micron Technology's highly anticipated earnings report after the bell, which will serve as a critical test of the AI trade's staying power and could set the tone for semiconductor and technology stocks heading into the end of the week. SPY closed at $733.30, essentially flat on the day with a loss of just 0.04%, after opening at $735.17 and trading between a high of $739.95 and a low of $730.85 on average volume as the market searched for direction following back-to-back sessions of heavy selling. The long-term bull trend is being tested with SPY trading just $93 above the critical $640 structural support level, though the proximity to the June 2 all-time high of $760.40 suggests the broader uptrend remains intact. The VIX rose 1.08% to 19.70, marking a third consecutive session of creeping fear that reflects growing demand for downside protection even as realized volatility remains contained. Bank of America's call for three Fed rate hikes in 2026 under Chair Warsh continues to weigh on sentiment, particularly in rate-sensitive growth stocks. If our first resistance at $735 breaks, price targets $739, while a break of first support at $731 would target $728. Should $724 fail to hold, there is little to keep price from falling toward $720. Absent a catalyst, resistance sits at $735, $739, $742 and $745 with support at $731, $728, $725 and $724. SPY closed just above the lower line of the downtrend channel with structural support near $640.
Market State Indicator (MSI) Forecast
Current Market State Overview:
The MSI ended in a Ranging Market State with SPY closing at $733.30. MSI support holds at $733.3 and resistance at $737.47, and since SPY closed inside the range, those levels remain in their respective roles heading into Thursday. Extended targets were not printing at the close, though they did appear above during the AM session, offering a defined window of upside energy early in the day before sellers took back control. In premarket, no extended targets were visible, which kept the overnight tone measured and offered no early directional edge for buyers heading into the open.
The MSI rescaled overnight to a very narrow Bullish Trending state, but by the open had printed extended targets above, which led to a meaningful rally that ran through the AM session. The MSI continued to rescale higher in rapid succession through the morning, clearly forecasting the rise as price pushed toward the session high of $739.95. But by midday the extended targets had stopped printing and SPY began to retreat, with the MSI rescaling lower to a Ranging state and then continuing to roll into a Bearish Trending state. The MSI kept rescaling lower through the PM session, with extended targets printing below, which saw SPY break the prior day's lows before finding support at the 50-day moving average. A bounce off that level carried price into the close, with the MSI rescaling back to a Ranging state as traders awaited Micron's earnings after the bell. The wide spread of $4.17 gives price meaningful room within the current bands, and while the overall session ended nearly flat on a percentage basis, the intraday range told a far more dramatic story. The VIX edged up 1.08% to 19.70, reflecting continued underlying anxiety that remains a headwind for any sustained rally. The MSI is forecasting sideways to slightly lower price action for Thursday as a continuation of today's action, though without extended targets at the close the move may be modest and is likely to find support at key levels below. That said, with Micron reporting strong earnings after the bell, it is possible the semiconductor space rallies and pulls SPY and QQQ higher on Thursday. MSI support is $733.3 with resistance at $737.47.
Key Levels and Market Movements:
Tuesday we stated, "Bears want to see $736.78 continue to cap any overnight strength and press price back toward $733 MSI support, and if that level gives way on volume, deeper tests toward lower premarket levels become the next natural target as the MSI would likely rescale lower and reintroduce more meaningful downside momentum," and added, "Any rally toward $736.78 that stalls and reverses is a potential shorting opportunity targeting $733 MSI support and the levels below it, while any dip that holds and bounces near $733 could offer a quick long setup targeting $736.78 resistance above," while also noting, "If the MSI rescales overnight into a Ranging state, keep expectations measured and trade the edges — failed breakouts near $736.78 and failed breakdowns near $733 offer the clearest entries."
Wednesday's session was anything but quiet despite SPY ending the day down less than a tenth of a percent. The MSI rescaled overnight into a very narrow Bullish Trending state and by the open was printing extended targets above, which immediately gave traders a clear long setup — buy dips to MSI support and target resistance and beyond as the tape launched higher. The first setup came early in the AM session as SPY opened at $735.17 and pushed toward the session high of $739.95, with the MSI rescaling higher in rapid succession confirming the move had momentum behind it. Traders following the framework had a clean long entry off MSI support targeting resistance above, with the extended targets providing additional confirmation that the trend was intact. That was the first clean setup of the session and it delivered a substantial move to the upside.
By midday the extended targets had stopped printing and the MSI began to shift, rescaling lower from a Bullish Trending structure into a Ranging state and then quickly into a Bearish Trending state. This transition was the clearest signal of the session — when the extended targets disappeared and the MSI pivoted, the framework told traders to stop leaning long and start looking for entries on the short side. The second setup materialized as SPY stalled near the upper portion of the range and rolled over, giving traders a short entry targeting MSI support at $733.3. The MSI continued to rescale lower through the PM session with extended targets printing below, which pressed SPY beneath the prior day's lows and toward the 50-day moving average. That level produced a bounce and a third and fourth setup as traders faded the extension and then caught the recovery bounce back toward MSI support from below, with the MSI rescaling back to Ranging into the close. At minimum it was a 4-for-4 session for traders following the framework. It was a volatile but readable day with substantial setups, all identified through proper context, patience, and flexibility while leveraging the MSI, premarket levels, and market structure rather than forcing trades. The MSI continues to prove its reliability as the cornerstone of our trading process.
Trading Strategy Based on MSI:
Thursday has heavy economic data with Core PCE Price Index m/m and Final GDP q/q which can introduce significant volatility, so traders should be ready to trade what they see rather than predict. These are high-impact releases that can create sharp directional moves in either direction, and the MSI is the most reliable guide for sorting out whether any initial reaction has follow-through or is simply a knee-jerk move to fade. With the MSI closing in a wide Ranging state and no extended targets printing at the close, the framework is signaling a choppy, sideways to slightly lower tape as the base case, though the strong Micron earnings after the bell introduce the possibility that the semiconductor space provides a lift to SPY and QQQ early in the session. Traders should respect whichever direction the MSI resolves toward rather than front-running a bias in either direction.
Bulls want to see overnight strength hold above $733.3 MSI support and push price back through $737.47 resistance with enough conviction to trigger a rescale into a Bullish Trending state, which would signal that buyers are absorbing the recent selling pressure and willing to defend higher ground. A clean break and hold above $737.47 — particularly if fueled by Micron-driven momentum in the semi space — would be the clearest sign that Thursday can build on an early rally and begin recovering the levels lost during Wednesday's PM session selloff. Bears want to see $737.47 continue to cap any overnight or opening strength and press price back toward $733.3 MSI support, and if that level gives way on volume, deeper tests toward lower premarket levels become the next natural target as the MSI would likely rescale lower and reintroduce more meaningful downside momentum. Any rally toward $737.47 that stalls and reverses is a potential shorting opportunity targeting $733.3 MSI support and the levels below it, while any dip that holds and bounces near $733.3 could offer a quick long setup targeting $737.47 resistance above.
Given the wide Ranging state and the absence of extended targets at the close, failed breakouts and failed breakdowns within the range are the highest-probability setups Thursday. Fading moves at the extremes — shorting strength near $737.47 and buying weakness near $733.3 — fits the framework best until the MSI shows a clear directional resolve. If the economic data provides a catalyst and the MSI rescales into a trending state, traders should follow that signal immediately and trade with the structure rather than against it. If the Ranging state holds into the open and neither MSI level breaks with conviction, keep expectations measured, reduce size, and wait for the cleanest entries at the edges of the range where the risk-to-reward is most defined.
The long-term bull trend remains intact above $640 and failed breakouts and failed breakdowns continue to offer the highest-probability setups. Remain flexible, avoid trading during Ranging Market States unless a clear failed breakout or breakdown presents itself, and ensure all trades are fully aligned with MSI signals. Providing real-time insights into market control, momentum shifts, and actionable levels, the MSI when integrated with our Pre-Market and Post-Market Reports continues to sharpen execution precision and elevate trade quality. If you haven't yet integrated MSI and our model levels into your process, now is the time. Contact your representative to get started as these tools are designed to support consistency and enhance performance.
Dealer Positioning Analysis
Dealers are selling SPY $750 to $780 and higher strike Calls, while buying $734 to $749 Calls, indicating the Dealers' desire to participate in any rally on Thursday. The ceiling for Thursday appears to be undefined at this time. To the downside, Dealers are buying $733 to $650 and lower strike Puts in a 2:1 ratio to the Calls they're selling, displaying moderate concern that prices could move lower. Notably, Dealers have cut their hedges back materially for Thursday, implying they believe prices may rally. Dealers are buying ATM Calls indicating their desire to participate in any upside move should it develop. Below $736 is bearish and above $737 is bullish, with a wall of resistance at $740 and $744 acting as key levels to watch on Thursday. Dealer positioning is unchanged at bearish.
Looking Ahead to Next Friday:
Dealers are selling SPY $752 to $780 and higher strike Calls, while buying $734 to $751 Calls, indicating the Dealers' desire to participate in any rally that develops this week. The ceiling for next week appears to be $747. To the downside, Dealers are buying $733 to $625 and lower strike Puts in a 5:1 ratio to the Calls they're selling, displaying strong concern that prices could move lower. Dealers are buying ATM Calls in size to participate in any rally into the end of the week, though they are clearly positioned for more weakness. Notably, they have not added to their hedges on a weekly basis. Remain bullish above $740 but below $736 remain bearish, as the zone between will be choppy and full of traps. For the week Dealer positioning is unchanged at bearish. We advise reviewing Dealer positioning daily for directional clues. These positions evolve quickly and tracking them is essential for staying ahead of shifting market sentiment.
Recommendation for Traders
With SPY closing at $733.30 and VIX edging up to 19.70, the market remains in a cautious holding pattern. Watch $730.85 as key support — a break below that favors shorts toward the next level. Bulls need a clean push above $739.95 to regain control. Keep positions measured and avoid chasing.
Stick to disciplined stops and don't let small losses become big ones in this choppy tape. Review the premarket analysis posted before 9 AM ET for any changes in the model's outlook and Dealer Positioning.
Good luck and good trading!
