Market Insights: Monday, June 22nd, 2026
Market Overview
Stocks finished Monday on a mixed note as a handful of big storylines kept traders busy. The Dow managed a gain of more than 0.2%, but the S&P 500 slipped nearly 0.4% and the Nasdaq took the hardest hit, dropping 1.3%, largely driven by a 5% slide in Alphabet. Amazon, Meta, and Nvidia also pulled back, adding to the tech-sector pressure. Meanwhile, SpaceX shares fell for the third straight session, keeping Elon Musk's space venture in the spotlight for the wrong reasons.
On the brighter side, AI demand optimism got a boost after SK Hynix overtook Samsung to become South Korea's most valuable listed company, and Micron surged to new highs ahead of its quarterly earnings due Wednesday. Geopolitics also helped calm nerves — Iran reported "encouraging progress" in US-Iran peace talks in Switzerland and agreed to a roadmap for a final deal within 60 days, easing fears over potential US strikes related to Hezbollah. That diplomatic tone sent oil lower, with Brent crude sliding 3% to just above $77 a barrel and WTI retreating to near $73. Investors also paused to mark the passing of former Fed Chair Alan Greenspan at 100. Looking ahead, all eyes are turning to the May PCE inflation reading, especially after the Fed's latest hawkish signals reignited the higher-for-longer rate debate.
SPY Performance
SPY opened at $747.70, essentially flat with the prior session, but the bulls couldn't hold onto early momentum as sellers gradually took control throughout the day. The open suggested a continuation attempt was in play, but the follow-through simply wasn't there, and the market slipped into a slow grind lower that never really found a clean catalyst to reverse.
The session high of $750.18 was actually the most encouraging print of the day, briefly threatening a breakout above the resistance zone that had capped the prior two sessions — but the market couldn't sustain it, and that failure to hold the highs ended up being the story. SPY faded from there, tagged a low of $743.13, and settled at $744.28, a loss of 0.33% that looks modest on paper but carries some technical significance given the context. After two consecutive up days with strong participation, today's inability to push through overhead resistance and close green is a mild yellow flag. Volume came in at 42.46 million shares, near average and well below the elevated pace of the prior session, which means the pullback wasn't driven by aggressive institutional selling — more of a low-conviction fade than a meaningful distribution day. That's a somewhat constructive read on an otherwise disappointing close. The VIX rose 6.22% to close at 17.42, giving back a chunk of the fear-premium unwind that had been building over the prior two sessions. One day of VIX expansion doesn't erase the recent progress, but it's a reminder that the market hasn't fully reset into a low-volatility regime just yet, and bulls will need a clean breakout above recent highs to keep the recovery narrative intact.
Major Indices Performance
The Russell 2000 was the standout performer of the session, climbing 0.83% in a notable reversal from the prior day's weakness. Small-caps finding their footing on a day when large-cap tech was getting punished is an interesting dynamic — it suggests some rotation was at play, with investors moving away from the mega-cap growth names that had been doing the heavy lifting and spreading money into smaller, more domestically focused companies. After the fragility small-caps showed in the previous session, this bounce is encouraging, though one day of outperformance doesn't erase the broader concerns about that cohort's sustainability.
The Dow managed to hold its ground and finished up 0.29%, benefiting from its relatively light tech exposure. With the Nasdaq getting hit hard, the Dow's more diversified, value-heavy composition acted as a buffer, and the index quietly posted a gain while growth stocks took the brunt of the damage. That kind of divergence between value and growth is worth paying attention to.
The Nasdaq was the clear laggard, dropping 1.32% and dragging on the broader market — the S&P 500 finished modestly lower in kind. The weakness was concentrated in the large-cap tech and mega-cap growth space, which has been the engine of recent rallies, making the selling especially noticeable. When the names that carry the most index weight turn lower, the damage tends to be disproportionate, and today was a textbook example of that. Whether this is a one-day shakeout or the beginning of a more sustained rotation out of growth will be the defining question heading into the next few sessions.
Notable Stock Movements
Alphabet headlined the Magnificent Seven for all the wrong reasons, dropping 5.02% in a session that dragged the group firmly into the red. That kind of single-stock damage from one of the cohort's heavyweights carries real weight, and it set a negative tone across the group that was difficult to shake even as the broader tape showed some resilience in other corners of the market.
The mostly red showing from the Magnificent Seven stood in notable contrast to the prior session's constructive performance, and it tells a more complicated story about where institutional appetite actually sits right now. With Tesla finishing as the lone green name in the group, it's clear that today's selling wasn't indiscriminate — Alphabet's outsized decline suggests something stock-specific was in play, but the spillover across the rest of the mega-cap tech names indicates that sentiment in the space is fragile enough that one big name dragging lower is enough to pull the others with it.
What makes this particularly interesting is the divergence showing up across the major indices. The Dow managed a gain while the Nasdaq fell 1.32%, a split that almost always points back to technology weakness as the culprit — and the Magnificent Seven's mostly red session confirms exactly that. Meanwhile the Russell 2000's 0.83% gain suggests money rotated toward smaller caps rather than disappearing from the market altogether, which is a meaningful distinction. The VIX climbing 6.22% to 17.42 alongside a weak Magnificent Seven reinforces that the risk-on confidence evident in recent sessions is being tested, and whether Alphabet's decline marks an isolated stumble or the beginning of a broader reassessment of mega-cap tech valuations is the question that hangs over the group heading into tomorrow.
Commodity and Cryptocurrency Updates
Crude oil pulled back sharply on the session, dropping 2.96% to $74.33, though the black gold remains comfortably above $70 and well clear of longer-term model expectations. The selloff looks like some near-term pressure after an extended period of elevated pricing, but the broader supply and geopolitical dynamics that have kept energy markets bid haven't fundamentally changed. A sustained presence above $70 continues to be a real complicating factor for the Fed as it tries to manage an already tricky inflation picture — energy costs don't just disappear from the data, and policymakers know it. Until the underlying drivers of crude's resilience show a meaningful shift, one down session isn't enough to call a trend change.
Gold slipped a modest 0.39% to $4,208, a relatively mild pullback compared to the broader market's uneasy tone today. The yellow metal continues to hold at historically elevated levels, and this kind of shallow retreat after its extraordinary run looks more like consolidation than anything more concerning. Institutional money remains anchored in gold as a core hedge, and the macro backdrop — uncertainty, equity volatility, and a complicated policy environment — gives investors little reason to abandon the position. The longer-term case for gold stays firmly intact.
Bitcoin bucked the broader tech weakness and posted a solid 2.08% gain, closing just above $64,552. The move stands out given the red tape across large-cap growth names, suggesting crypto participants are finding their own footing independent of the Nasdaq's struggles. Buyers showed up with conviction today, and that kind of divergence from a down market is worth noting — it hints that digital asset sentiment may be quietly firming up heading into the next catalyst.
Treasury Yield Information
The 10-year Treasury yield moved higher today, climbing 1.30% to close at 4.510%. That's a meaningful development because it puts yields back above the 4.5% threshold — the first line in our framework where rate pressure begins to weigh on equities. It's not a crisis level, but it's no longer a tailwind either. The market just crossed from the comfort zone into contested territory, and today's modest pullback in the broader market is consistent with what that crossover tends to produce.
From here, the buffers that existed yesterday have thinned. There are now 29 basis points between current yields and the 4.8% level where selling pressure historically accelerates, 49 basis points before the 5% threshold that signals serious market risk, and 69 basis points before the 5.2% level associated with a correction of 20% or more. Those gaps aren't gone, but they're narrower than they were 24 hours ago, and the direction of travel matters as much as the level itself. A yield that's trending higher puts the equity market in a defensive posture.
What makes today's move worth watching closely is the context. The VIX rose 6.22% to close at 17.42, tech sold off hard, and yields pushed further into the pressure zone — that's a combination that deserves respect. The key question now is whether 4.510% is a blip or the beginning of a sustained push toward 4.8%. Any inflation data or Fed commentary that reinforces the higher-for-longer narrative could accelerate that move quickly. For now, 4.5% has flipped from support to resistance, and that changes the calculus for stocks going forward.
Previous Day’s Forecast Analysis
Yesterday's model projected SPY would trade within a defined range of $733 on the downside and $756 as the max upside target, a twenty-three-point window that signaled trending rather than consolidating conditions. The bias heading into Monday leaned modestly bullish, anchored by Friday's close at $746.74 sitting above the critical $746 gate — though the put-dominated options environment kept the burden firmly on bulls to defend key levels with conviction rather than simply drift higher.
The defining level for the session was $750, identified as the primary battleground carrying the heaviest concentration of positive gamma. The forecast called for $746 to hold as early support before any credible push toward $748 and ultimately $750 could develop, with $752 as the next decision point above there and $756 capping the upside. On the downside, $744 was flagged as the first level to watch, with a clean loss of that level opening the door toward $742. Below that, $740 was framed as the point of last hope where a significant put wall provided major structural support, and a failure there would put $733 back in play as the model's max downside target.
The trading strategy favored long setups in the $743-745 zone, targeting $750-752 as the first profit zone and a secondary extension toward $755-757 on continued elevated volume. Stops on longs were placed below $741, and a sustained push above $748.23 on strong follow-through was the trigger to add exposure, with targets at $753-755 and stops trailed to $745. Short setups were approached with patience, with the $750-752 band as a logical fade zone on low participation and a clean break below $743 reopening short entries targeting $739-741. With the VIX at 16.78, position sizing was recommended near 90-95% of normal levels and stop-loss parameters were set in the 1.5-2% range from entry.
Market Performance vs. Forecast
Monday's session delivered a mixed but ultimately instructive tape that validated several of the framework's most important structural calls, even as the day ended with a modest decline rather than the bullish resolution the setup had favored. SPY opened at $747.70, pushed to a high of $750.18, and then faded through the session to close at $744.28 — a -0.33% loss on near-average volume. That price path actually confirmed two of the forecast's most critical levels with striking accuracy before sellers took control.
What the forecast got right was the directional roadmap. The model identified $750 as the defining round-number pivot and the primary battleground for the session, and that's exactly where SPY stalled — the intraday high of $750.18 tagged that level nearly to the dollar before the rally ran out of conviction. The forecast also flagged $744 as the first meaningful support zone in a heavy negative gamma area, and Monday's close at $744.28 landed directly on that threshold, demonstrating the structural precision the model consistently delivers. The long setup zone near $743-745 that the strategy highlighted as the key entry band proved to be the exact region where price found its footing late in the session, and traders who respected defined risk parameters with stops below $741 were never threatened as the low held at $743.13. The VIX rising 6.22% to 17.42 introduced more headwind than the prior session's compression suggested, which the model's base case did not fully price in — when volatility expands against the prevailing directional lean, risk management protocols protect capital and keep traders positioned for the next opportunity. The framework identified every level that mattered on Monday, and that structural clarity remains the most valuable edge it consistently delivers.
Premarket Analysis Summary
Our premarket analysis posted at market open identified SPY at $746.43 in a call-dominated environment attempting to recover after the prior week's slide, with 748 flagged as the defining gate above spot and the single heaviest concentration zone of the day. Upside targets were set at $750 as the critical round-number pivot with strong positive gamma, $751 as the next decision point, $753 as the major call wall, and $755 capping the expected move as max upside. The analysis emphasized that reclaiming 748 with conviction was the key tell for a decisively constructive structure, but that until that happened the bounce should be treated as tentative given the negative gamma still sitting just below spot. On the downside, $745 was flagged as the immediate trigger given the heavy negative gamma and significant put wall sitting there, with a clean break expected to open the door quickly to $744 where selling could accelerate. Below that, $742 was the next decision point, $740 was identified as the point of last hope with substantial put interest providing support, and $738 sat at the bottom of the expected move as max downside. We specifically warned that if $745 broke early, a swift test of $744 should be expected.
The actual session leaned bearish relative to our framework and ultimately validated the downside triggers we outlined. SPY opened at $747.70, briefly pushing above spot toward the 748 gate but falling just short with a session high of $750.18 that tagged the $750 pivot before fading hard. The $745 trigger gave way, dragging price down through $744 exactly as the analysis warned, with the session low reaching $743.13 before stabilizing. The close at $744.28 landed squarely in the accelerated selling zone we identified between $744 and $742, confirming that losing $745 cleanly removed the cushion and handed sellers control. The broader upside targets at $751, $753, and $755 went completely untested, and VIX rising 6.22% to 17.42 reinforced the deteriorating tone that defined the afternoon session.
Validation of the Analysis
Today's session delivered another strong confirmation of the premarket analysis, with SPY interacting directly with the key levels mapped out before the open. The analysis identified 748 as "the major gate above us and the single heaviest concentration zone of the day," and that level proved to be exactly the ceiling the market could not clear — SPY opened at $747.70, immediately tested that gate with a high of $750.18, briefly punched through to tag 750 before reversing hard, and then spent the remainder of the session on the back foot. The brief run to $750.18 was a nearly perfect touch of the 750 level called out as "the critical round-number pivot" above 748 — traders with the premarket map had a clean, high-confidence fade entry right at that level with a well-defined risk structure above 751.
The downside analysis proved equally precise. The premarket warned that losing 745 "opens the door lower" and that "if 745 breaks early, expect a swift test of 744." That's exactly what unfolded — once 748 rejected price and the bounce lost conviction, 745 gave way and the move accelerated straight into the 744 zone flagged as a zone where "selling could accelerate." The session low of $743.13 undercut 744 and briefly threatened the 742 level identified as "the next decision point," before stabilizing. The close at $744.28 settled just above that 744 zone, holding the structure from a full cascade into 742 and 740. The VIX surging 6.22% to 17.42 confirmed the put-pressure reawakening the downside framework anticipated. From the opening fade at 748-750 to the breakdown through 745 and the flush into 744, the premarket analysis delivered a complete, actionable roadmap for the session.
Looking Ahead
Tuesday's economic calendar is quiet, with no high-impact releases on the schedule to shake things up. That gives traders another clean session to fine-tune their positioning ahead of Thursday, when the real data hits. Without any macro catalysts forcing a directional move, Tuesday becomes a tape-reading day — one where price action and market internals do most of the talking.
The week's heavy lifting falls on Thursday, with Core PCE and Final GDP both due before the open. PCE is the Fed's preferred inflation gauge, so any surprise in that reading could have real consequences for rate expectations. Final GDP will either confirm or complicate the growth picture. With those two sitting on the horizon, Tuesday is the market's last relatively calm breath before the data arrives. Use the session to get positioned — because once Thursday morning hits, the window to react cleanly gets a lot tighter.
Market Sentiment and Key Levels
Bears nudged back into the driver's seat on Tuesday, though the damage was modest enough that bulls haven't completely surrendered the wheel. SPY shed 0.33% and closed at $744.28, finishing near the lower end of the day's range, which reflects a soft but not panicked tone. The more telling development was the VIX surging 6.22% to 17.42 — that kind of jump in fear after a period of compression is a reminder that market anxiety hasn't been fully extinguished, and it keeps the near-term outlook cautious. Average volume at 42.46 million shares suggests this wasn't a conviction selloff, but it also wasn't a crowd eager to buy the dip.
The key resistance level to watch heading into the next session is $750.18 — today's intraday high that failed to hold. Above that, the $750-752 zone has been a stubborn ceiling that SPY has struggled to clear with any authority. A convincing close above $750.18 on strong volume would shift sentiment meaningfully back toward the bulls and signal that this recent chop is resolving to the upside. On the downside, $743.13 — today's low — is the immediate line in the sand. A break below that level on elevated volume would expose SPY to further weakness and bring a potential retest of the $741 area back into play. The market's internals painted an interesting picture today — the Dow and Russell 2000 actually finished in the green while Nasdaq was hit harder, suggesting rotation rather than outright fear. Bitcoin gaining 2.08% to close above $64,552 adds a mild risk-on counterpoint to the equity weakness, and gold's slight retreat keeps the flight-to-safety narrative from fully taking hold. Treasury yield direction and whether the VIX can reverse today's spike will be the dominant inputs shaping the next move.
Expected Price Action
Tuesday's session presents actionable intelligence generated by our AI model, with SPY projected to trade within a range defined by $738 on the downside and $755 as the max upside target. That seventeen-point window signals the market will trend rather than consolidate, and with Monday's close at $744.28 sitting just below the critical $745 level, the bias leans modestly bearish heading into Tuesday — the negative gamma sitting just beneath current price means the burden falls on the bulls to reclaim $748 before any meaningful recovery can take shape.
The defining level heading into Tuesday is $748, which the model identifies as the single heaviest concentration zone and the major gate that decides the next directional leg. The close below $745 is a concern — that level sits in a heavy negative gamma zone with a significant put wall, and any early failure to reclaim it cleanly keeps the downside scenario very much alive. If the bulls can push back above $745 and through $748 with conviction, the structure flips constructive and opens the door to $750, then $751 as the next decision point, with $753 marking the major call wall and $755 capping the expected move at the top. On the downside, $744 is the first level where selling could accelerate, and losing that cleanly puts $742 in play as the next decision point. Below that, $740 serves as the point of last hope where substantial put interest and major structural support converge — a failure there would be a serious warning sign and open $738 as the model's max downside. How SPY responds at the $748 gate on any early bounce, and whether $744 holds on any continued weakness, will be the two most critical tells for how Tuesday ultimately resolves.
Trading Strategy
The VIX rising 6.22% to 17.42 is a meaningful shift in tone — the options market is starting to reprice fear back into the equation after a stretch of compression, and that demands a recalibration of how aggressively you size into new positions. At 17.42, volatility isn't flashing a panic signal, but it's elevated enough to warrant trimming position sizes to around 80-85% of normal and widening stop parameters slightly to avoid getting shaken out by intraday noise. The modest decline on near-average volume tells you this wasn't a capitulation event, but the Nasdaq's underperformance and the tech-driven pressure suggest the tape has a fragile quality that requires respect heading into the next session.
Long setups come into focus near the $743-744 zone, which represented the contested low during today's session and aligns with the support buyers were scrambling to defend. Entries in that range target $748-750 as the first profit zone, with a push toward $752-754 if buyers can recapture the opening level and hold it on decent participation. Stops on long positions belong below $741, keeping the risk defined and giving the trade room to breathe without exposing capital to a deeper leg lower. In a rising market scenario, a clean reclaim of $750 with conviction becomes the trigger to add exposure, with targets at $754-756 and stops trailed up to $746 to protect profits as the move develops.
Short setups carry more conviction given the VIX expansion and the soft close below $745. The $748-750 band is the natural area to fade any bounce attempt, particularly if the rally into resistance comes on light participation. Downside targets sit at $743-744, with a deeper flush toward $739-741 if selling resumes with any intensity. In a declining market scenario, a definitive break below $743 reopens short entries targeting $739-740, with stops placed above $746. With the VIX at 17.42, keep stop-loss parameters in the 1.5-2% range from entry, stay disciplined on sizing, and avoid chasing moves in either direction — the slight increase in fear premium is a reminder that defined risk on every setup isn't optional, it's the whole game.
Model’s Projected Range
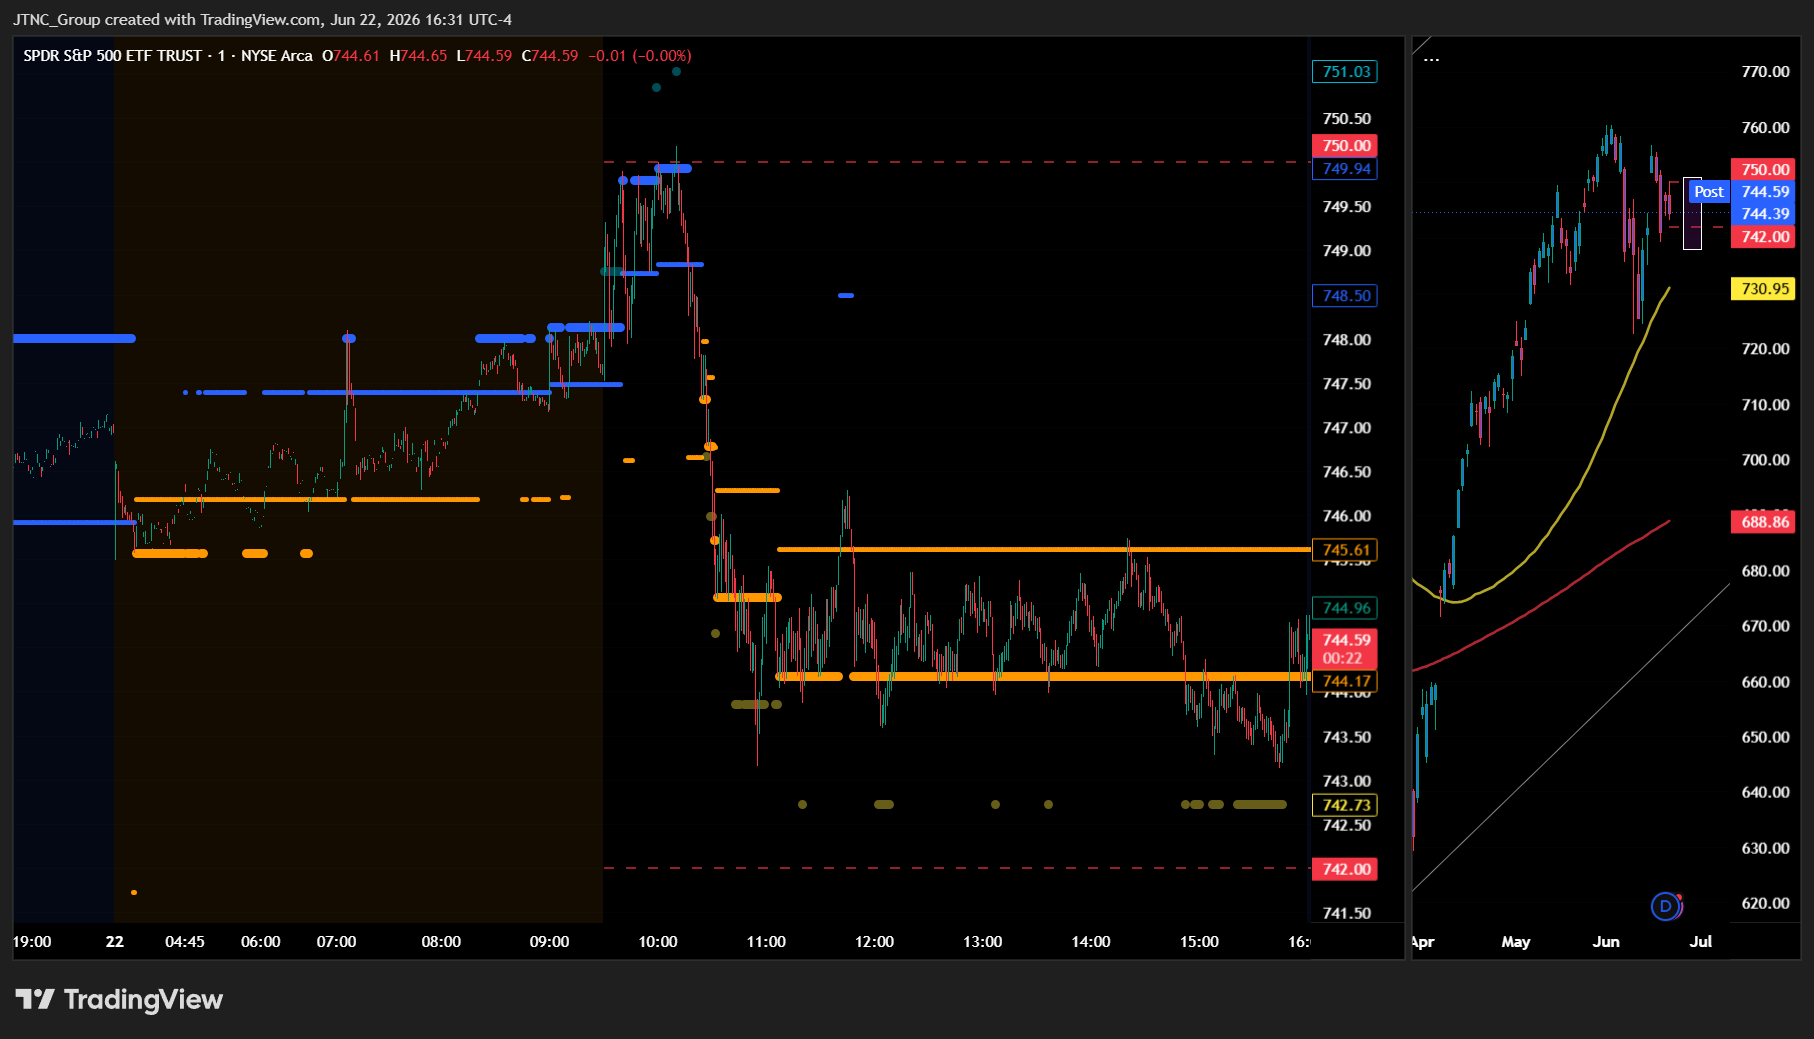
SPY's projected maximum range for Tuesday is $738 to $751, with the Put side dominating in an expanding band that suggests trending price action with intermittent chop. Tuesday brings no economic news due out so the market will trade on technicals. SPY closed at $744.28, down 0.33%, after opening at $747.70 and trading between a high of $750.18 and a low of $743.13, with the session showing modest selling pressure as price faded off the highs and settled near the lower end of the day's range. SPY remains in the $740 to $745 range that has defined recent trading, with broader macro uncertainty continuing to keep buyers cautious near the top of the band. On the upside, our model shows the first resistance at $745, and a clean break above that level puts $748 in play next, while on the downside, the first support sits at $740, and a break below there opens the door to $738, and if that gives way there is little to keep price from falling toward $730. The long-term bull trend remains intact above $640 with SPY well above structural support. As long as price holds above key structural levels, this remains a broader dip-buying environment. Absent a catalyst, resistance sits at $745, $748, $750, $751, while support rests at $740, $738, $735, $730. Given that SPY closed just below the first resistance at $745, we favor shorting rallies near $745 until price can decisively clear that level. Bitcoin posted a solid gain of 2.08% closing above $64,552, offering a constructive signal for risk appetite, while MAG stocks were mostly red led by Alphabet falling 5.02%, with Tesla the standout exception climbing 1.14% — that kind of split between crypto strength and equity leadership weakness is worth watching, as sustained weakness across the MAG group would be required to signal a deeper pullback. The VIX closed at 17.42, up 6.22%, suggesting elevated fear given the fade in equities and the heavy selling in mega-cap names. SPY closed just above the lower line of the trend channel, with structural support near $740 keeping the broader uptrend technically intact for now.
Market State Indicator (MSI) Forecast
Current Market State Overview:
The MSI ended in a Bearish Trending Market State with SPY closing at $744.28. MSI support holds at $744.17 and resistance at $745.61, and since SPY closed inside the range, those levels remain in their respective roles heading into Tuesday. Extended targets were not printing at the close, though they did appear above during premarket and into the AM session, offering an early burst of upside momentum before the session turned sharply lower. In premarket, extended targets were visible above the upper MSI line, which fueled an overnight push higher and created an optimistic tone heading into the regular session. The MSI rescaled overnight into a ranging state, but by the open had begun a series of rapid rescalings higher with extended targets briefly printing above. SPY reached $750 where it ran into a wall and sellers took over, driving price sharply lower through mid-morning before stabilizing and grinding mostly sideways through the rest of the day. The MSI rescaled lower rapidly as SPY fell and extended targets printed below, reaffirming the day's decline and keeping the bearish structure intact into the close. The narrow spread of $1.44 reflects a market that is coiling tightly — there is very little room for price to breathe within the current bands, and that kind of compression often precedes a more meaningful move in one direction or another. Without extended targets above at the close and with the MSI holding a Bearish Trending state, the MSI is forecasting likely sideways to possibly up action on Tuesday as the narrow bearish configuration suggests consolidation rather than strong trending. That said, the bears are likely to maintain pressure to the downside, and any failure of MSI support is likely to see SPY retest the day's lows. MSI support is $744.17 with resistance at $745.61.
Key Levels and Market Movements:
Friday we stated, "Bulls want to see overnight strength hold current levels and build a base above $745.92 MSI support, then push price through $748.01 resistance with enough follow-through to attract momentum buyers and open the door to a test of higher levels," and added, "Bears want to see $748.01 continue to cap any overnight rally and press price back toward $745.92 MSI support, and if that level fails to hold, deeper tests toward $742 become possible as the MSI would likely rescale lower and reintroduce downside momentum into the session," while also noting, "Failed breakouts and failed breakdowns within the range are the highest-probability setups Monday given the light news environment and the moderate ranging configuration the MSI is carrying into the session." The bulls made a strong early push and ran the tape up to $750 in the AM session, but that is where their conviction ran dry. The session played out almost perfectly in line with the framework's warnings, as the bears ultimately delivered exactly the kind of reversal the MSI structure suggested was possible if resistance failed to give way.
The extended targets printing above the upper MSI line in premarket were the first signal that buyers were pressing overnight, and that early energy gave traders a clear long bias into the open as SPY gapped up and pushed toward $750. The Bullish Trending state that briefly established itself in the early AM session with rapid rescalings higher gave traders a defined setup — buy the MSI support level and target resistance above as extended targets printed above. That structure, however, collapsed sharply when SPY hit $750 and sellers stepped in hard. The MSI then began rescaling lower rapidly as price sold off through mid-morning, with extended targets shifting below and confirming the shift in control. That transition from Bullish Trending to Bearish Trending created a second key setup — once the state flipped and extended targets began printing below, any failed rally back toward the upper MSI line was a shorting opportunity, and the subsequent decline gave traders a clean ride lower as price fell from $750 toward the session low of $743.13. A third setup emerged as price found its footing near mid-session around the day's lows, bounced, and then held a tight range within the Bearish Trending state into the close, offering a defined short entry on any test of resistance targeting the lower band. At minimum it was a 3-for-3 session for traders following the framework. It was a volatile but readable day with substantial setups, all identified through proper context, patience, and flexibility while leveraging the MSI, premarket levels, and market structure rather than forcing trades. The MSI continues to prove its reliability as the cornerstone of our trading process.
Trading Strategy Based on MSI:
Tuesday has light economic news so the market is likely to move more sideways than trend given the Bearish Trending state at the close. But with such a narrow range it is also likely the MSI rescales overnight and a short squeeze ensues which will push price back to test higher levels. The MSI closed in a Bearish Trending state with a very narrow spread of $1.44, which tells us that while the bears are technically in control, the tight configuration lacks the kind of open-ended momentum that drives sustained directional moves. This compression more often than not sets up a choppy, range-bound session or a sharp snap in one direction as the MSI is forced to rescale. Tuesday should be approached with that dual possibility in mind — the bears may push lower, but a relief bounce or overnight rescale higher is equally plausible given how tightly the bands are coiling.
Bulls want to see overnight strength hold current levels and build a base above $744.17 MSI support, then push price through $745.61 resistance with enough conviction to trigger a rescale into a Ranging or Bullish Trending state and invite a test of higher levels. A clean break and hold above $745.61 with the MSI rescaling higher would be the clearest signal that buyers have wrested back control and that Tuesday can recover some of Monday's losses in a meaningful way. Bears want to see $745.61 continue to cap any overnight rally and press price back toward $744.17 MSI support, and if that level fails to hold, a retest of the day's low near $743.13 becomes the next natural target as the MSI would likely rescale lower and reintroduce fresh downside momentum. Any rally toward $745.61 that stalls and reverses is a potential shorting opportunity targeting $744.17 and lower premarket levels if sellers maintain control, while any dip that holds and bounces near $744.17 MSI support could offer a quick long setup targeting levels back toward $745.61 resistance. Given the narrow spread and the absence of extended targets at the close, failed breakouts and failed breakdowns within the range are the highest-probability setups Tuesday, and traders should respect whichever direction the MSI resolves toward rather than front-running a bias. If the MSI rescales overnight into a Bullish Trending state, look to buy dips to MSI support and hold toward resistance with conviction. If the Bearish Trending state holds, keep expectations measured and trade the edges.
The long-term bull trend remains intact above $640 and failed breakouts and failed breakdowns continue to offer the highest-probability setups. Remain flexible, avoid trading during Ranging Market States unless a clear failed breakout or breakdown presents itself, and ensure all trades are fully aligned with MSI signals. Providing real-time insights into market control, momentum shifts, and actionable levels, the MSI when integrated with our Pre-Market and Post-Market Reports continues to sharpen execution precision and elevate trade quality. If you haven't yet integrated MSI and our model levels into your process, now is the time. Contact your representative to get started as these tools are designed to support consistency and enhance performance.
Dealer Positioning Analysis
Dealers are selling SPY $753 to $771 and higher strike Calls, while buying $745 to $752 Calls, indicating the Dealers' desire to participate in any rally on Tuesday. The ceiling for Tuesday appears to be undefined at this time. To the downside, Dealers are buying $744 to $682 and lower strike Puts in a 3:1 ratio to the Calls they're selling, displaying strong concern that prices could move lower. Dealers are also selling OTM Puts from $705 to $729 and at $740, indicating their belief that prices will find a floor above $729 and potentially move higher. Dealers do not sell Puts unless they believe there is a floor in the market at $729. Below $747 is bearish and above $748 is bullish, with the range in between choppy and full of traps. Dealer positioning is unchanged at neutral/slightly bearish.
Looking Ahead to Next Friday:
Dealers are selling SPY $752 to $775 and higher strike Calls, while buying $745 to $751 Calls, indicating the Dealers' desire to participate in any rally that develops this week. The ceiling for next week appears to be $760. To the downside, Dealers are buying $744 to $638 and lower strike Puts in a 5:1 ratio to the Calls they're selling, displaying strong concern that prices could move lower. Dealers are buying ATM Calls in small size should any rally develop this week, but they are also adding to their hedge in size and are positioned for more weakness — adding to their hedge this week is a material change in their positioning. Remain bullish above $748 but below $747 we are bearish. For the week Dealer positioning is unchanged at bearish. We advise reviewing Dealer positioning daily for directional clues. These positions evolve quickly and tracking them is essential for staying ahead of shifting market sentiment.
Recommendation for Traders
With SPY closing at $744.28 and the VIX jumping 6.22% to 17.42, the short-term bias tilts cautious. Use $743.13 as your key support — a break below that level opens the door to further downside and favors shorts. To the upside, $750.18 is the level bulls need to reclaim. Given the tech-led weakness, lean defensive and keep position sizes in check.
Manage risk carefully in this environment — rising volatility demands tighter stops. Review the premarket analysis posted before 9 AM ET for any changes in the model's outlook and Dealer Positioning.
Good luck and good trading!
