Market Insights: Friday, June 20th, 2025
Market Overview
Markets closed out a choppy, shortened trading week on a cautious note as investors balanced hopes for Fed rate cuts against escalating geopolitical risks. A Fed governor hinted Friday that interest rate cuts could begin as early as July, citing softer inflation data, even with Trump’s tariffs in play. While this sparked some early optimism, it didn’t last. Stocks faded into the close as traders remained laser-focused on President Trump’s looming decision about military action in the Middle East. According to the White House, Trump has imposed a two-week deadline on himself to decide whether the U.S. will intervene directly in the Israel-Iran conflict. The delay adds time for diplomacy, but Iran has rejected calls to return to negotiations. European leaders are now attempting to broker talks, holding meetings with Iranian officials in Geneva. In the background, chip stocks were hit hard by reports that the U.S. may revoke export waivers for key semiconductor manufacturers, sending Nvidia down 1.1%. Meanwhile, Fed Chair Powell stuck to his message of patience, which drew renewed criticism from Trump. While markets showed little overall movement, the undercurrent of uncertainty from both the Fed and geopolitics continues to weigh heavily on sentiment heading into next week.
SPY Performance
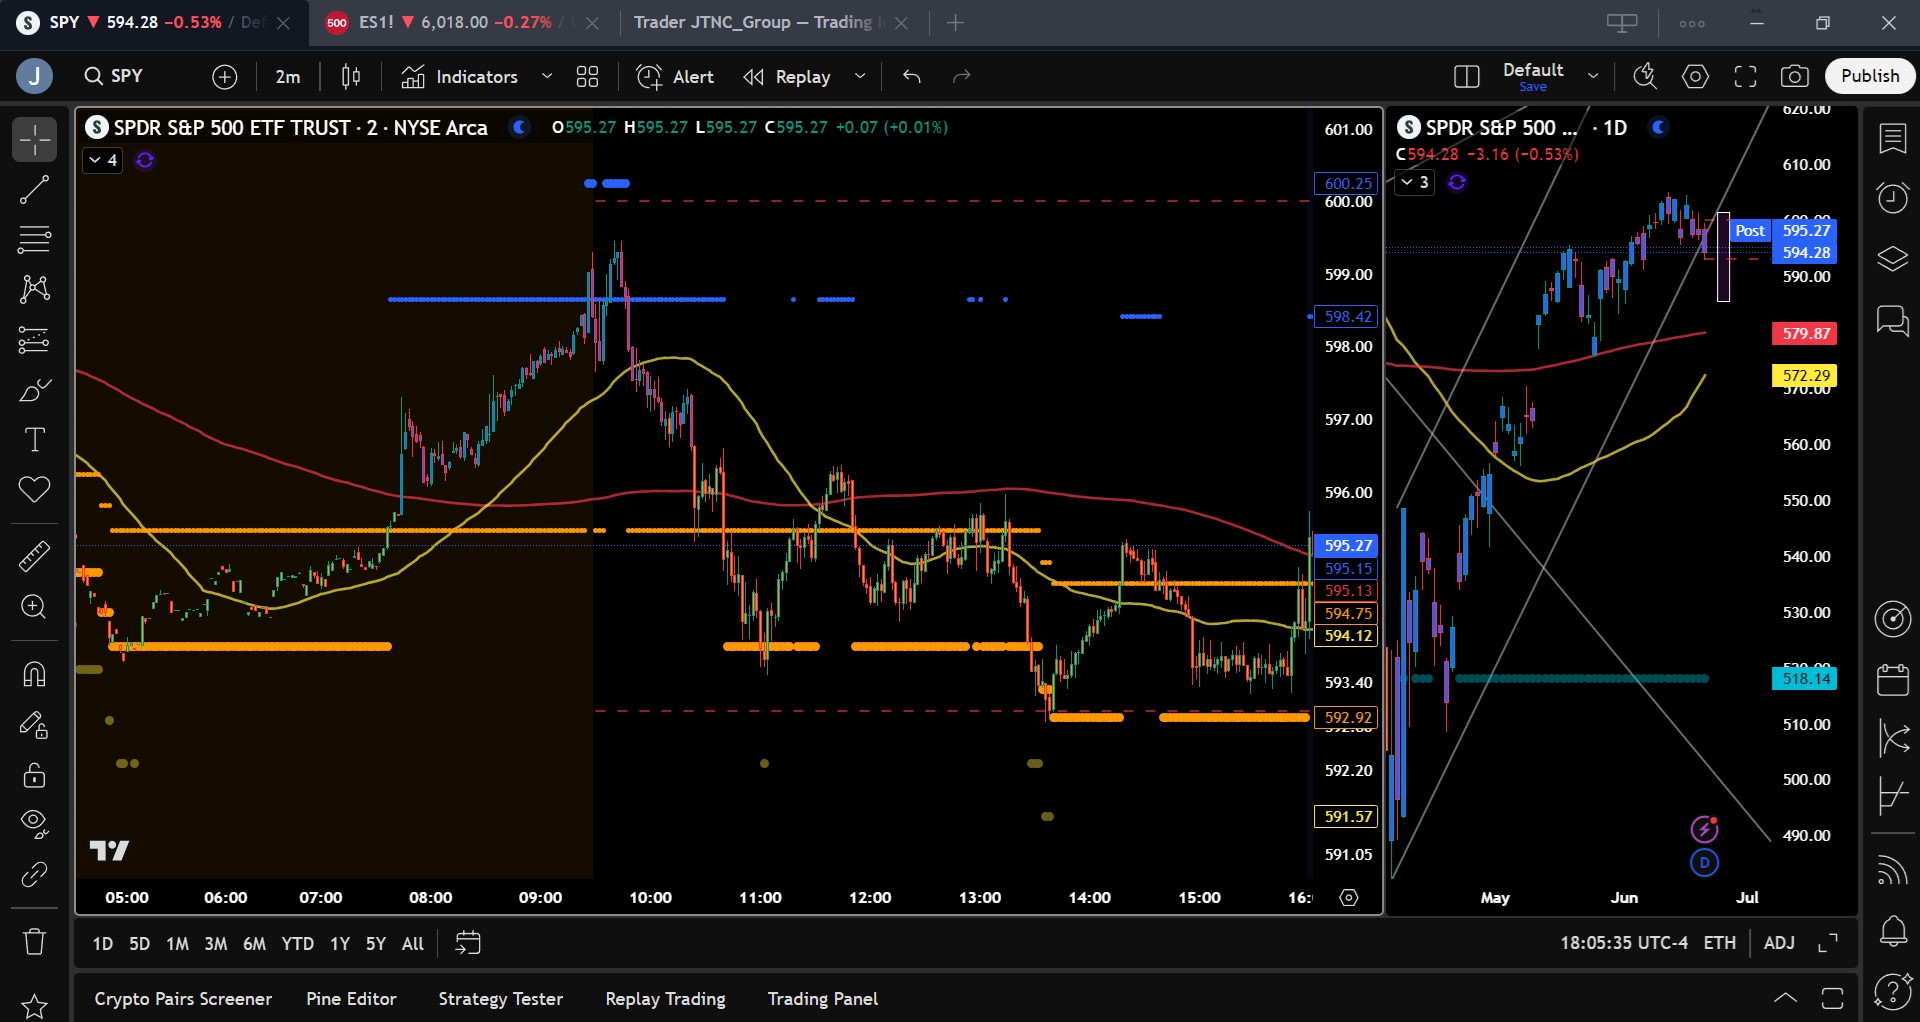
SPY fell 0.53% on Friday to close at $594.28, down from an open of $598.35. The ETF traded in a broad intraday range between $592.87 and $599.46, closing near the lower end of the day’s range on elevated volume of 85.09 million shares. Despite an early attempt to reclaim $600, sellers overwhelmed the tape mid-session, pushing SPY well below the critical $595 level into the close. The inability to hold key support, especially on a post-holiday Friday, reflects a market increasingly willing to sell into strength as traders take a more defensive posture.
Major Indices Performance
The Dow led the major averages on Friday, eking out a modest gain of 0.08%, while the Russell 2000 dipped 0.20%. The Nasdaq fell 0.51%, dragged lower by weakness in semiconductors, and the S&P 500 slipped 0.20%. After opening on a stronger note following dovish commentary from Fed Governor Waller, sentiment faded throughout the session as the geopolitical backdrop grew more uncertain. Defensive sectors showed some relative strength, while tech underperformed. With the Fed sending mixed signals and the market still digesting the potential for a direct U.S. conflict with Iran, overall momentum was lacking. Friday’s session marked the least volatile week of the year for the Nasdaq and the Dow, despite headline risks.
Notable Stock Movements
Among the Magnificent Seven, Apple, Tesla, and Netflix managed to close in the green, with Apple leading the group. The rest of the group finished in the red, extending a pattern of recent underperformance. Nvidia was the weakest link, sliding 1.1% after a Wall Street Journal report indicated the U.S. may revoke waivers for chipmakers exporting technology to China. This news weighed on the entire semiconductor space and contributed to the Nasdaq’s underperformance. The mixed showing from mega caps underscores ongoing indecision in the market as traders assess tech valuations amid macro risks.
Commodity and Cryptocurrency Updates
Crude oil climbed 0.68% to close at $73.99 as traders continued to price in the rising probability of U.S. military involvement in the Middle East. Elevated energy prices reflect both supply concerns and geopolitical uncertainty. Our model’s prior projection for crude to trend toward $60 remains invalid as long as tensions persist, and a spike above $100 remains possible. Gold dropped 0.72% to end at $3,383 as inflation expectations eased slightly. Bitcoin slipped 0.69% to close just above $103,500, continuing to consolidate below recent highs. We maintain our stance: Bitcoin remains a long-only trading vehicle between $83,000 and $77,000, with sharp downside risk below $77,000.
Treasury Yield Information
The 10-year Treasury yield edged down by 0.20% to close at 4.376%, offering a slight reprieve to equities early in the session. However, the failure of stocks to sustain gains despite easing yields suggests macro anxiety still looms large. Yields remain near the top of their recent range, and any push above 4.5% would likely pressure stocks again. The line in the sand remains 5%, above which a major correction of 20% or more is likely. For now, the modest drop in yields failed to spark sustained risk-on appetite.
Previous Day’s Forecast Analysis
Wednesday’s forecast for Friday’s SPY session projected a trading range between $593 and $603, maintaining a cautiously bullish tone above $590. The model identified $600 and $605 as key upside targets and warned that a break below $595 could trigger a move toward $590, with $586 and $585 as deeper supports. The preferred strategy was to favor long trades above $590 and short trades on failed breakouts above $600 or breaks below $590. The model also emphasized headline risks from both the Middle East and the Federal Reserve, advising a flexible and disciplined approach.
Market Performance vs. Forecast
Friday’s session played out largely in line with expectations, with SPY staying within the forecasted range of $593 to $603. The ETF opened at $598.35, hit an intraday high of $599.46, and rolled over to close at $594.28. The forecasted bias level of $600 again acted as resistance, and the model’s warning about failed rallies above $600 was validated as sellers stepped in aggressively. Support at $595 failed late in the session, leading to a test of $593, just above the forecast’s warning level of $590. Traders who followed the suggested plan, longs from $590 or shorts on failed strength near $600, had ample opportunity to capitalize on the day’s two-sided action.
Premarket Analysis Summary
In Friday’s premarket analysis posted at 8:18 AM, SPY was trading at $596.64 with a bias level set at $598.75. The analysis stated that holding below this level would reflect market fragility and called for short setups targeting $596.35, followed by potential support zones at $594, $593, and a max downside near $590. On the flip side, the analysis noted that a break and hold above $598.75 could produce a rally toward $600 and possibly $604.25–$605. The tone leaned cautious, favoring shorts unless the market showed strength above the bias level.
Validation of the Analysis
The premarket forecast proved highly reliable. SPY struggled to hold above the $598.75 bias level and quickly reversed after testing near $599.50, never establishing a sustained break above. The early fade confirmed the fragility noted in the analysis, and the ETF slid into the $594–$593 zone by the afternoon, validating those lower target zones as critical support areas. Traders who shorted failed rallies near the bias level or targeted $596.35 and $594 had multiple successful entry and exit points. The premarket levels guided the session precisely, reinforcing the value of the daily roadmap for tactical positioning.
Looking Ahead
Next week starts off with key PMI data for both Manufacturing and Services on Monday, setting the stage for a potentially active session. More importantly, all eyes will turn to Fed Chair Powell’s two-day testimony beginning Tuesday, where traders will be eager for any shift in tone on monetary policy. Later in the week, GDP and unemployment claims arrive Thursday, and Friday brings the closely watched PCE inflation data, arguably the Fed’s most important economic indicator. These events have the potential to reset rate expectations and shift market momentum. Stay alert for volatility around these releases.
Market Sentiment and Key Levels
SPY closed at $594.28 on Friday, just below the key $595 support level, signaling a cautious tone as sentiment leans slightly bearish. The bulls must defend the $590 level to prevent a deeper pullback toward $585, which would threaten the integrity of the broader bullish trend. Resistance levels now stand at $595, $600, $602, and $605, while support lies at $591, $587, $585, and $582. With SPY closing beneath the lower boundary of its recently redrawn bull channel, a sustained drop below $587 would likely accelerate selling pressure. Ongoing uncertainty around Trump’s Iran decision and upcoming Fed testimony keeps the market on edge, with sharp moves in either direction still on the table.
Expected Price Action
Our AI model projects SPY’s expected trading range for Monday between $587 and $600, with the market entering a Put-dominated environment suggesting potential downside pressure. This wide range implies choppy price action with bursts of momentum in both directions. Actionable intelligence favors short trades on failed rallies near $598 or $600, and long trades if SPY rebounds sharply off $587 or breaks and holds above $600. If SPY loses $590, the next downside levels are $587, $585, and $582. Bulls must reclaim $595 to regain short-term control. The market remains headline-sensitive and highly reactive, making rapid reversals a real risk, especially as geopolitical headlines and central bank commentary dominate the week ahead.
Trading Strategy
With SPY closing at $594.28, the market enters Monday in a vulnerable spot just below resistance. Long trades can be considered from the $585 to $590 zone, targeting $595, $600, and possibly $602 if momentum builds. Short trades are favored on failed rallies at $595 and especially at $600, targeting $590, $587, and $585. The VIX rose modestly to 20.63, reflecting growing investor unease. While not yet in full-blown risk-off territory, this level supports a cautious approach. Position sizing should remain conservative, and traders must stay nimble around key levels. With Powell’s testimony and inflation data looming, volatility is likely to rise. Manage risk tightly and avoid overexposure until a clearer trend emerges.
Model’s Projected Range
The model projects SPY’s maximum expected range for Monday of $585.50 to $601.50, with the Put side dominating in a narrowing but wide band suggesting choppy price action with periods of trending price action. Today’s session highlighted mounting concerns over potential U.S. involvement in the Middle East conflict, which could put American troops at risk. At the same time, markets continue to grapple with a Federal Reserve that appears committed to keeping interest rates elevated in the near term due to persistent inflation concerns. Equities initially rallied after a Fed governor hinted at a possible rate cut in July. However, those gains were quickly erased as SPY approached the $600 level suggesting that market participants are now more inclined to sell into strength at key resistance zones, a relatively new behavioral shift. SPY ultimately closed below $595, signaling a potential return to the previously observed $575–$595 trading range. We continue to believe that any direct U.S. military engagement in the region would exert significant downward pressure on the markets. As a result, geopolitical risks stemming from the Middle East remain a crucial, potentially market-moving factor. Given the uncertainty, we maintain a cautious outlook until more clarity emerges, even as the broader bullish narrative remains intact. Technically, the bulls retain control as long as SPY holds above $585, but geopolitical developments may override chart patterns. Heading into the weekend, traders should be prepared to react to headlines and trade what’s in front of them. The bulls are looking to defend the $590 level to stage another push higher. A failure there would be a warning sign, and a move below $585 could accelerate selling pressure. In the absence of a major external catalyst, our model suggests both dips and rallies are likely to be faded. Resistance is now seen at $595, $600, $602, and $605, while support lies at $591, $587, $585, and $582. Notably, SPY closed below the lower boundary of the recently redrawn bull channel from the April lows, with resistance above $602 growing stronger. A break below $587 could open the door to deeper downside. Since April, market direction has closely followed macroeconomic data, bond yields, inflation readings, tariff developments, and fiscal policy cues, a trend we expect to persist absent a significant policy shift. Meanwhile, the VIX dropped 6.95% to 20.63. Though still below the 23 level typically linked to risk-off sentiment, this reading reflects ongoing investor caution and the potential for rising volatility. In this environment, traders should remain nimble and alert to both economic data releases and evolving geopolitical developments in the days ahead.
Market State Indicator (MSI) Forecast
Current Market State Overview:
The MSI is currently in wide Ranging Market State, with SPY closing just above MSI support. Extended targets printed briefly during the session below price indicating the herd was pushing prices lower. The wide MSI range and another small sell off on volume implies more of the same for Monday. The MSI opened the day in a Bullish Trending Market State which quickly reverted to a wide ranging state and then to a bearish state. Only in the last few minutes did the MSI rescale back to this wide ranging state as it spent much of the day in a bearish state. Currently, MSI support stands at $595.13 with resistance at $598.42.
Key Levels and Market Movements:
On Wednesday, we noted: “On Friday, it’s likely we’ll see a low-volume, slow, and choppy session, typical of a post-holiday summer Friday.” We also stated, “A test and failure of $595 would serve as an early warning sign that downside pressure may be building,” and, “Tactical shorts may also be considered on failed breakouts.” With this plan in hand, we entered Friday with the MSI transitioning out of a wide-ranging state, rescaling to a bullish state at major resistance near $600. With no extended targets above and a textbook failed breakout, we initiated a short position just after 9:45 AM at $598.65, targeting the premarket level of $596.35. Our rule is to take the first available level as long as it’s at least $1 from our entry, and this target was achieved before 10:30 AM. We then set T2 at MSI support at $595.50, which also hit quickly, confirmation we were aligned with market direction. The MSI rescaled to a bearish state and briefly printed an extended target at $593.85. A less than perfect failed breakdown developed so we decided to hold our 10% runner, protected with a breakeven stop, rather than exit and reverse. SPY then rebounded to MSI resistance, reaching as high as $596.30 before turning lower again. When the MSI rescaled back to bearish, we reloaded our short to full size, confident the odds of SPY reaching MSI support were close to 70%. The trade took time to develop, with price hovering near our entry, but we stayed in with a stop above $597. Our first target was reached at $593.90 as MSI printed new extended targets, and we took T2 at MSI/premarket support at $593, trailing the remaining position with a breakeven stop. SPY again reversed and nearly stopped us out. Recognizing that quad witching was likely influencing price action the rest of the day, we waited for a retest of the premarket level at $594 and closed our runner, ending the session. A solid finish to the week, going two-for-two, guided by a structured plan, disciplined execution, and strategic use of MSI for directional control, timing, and actionable levels. Integrated with our broader framework and model levels, MSI remains an indispensable tool for consistent trading performance.
Trading Strategy Based on MSI:
Heading into next week, a wave of economic data has the potential to move markets, beginning Monday with the release of Services and Manufacturing PMI. These reports often act as early indicators of economic momentum and could impact sentiment. However, with the weekend in play, there’s also the potential for an external catalyst to influence Monday’s price action. Should the U.S. deepen its involvement in the Middle East, expect a knee-jerk selloff in equities and a sharp spike in crude oil. Should crude breaks above the $100 per barrel, inflation concerns are likely to resurface, putting renewed (albeit potentially temporary) pressure on the market. Barring such macro shocks, the broader bull trend remains intact as long as SPY holds above $585. However, a test and failure of $590 would serve as an early warning sign that downside pressure is building. As always, it's critical to trade the market in front of you. Models cannot anticipate geopolitical developments, so we continue to strongly recommend downside protection via protective puts or VIX calls. External catalysts such as tariffs, remain credible threats that could swiftly alter sentiment. A return to the $575–$595 range, which has defined much of the action since May, remains a realistic scenario. On the upside, if SPY holds above $590 on Monday, a move toward $600 is still in play. Conversely, a break below $590 could trigger a deeper pullback toward $585, an important inflection zone that may hand short-term control back to the bears. Unless a meaningful breakdown occurs, the path of least resistance continues to point higher, though conviction in that path is beginning to wane. A sustained move above $605 would likely open the door to new all-time highs. We continue to favor long setups above $590 and tactical shorts above $600. Shorts may also be considered on failed breakouts or failed holds below $590, particularly when MSI signals weakening conditions. As always, failed breakouts and failed breakdowns continue to present high-quality opportunities. Stay alert and flexible as these setups evolve. Avoid trading during Ranging Market States and always align your strategy with MSI. MSI provides real-time insight into market control, momentum shifts, and actionable levels. When integrated with our Pre-Market and Post-Market Reports, it sharpens execution and improves trade quality. If you haven’t yet incorporated MSI and model levels into your workflow, now is the time. Contact your representative to get started as these tools are designed to support consistency and elevate performance.
Dealer Positioning Analysis
Summary of Current Dealer Positioning:
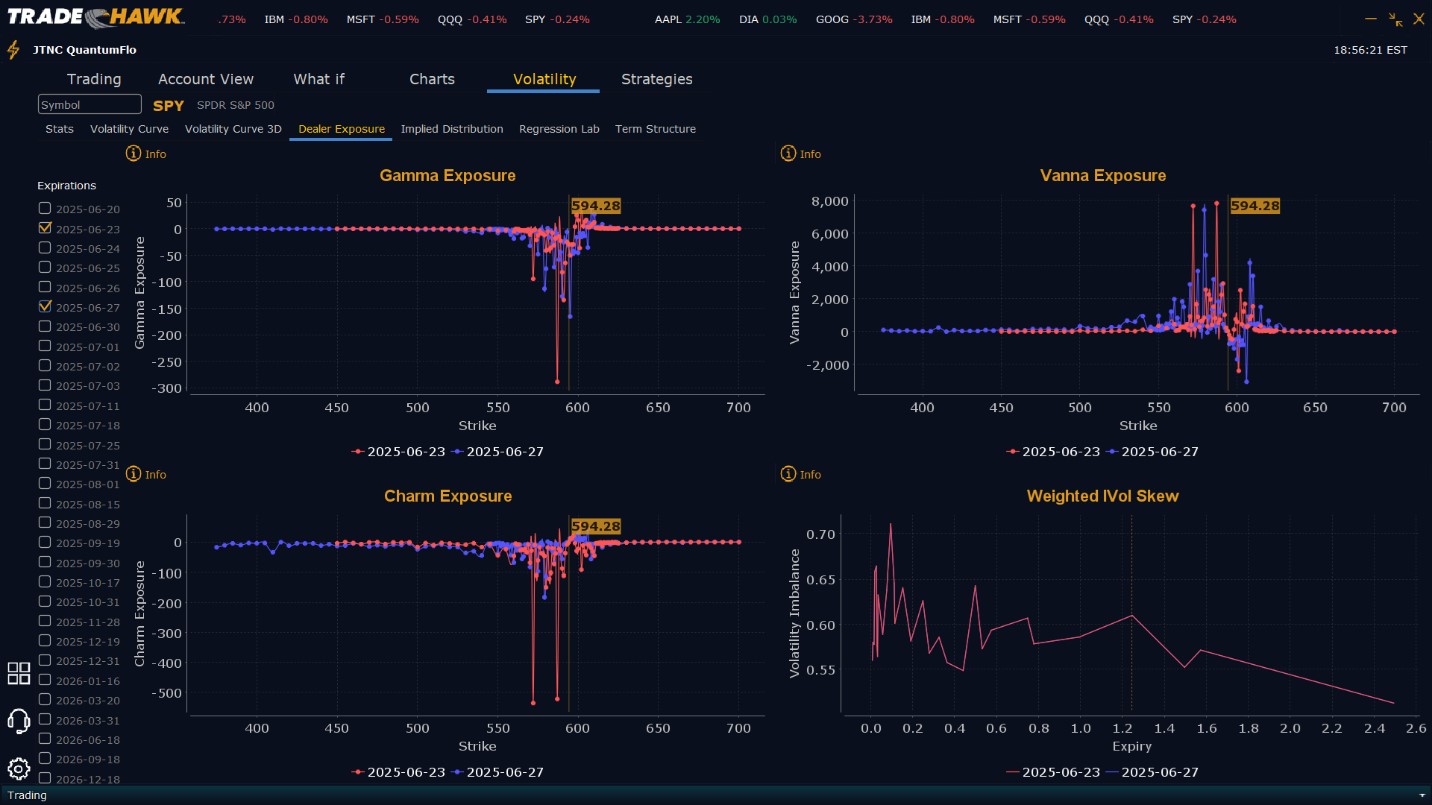
Dealers are selling SPY $599 to $610 and higher strike Calls while buying very small quantities of $595 to $598 and $601 Calls indicating the Dealers desire to participate in any rally on Monday. Dealers continue to employ Butterflies in their positioning which implies they do not expect any major price move on Monday. To the downside, Dealers are buying $594 to $550 and lower strike Puts in a 2:1 ratio to the Calls they’re selling/buying implying little concern that prices may move lower on Monday. Dealer positioning is unchanged from neutral to neutral.
Looking Ahead to Next Friday:
Dealers are selling SPY $605 to $615 and higher strike Calls while buying $595 to $604 Calls, indicating the Dealers belief that the market may rally next week and if it does, they want to participate. The likely ceiling for next week is currently $608. To the downside, Dealers are buying $594 to $505 and lower strike Puts in a 3:1 ratio to the Calls they’re selling/buying, reflecting a slightly bearish/neutral outlook for next week. Dealer positioning is unchanged from slightly bearish/neutral to slightly bearish/neutral. We advise reviewing Dealer positioning daily for directional clues. These positions evolve quickly and tracking them is essential for staying ahead of shifting market sentiment.
Recommendation for Traders
SPY’s failure to hold $595 and close beneath this key support should be taken as a warning sign that downside pressure is building. Traders may consider short setups on weak rallies near $598 or $600, targeting $595, $590, and $587 should momentum build. Long setups remain viable on a rebound from $590 or if SPY cleanly reclaims $600. The VIX at 20.63 reflects elevated sensitivity to news but not yet panic, suggesting a high probability of intraday volatility. Position sizes should be reduced accordingly, and stops should be tight near resistance zones. Review the premarket analysis posted before 9 AM ET for any overnight shifts in the model’s outlook or changes in Dealer Positioning.
Good luck and good trading!
