Market Insights: Thursday, June 18th, 2026
Market Overview
US stocks staged a strong recovery Thursday, bouncing back from the previous session's FOMC-driven selloff as technology and cyclical stocks led a broad-based rally. The S&P 500 rose 1.08% to close at 7,501, the Nasdaq surged 1.91% to 26,518, and the Russell 2000 led all major indexes with a 2.12% advance as declining Treasury yields helped small-cap stocks outperform. The rebound came despite lingering concerns from Wednesday's hawkish Fed tone, where the dot plot revealed nine of eighteen officials now see interest rates increasing in 2026 and Chair Warsh notably abstained from submitting his own rate forecast while emphasizing the goal of price stability.
The rally gained further momentum from the landmark US-Iran peace deal signed by President Trump, which formally ended the conflict and reopened the Strait of Hormuz to commercial shipping. The geopolitical breakthrough eased the energy supply fears that had weighed on markets for months, with oil prices continuing to decline on renewed stability in the region. Semiconductor stocks were standout performers as Marvell Technology jumped 7.3% on an analyst price target upgrade reflecting strong AI chip demand, while Pfizer dropped 2.7% after announcing the departure of CFO Dave Denton, raising leadership continuity concerns. The week closed out in positive territory with the S&P 500 up 0.9%, the Dow advancing 0.7%, and the Nasdaq jumping 2.4%, marking the eleventh winning week in the last twelve as investors looked past the Fed's hawkish posture and focused on resilient earnings and the peace dividend from the Iran deal.
SPY Performance
SPY opened at $747.76 and showed a relatively contained session from the start, with buyers making a modest attempt to reclaim ground after the prior day's sharp selloff but never managing to generate the kind of convincing follow-through that would signal a clean reversal. The gap higher off the open set a cautiously optimistic tone, but price action remained compressed throughout the day, suggesting the market was more in consolidation mode than outright recovery mode.
The session high of $748.23 came in just $0.47 above the open, which tells you this wasn't a day where bulls were in aggressive control — the range was tight and the upside was capped. The low of $743.86 held reasonably well considering the damage done in the prior session, and SPY ultimately closed at $746.62, a gain of 0.76% that counts as a win on the scoreboard even if it didn't feel particularly powerful. Volume came in at 67.87 million shares, still above average, which adds a layer of credibility to the bounce — you'd rather see participation on an up day than watch price drift higher on fumes. The VIX confirmed the improved tone, dropping 10.36% to close at 16.53, unwinding a big chunk of the fear premium that got priced in during the prior session's spike. That kind of single-day reversal in volatility suggests the panic buying of protection was short-lived, and while one green day doesn't erase a distribution signal, the market at minimum stabilized and bought itself some time to figure out its next move.
Major Indices Performance
The Nasdaq led the charge on Thursday, surging 1.91% as growth-oriented names snapped back with conviction after recent sessions of sustained pressure. The mega-cap technology space was clearly the engine behind the move, with investors returning to high-multiple names as the risk-off mood from prior days faded. The breadth of the rally across the tech sector made it apparent this wasn't just a short-covering bounce in a handful of names — it was a meaningful rotation back into the market's most influential corner.
The Russell 2000 wasn't far behind, climbing 1.75% in a session that showed some genuine risk appetite extending beyond just large-cap growth. Small-cap names have been fragile in recent weeks, so seeing the index participate this strongly in an up day is an encouraging sign, even if it's still too early to call it a sustained reversal in sentiment for the smaller-cap space. When small-caps show up alongside tech on a big green day, it tends to reflect broader confidence in the market rather than just a narrow, concentrated move.
The Dow lagged well behind the pack, eking out just a 0.14% gain in a session where the index's heavy weighting toward value and industrial names left it sidelined while growth stole the spotlight. The divergence between the Dow and the Nasdaq was stark — nearly 1.77 percentage points separated the two, underscoring just how concentrated Thursday's enthusiasm was in the growth and technology trade. The S&P 500 also finished solidly higher, confirming this was a broad recovery day even if the blue-chip index couldn't fully participate.
Notable Stock Movements
NVIDIA's 2.95% gain headlined a broadly green session for the Magnificent Seven, with the chip giant leading the group higher and reinforcing the technology-driven optimism that pushed the Nasdaq up 1.91% on the day. The broader cohort largely followed NVIDIA's lead, with most names finishing in positive territory and reflecting a meaningful shift in institutional appetite toward the high-multiple growth names that had been under persistent pressure in recent sessions.
The contrast with the prior day's uniformly bearish action across the group is striking. Yesterday saw the Magnificent Seven decline in near lockstep, removing any sense of underlying support and raising questions about whether institutional players were broadly reducing exposure to the sector. Today's session told the opposite story — buyers returned with conviction, using the recent weakness as an entry point and restoring some of the sponsorship that has historically driven recoveries in these names. When the market's most widely held technology stocks reclaim ground together like this, it signals that the risk-off tone that dominated recent trading is at least temporarily unwinding.
The mostly green performance across the Magnificent Seven fits neatly within the broader risk-on posture of the session, where growth and small-caps alike participated in the rally. The group's collective strength suggests today's buying wasn't narrow or defensive — it was broad-based and pointed squarely at the names that carry the most weight in the technology complex. Institutional players appear to have stepped back in, providing the kind of demand that gives these recoveries staying power beyond a single session.
Commodity and Cryptocurrency Updates
Crude oil slipped 1.54% to $75.61, pulling back modestly while continuing to hold well above the $70 threshold that has defined the energy market's elevated stance in recent months. The black gold has rallied well above longer-term model expectations, and while today's decline reflects some softness in near-term demand sentiment, a sustained presence above $70 continues to carry real implications for Federal Reserve policy if energy prices keep contributing to broader inflationary pressures. The underlying supply dynamics and geopolitical factors that have kept crude elevated haven't meaningfully shifted, leaving energy costs as a persistent complicating factor for policymakers trying to navigate the path toward lower rates.
Gold dropped 2.86% to $4,234, giving back a more significant chunk of its recent gains as the precious metal faced notable selling pressure despite a generally improving tone across risk assets. The yellow metal's retreat was sharper than the broader market's moves might suggest, pointing to profit-taking by institutional players who had been riding gold's impressive run higher. Even with today's decline, gold remains well-supported at historically elevated levels, and the precious metal continues to serve as a core portfolio hedge for investors navigating the uncertain macro backdrop.
Bitcoin declined 2.05%, closing just above $63,100 as the leading cryptocurrency lagged the broader market's recovery and continued to track risk sentiment with its own degree of hesitation. Digital asset traders remained cautious, with buyers reluctant to step in aggressively even as equities found firmer footing throughout the session. Bitcoin's sensitivity to broader market dynamics kept traders in a wait-and-see posture, looking for clearer directional signals before committing to a more decisive move in either direction.
Treasury Yield Information
The 10-year Treasury yield pulled back again today, falling another 0.80% to close at 4.450% and maintaining its position just below the critical 4.5% threshold where rate pressure on equities begins to build. Unlike yesterday's session, where yields cooperated but stocks sold off anyway, today the friendly rate environment got the response it deserved — broad-based green across the major indices and a meaningful drop in fear as measured by the VIX falling 10.36% to 16.53. That alignment between declining yields and rising stocks is exactly the constructive setup bulls want to see, and it suggests the rate picture is once again doing its part to support valuations.
At 4.450%, the 10-year sits 35 basis points below the 4.8% level where selling pressure historically accelerates, 55 basis points below the 5% threshold that signals serious trouble for the broader market, and 75 basis points below the 5.2% level associated with a correction of 20% or more. All three buffers remain comfortably intact, and with yields drifting lower rather than higher, there's no immediate rate headwind threatening the rally. The key now is whether this level holds or continues to ease, because a 10-year that stays anchored in the low 4.4% range gives equities room to breathe and keeps the path of least resistance pointing higher.
What to watch going forward is any catalyst that could reverse this yield retreat. Hot inflation data, a stronger-than-expected jobs report, or any shift in Fed communication could quickly push the 10-year back above 4.5% and reintroduce the rate pressure that has tripped up this market before. For now the tape and the yield curve are singing from the same sheet, but that can change fast — keep 4.5% front and center as the first line of defense.
Previous Day’s Forecast Analysis
Yesterday's forecast carried a decidedly bearish bias heading into Thursday's session, with our AI model projecting SPY to trade within a seventeen-point range defined by $742 on the downside and $759 as the max upside target. With Wednesday's close at $741.04 sitting just below the floor of that projected range, the model flagged sellers as firmly in control and placed the burden of proof squarely on buyers from the opening bell.
The key line in the sand was $742, identified as the bottom of the expected move and the first critical reclaim level for bulls. From there, $743 was flagged as the last point of hope before downside pressure could accelerate, with $745 representing the next meaningful decision point carrying significant put interest. The $750 pivot was identified as the defining battleground — the gate to positive gamma territory and the level bulls needed to reclaim to fully flip the narrative. On the upside, a push through $750 and $751 would open the path toward $753, $757, and ultimately $759 as the ceiling. The first thirty minutes of trading around the $742 level was highlighted as the single most important tell for how the session would resolve.
On the strategy side, the newsletter recommended scaling back to roughly 75% of normal position size given the VIX surging 12.55% to 18.47, with wider stop buffers to account for elevated intraday swings. Long entries were suggested near the $739-741 zone with profit targets at $746-748 and an extended move toward $750-751 on a reclaim of the opening range, with stops below $737. Short setups carried the stronger near-term conviction, with tactical entries on failed rallies into the $746-748 resistance zone, downside targets at $735-737, and a deeper extension toward $730-732 if broad selling resumed. Stops on short trades were placed above $751. The strategy emphasized defined risk on every trade, resistance to chasing momentum, and stop-loss parameters widened to the 2-2.5% range from entry points until volatility showed signs of stabilizing.
Market Performance vs. Forecast
Thursday's session delivered a constructive reversal that validated several key elements of the forecast framework, even as SPY's opening gap above the projected range reflected the kind of overnight sentiment shift that quantitative models are not designed to capture in advance. The model had SPY projected between $742 on the downside and $759 on the upside, and while the open at $747.76 jumped immediately into the middle of that range rather than testing the lower boundary first, the levels the framework identified proved remarkably functional as price organized itself. External catalysts drove the overnight positioning that produced the gap, and the model does not account for unpredictable shifts in institutional sentiment or macro developments that unfold outside of regular trading hours and reset the opening print well above the prior close.
What the forecast got right was significant. The analysis correctly identified $742 as the critical line in the sand, and Thursday's session low of $743.86 respected that level with precision — buyers held firm above it without ever threatening a genuine breakdown, exactly the kind of structural support the framework anticipated. The $746-748 resistance zone, highlighted as a key decision area in both the long-side profit targets and the short-side entry zone, became the center of gravity for the entire session, with SPY closing at $746.62 and posting a high of $748.23 — essentially printing right through the middle of that range the model flagged as meaningful. The VIX declining 10.36% to 16.53 confirmed the volatility expansion was beginning to stabilize, which aligned with the forecast's emphasis on watching for signs of fear cooling before pressing directional bets with full conviction. Risk management protocols protected capital for any trader who respected the defined stop levels above $751 on short exposure, as Thursday's constructive tone would have neutralized aggressive downside positioning efficiently. The framework continues to prove its value in identifying the levels where price finds structure, and Thursday's session reinforces that the analytical engine's key reference points remain the most reliable guide for navigating whatever the market presents next.
Premarket Analysis Summary
Our premarket analysis posted at market open identified SPY at $744.51 in a put-dominated environment, having slid lower from the prior session's 750 pivot and sitting in weaker territory with a widened expected move of 12 points signaling traders were bracing for larger ranges. We established 746 as the defining gate above spot, with upside targets at $748 where resistance builds, $750 as the critical round-number pivot and heaviest battle zone, $752 as the next decision point, and $756 capping the expected move as max upside. The analysis emphasized that reclaiming 750 with conviction was the key tell for a tone shift, but that until that happened sellers held the edge in a put-dominated setup. On the downside, we flagged $744 as the immediate first level to defend given the heavy negative gamma sitting there, warning that losing it cleanly would open the door quickly to $743 where selling could accelerate. Below that, $742 was the next decision point, $740 was the point of last hope with a significant put wall providing support, and $733 sat at the bottom of the expected move as max downside. We specifically cautioned that put-dominated conditions with a wide expected move could cascade quickly and that losing $744 early would leave minimal cushion until $742.
The actual session validated the upside framework more than the downside one. SPY opened at $747.76, immediately clearing the 746 gate and pushing toward the $748 resistance target, tagging a session high of $748.23 that nearly touched that level exactly before backing off. Price held above our $744 danger zone throughout the session, never triggering the acceleration scenario we warned about, and closed at $746.62 — sitting comfortably between our 746 gate and 748 resistance level. The downside targets went untested with the session low of $743.86 just briefly brushing below $744 before recovering, confirming that level continued to act as meaningful support. VIX dropping 10.36% to 16.53 reinforced the constructive tone, and the 746 gate proved to be the defining line of the day exactly as the analysis framed it.
Validation of the Analysis
Today's session validated the premarket analysis in impressive fashion, with SPY navigating almost perfectly through the levels mapped out before the open. The analysis identified 744 as "a heavy negative gamma zone" and the critical line in the sand — and the market opened well above it at $747.76, essentially confirming the bullish scenario the analysis described as requiring a hold above that level. That open above 744 immediately put the upside targets in focus, and the first key gate, 746, was cleared on the open and held as support throughout the session, exactly as the framework suggested would "firm up" conditions for the bulls.
The high of $748.23 was a textbook interaction with the 748 resistance level the analysis called out as the zone where "resistance builds" above 746. Price tagged that level almost to the penny and stalled — traders who faded that resistance had a clean, well-defined entry with the map already in hand. The close at $746.62 settled right back into the 746-748 corridor the analysis described as the decision zone, confirming that level as a meaningful pivot. The 750 level, flagged as "the critical round-number pivot holding strong positive gamma and the heaviest battle zone," was never seriously threatened from above, which aligned with the analysis noting the burden remained on bulls to reclaim it with conviction. The VIX dropping 10.36% to 16.53 was consistent with the put-dominated pressure beginning to ease as price stabilized above the key downside levels. Every level referenced in the premarket analysis played a role in today's price action — this is exactly the kind of session that demonstrates the real-time value of having a precise framework before the first trade is placed.
Looking Ahead
Friday's economic calendar is clean, with no high-impact releases on the docket to shake things up. After Wednesday's FOMC-heavy session dominated the week, the market now has a full Friday to process everything and let price action speak for itself. That's not necessarily a bad thing — sometimes the most telling sessions are the ones where there's nothing to react to and traders have to decide on their own where conviction actually lies.
With no data forcing anyone's hand, Friday becomes a positioning session heading into the weekend. Traders will be watching whether the post-Fed momentum holds or starts to fade, and whether any follow-through buying or selling emerges as participants finalize their near-term views on rates and risk. A quiet calendar can cut both ways — it gives bulls room to extend a move if confidence is high, but it also gives bears an opening if the week's enthusiasm starts to look stretched with nothing fresh to support it.
Market Sentiment and Key Levels
Bulls retook the wheel Thursday as SPY gained 0.76% and closed at $746.62, recovering a meaningful chunk of Wednesday's losses in a session where buyers showed up with conviction and held their ground through most of the day. The VIX dropping 10.36% to 16.53 is a significant development — that kind of single-day collapse in fear typically signals that the panic from the prior session was overdone, and traders are now leaning back toward risk-on positioning rather than running for cover. What makes Thursday's session more credible is that the strength wasn't isolated to one corner of the market — the Nasdaq surging 1.91% and the Russell 2000 jumping 1.75% tells you this was a broad-based risk-on day, not a defensive rotation masquerading as a rally. Gold pulling back 2.86% to $4,234 and Bitcoin slipping 2.05% to close just above $63,100 actually reinforces the bull case here — money appears to be rotating out of safe-haven and speculative hedges and back into equities.
The session high of $748.23 is now the immediate resistance level to watch, and the fact that SPY couldn't quite hold above it into the close suggests there's still some overhead supply sitting right in that area. A clean breakout above $748.23 on strong volume would set up a run toward the $750-752 zone that acted as a ceiling heading into Wednesday's selloff, and reclaiming that zone with authority would meaningfully shift the near-term bias back to the bulls. On the downside, $743.86 — Thursday's intraday low — is the first line of defense. A break below that level on elevated volume reopens the door to a retest of the $741 area, and losing that would suggest Thursday's bounce was little more than a relief rally without follow-through. The bulls are in a better spot than they were 24 hours ago, but they haven't won anything yet. Treasury yield direction, crude oil's behavior relative to inflation expectations, and whether the VIX continues its retreat or reverses back higher will all play a meaningful role in determining whether this bounce has legs or fades into next session.
Expected Price Action
Friday's session presents actionable intelligence generated by our AI model, with SPY projected to trade within a range defined by $733 on the downside and $756 as the max upside target. That twenty-three-point window signals the market will trend rather than consolidate, and with Thursday's close at $746.62 sitting comfortably inside the expected move and above the critical $746 gate, the bias leans modestly bullish heading into Friday — though the put-dominated options environment means bulls still need to work to maintain control.
The defining level heading into Friday is $750, which the model identifies as the critical round-number pivot holding the heaviest concentration of positive gamma and the single most important battleground for price direction. Thursday's close above $746 is constructive, but that level needs to hold as support early in the session before any push toward $748 and ultimately $750 can gain traction. Reclaiming $750 with conviction would be the signal that sentiment has genuinely flipped — above there, $752 is the next decision point and $756 caps the upside as the top of the expected move. On the downside, $744 is the first level to watch, sitting in a heavy negative gamma zone where losing it cleanly reopens the door lower. Below $744, selling could accelerate toward $743 and then $742, with $740 serving as the point of last hope where a significant put wall provides major structural support. A failure at $740 would be a serious warning sign, putting $733 in play as the model's max downside target. How SPY responds around $750 on any early push higher, and whether $744 holds on any dip, will be the two most critical tells for how Friday ultimately resolves.
Trading Strategy
The VIX dropping 10.36% to 16.53 is a meaningful shift in market tone, signaling that fear is getting squeezed out of the system and conditions are becoming more favorable for controlled risk-taking. At 16.53, volatility is settling into a range that allows traders to tighten stop parameters and nudge position sizing back toward normal levels — call it roughly 90% of standard size, as the environment no longer demands the defensive buffers that elevated readings require. The broad advance on higher-than-average participation adds credibility to the move, and the constructive close at $746.62 — well off the session low of $743.86 — suggests buyers defended intraday weakness with conviction.
Long setups look attractive near the $743-745 zone, which captures today's intraday support and the lower end of the session range. Entries in that band target $750-752 as the first profit zone, with an extended run toward $755-757 if buying pressure accelerates on continued volume. Stops on long trades should sit below $741 to give the trade enough room to breathe without exposing the position to unnecessary drawdown. In a rising market scenario, a clean breakout above $748.23 — today's high — on strong follow-through becomes the trigger for adding to longs, with targets at $753-755 and stops pulled up to $745.
Short setups require more patience here given the improving tape, but resistance at $750-752 offers a reasonable level to fade if price stalls and participation dries up on the approach. Downside targets on short trades sit at $744-746, with a deeper extension toward $740-742 if the momentum reverses sharply. In a declining market scenario, a confirmed break below $743 reopens the door to short entries targeting $739-741, with stops above $746. The 16.53 VIX supports tightening stop-loss parameters to the 1.5-2% range from entry, and traders should prioritize defined risk on every setup rather than chasing extended moves in either direction.
Model’s Projected Range
SPY's projected maximum range for Friday is $739 to $755, with the Call side dominating in an expanding band that suggests trending price action with intermittent chop. Friday brings no economic news due out so the market will trade on technicals. SPY closed at $746.62, up 0.76%, after a session that saw an intraday high of $748.23 and a low of $743.86, with the open at $747.76 on lighter-than-average volume — a reasonably tight, constructive session that held together well into the close. SPY is trading near our model's first support at $745, with the broader macro backdrop still shaped by ongoing trade policy uncertainty keeping traders cautious on extended moves higher. On the upside, if $750 gives way, the next target becomes $754, while a break below $745 opens the door toward $740. Absent a catalyst, resistance sits at $750, $754, $755, $760, while support rests at $745, $740, $739, $735. The long-term bull trend remains intact above $640 with SPY well above structural support. As long as price holds above key structural levels, this remains a broader dip-buying environment. We favor buying dips at $745 given SPY's close just above that first model support with the Call side still in control. Bitcoin slipped 2.05% to close just above $63,100, showing some softness on the crypto side, while MAG stocks had a mostly green day led by NVIDIA which surged nearly 2.95% — the divergence between a cooling crypto bid and continued strength in mega-cap tech suggests equity leadership remains firm even if risk appetite is being a bit selective. The VIX closed at 16.53, down 10.36%, suggesting a significant reduction in fear as traders came into the weekend with more confidence in the near-term tape. SPY closed just above the lower line of the trend channel, with structural support near $745 keeping the broader uptrend intact heading into Friday's session.
Market State Indicator (MSI) Forecast
Current Market State Overview:
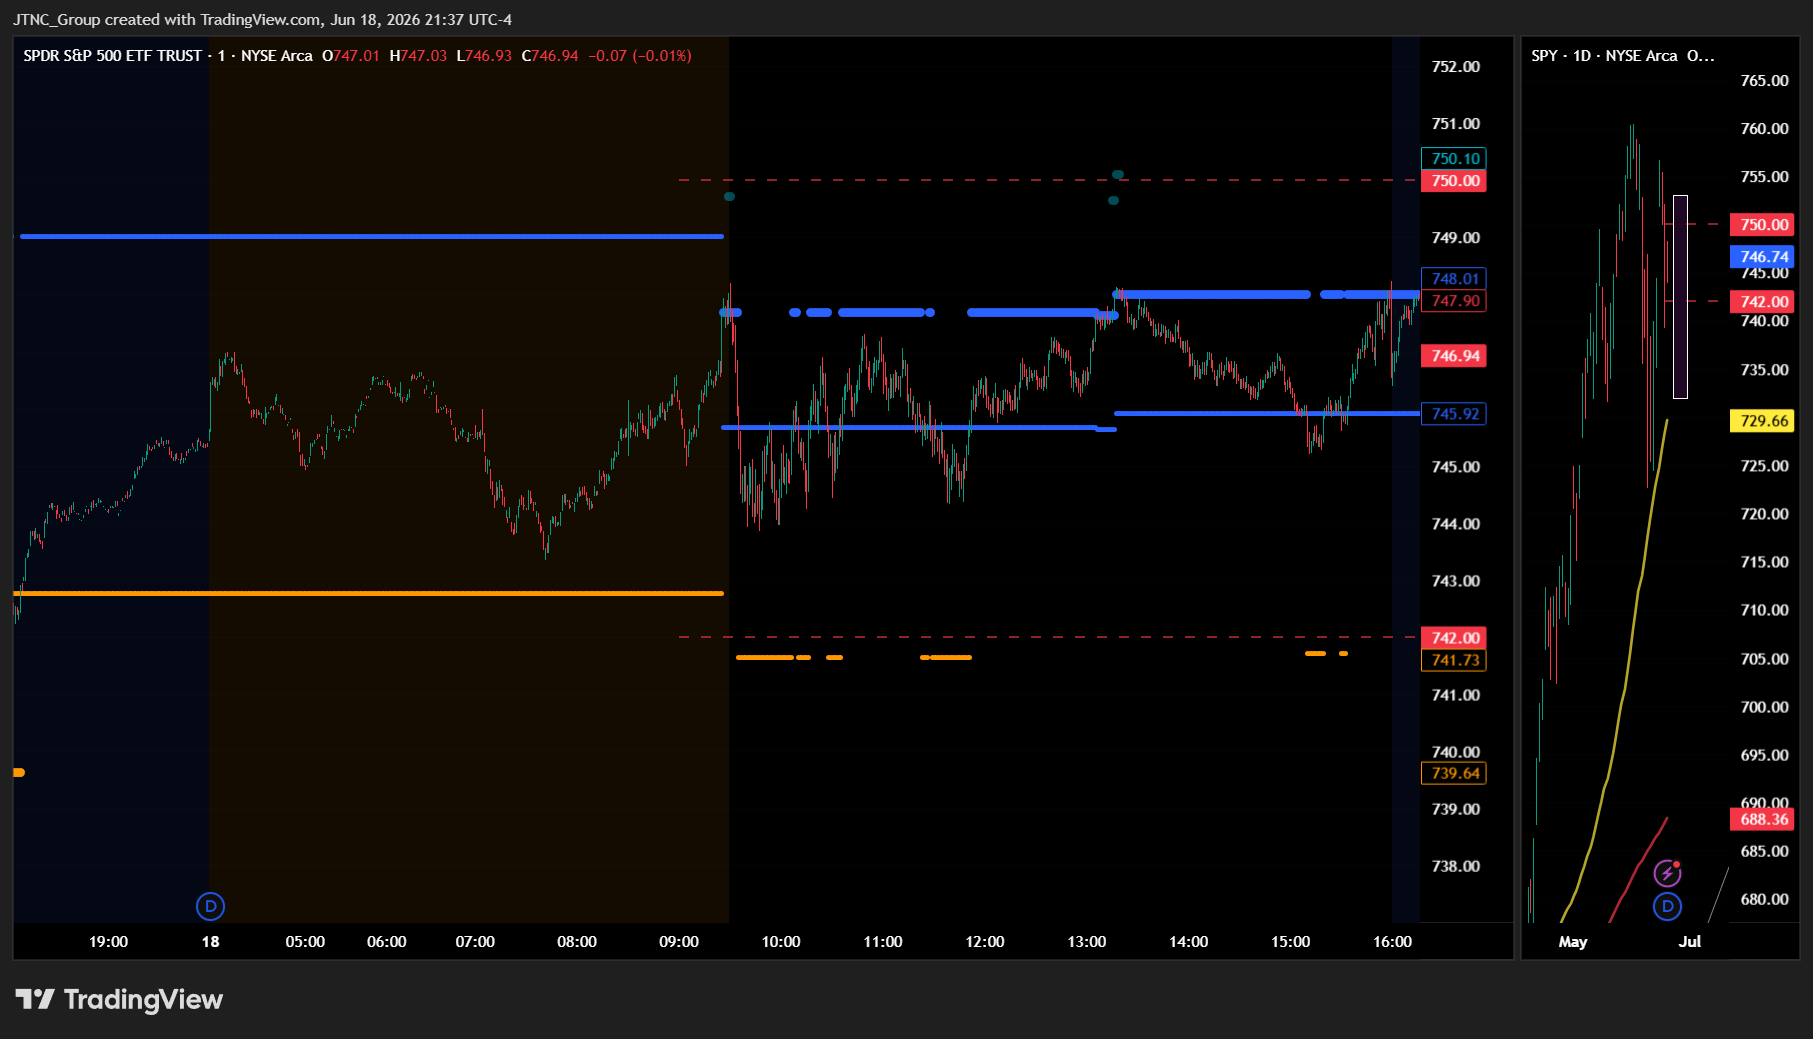
The MSI ended in a Ranging Market State with SPY closing at $746.62. MSI support holds at $745.92 and resistance at $748.01, and since SPY closed inside the range, those levels remain in their respective roles heading into Friday. Extended targets were not printing at the close, though they did appear above during premarket and into the AM session, offering some early bullish conviction before fading as the session progressed. In premarket, extended targets were visible above the upper MSI line near the $750 level, which helped fuel the early grind higher before the structure began to deteriorate. The MSI rescaled higher overnight, opening the day in a wide ranging state with price working steadily higher through premarket. At the open the MSI briefly rescaled into a Bullish Trending state, but that bullish structure reversed quickly, and extended targets began printing below, keeping price in a tight range between $745 and $748 throughout the bulk of the session. The MSI failed to hold the Bullish Trending state and settled into a narrow ranging configuration into the close with price unable to clear $748 resistance. The moderate spread of $2.09 reflects a market that is neither strongly trending nor tightly coiling — there is enough room for modest movement but not the kind of open-ended momentum that drives meaningful directional follow-through. Without extended targets above at the close, the MSI is forecasting sideways to slightly higher action on Friday as a continuation of today's session, though the move may be modest and is likely to find resistance at key levels above. SPY opened at $747.76, reached a high of $748.23, fell to a low of $743.86, and closed at $746.62, posting a gain of 0.76%. Volume came in at 67.87 million shares, above average, and the VIX dropped 10.36% to 16.53, reflecting a meaningful easing of fear as markets recovered from Wednesday's sharp selloff. MSI support is $745.92 with resistance at $748.01.
Key Levels and Market Movements:
Wednesday we stated, "Bulls want to see overnight strength hold current levels and push back toward former MSI support at $740.49, which has now flipped to resistance, and then above $743.1 to neutralize the bearish structure and open the door to a meaningful recovery," and added, "Bears want to see $740.49 continue to act as resistance and press price toward lower premarket levels below $739.25 where the session low sits, and deeper still if sellers can maintain control through the Thursday open," while also noting, "Traders should remain patient, avoid chasing extended moves, and let the MSI confirm direction before committing to a bias." The bulls made a decisive statement on Thursday. Rather than grinding lower as the bearish structure from Wednesday suggested was likely, SPY gapped above the prior session's key resistance levels and the MSI rescaled higher overnight, immediately shifting the character of the session. The extended targets visible above the upper MSI line in premarket near the $750 level were the first sign that buyers had taken control overnight and were pressing higher with conviction. As the regular session opened, the MSI briefly transitioned into a Bullish Trending state with both bands establishing themselves around the $748 and $745.92 area, signaling a clean long opportunity for traders buying the MSI support level and targeting resistance above. That bullish structure, however, proved short-lived. The MSI reversed quickly out of the Bullish Trending state, and extended targets began printing below, which flipped the primary setup from buying dips to fading rallies back toward $748 resistance and targeting the lower end of the range near $745.92. Price spent the bulk of the session grinding in a tight band between those two levels with the MSI holding in a narrow ranging configuration, and neither bulls nor bears were able to generate the momentum needed to break the range with any authority. The session high of $748.23 essentially marked the ceiling all day, and the low of $743.86 represented a brief venture outside the range before price recovered and settled back inside. The two clearest setups were the early long off the MSI support level when the Bullish Trending state was briefly established, and the subsequent fade of the rally back toward $748 resistance once the state reversed and extended targets shifted below. At minimum it was a 2-for-2 session for traders following the framework. It was an easy day to read albeit not an easy day to trade given the tight choppy range. But substantial setups were present, all identified through proper context, patience, and flexibility while leveraging the MSI, premarket levels, and market structure rather than forcing trades. The MSI continues to prove its reliability as the cornerstone of our trading process.
Trading Strategy Based on MSI:
Friday has light economic news so the market is likely to move more sideways to up than trend given the Ranging state at the close, though the absence of extended targets above means any upside attempt is likely to be measured rather than aggressive. The MSI closed in a Ranging Market State with a moderate spread of $2.09, which means there is room for price to move within the established bands but without a strong directional catalyst the most probable path is continued consolidation near current levels. The quad witching expiration flows from Thursday's session are now behind us, which removes one source of noise from the equation, and with no high-impact economic releases on the calendar Friday, the market is unlikely to receive a significant external catalyst to break the range decisively. The FOMC announcement next Wednesday will begin to attract attention and positioning, which could keep price action relatively contained early in the week as traders avoid overcommitting ahead of that event. Bulls want to see overnight strength hold current levels and build a base above $745.92 MSI support, then push price through $748.01 resistance with enough follow-through to invite a test of levels near $750 where premarket extended targets had been printing earlier in the day. A clean break and hold above $748.01 with the MSI rescaling into a Bullish Trending state would be the clearest signal that buyers are back in control and that Friday can extend Thursday's gains in a meaningful way. Bears want to see $748.01 continue to cap any overnight rally and press price back toward $745.92 MSI support, and if that level fails to hold, deeper tests toward $742 become possible as the MSI would likely rescale lower and reintroduce downside momentum. Any rally toward $748.01 that stalls and reverses is a potential shorting opportunity targeting $745.92 and lower levels if sellers maintain control, while any dip that holds and bounces near $745.92 MSI support could offer a quick long setup targeting levels back toward $748.01. Failed breakouts and failed breakdowns within the range are the highest-probability setups Friday given the light news environment and the moderate ranging configuration the MSI is carrying into the session. If the market surprises to the upside overnight and the MSI rescales into a Bullish Trending state, traders should look to buy dips to MSI support and hold toward resistance with conviction. If the range holds, keep expectations modest and trade the edges. The long-term bull trend remains intact above $640 and failed breakouts and failed breakdowns continue to offer the highest-probability setups. Remain flexible, avoid trading during Ranging Market States unless a clear failed breakout or breakdown presents itself, and ensure all trades are fully aligned with MSI signals. Providing real-time insights into market control, momentum shifts, and actionable levels, the MSI when integrated with our Pre-Market and Post-Market Reports continues to sharpen execution precision and elevate trade quality. If you haven't yet integrated MSI and our model levels into your process, now is the time. Contact your representative to get started as these tools are designed to support consistency and enhance performance.
Dealer Positioning Analysis
Dealers are selling SPY $748 to $762 and higher strike Calls, indicating the Dealers' belief that upside will remain limited heading into Friday. The ceiling for Friday appears to be $750. To the downside, Dealers are buying $744 to $682 and lower strike Puts in a 3:1 ratio to the Calls they're selling, displaying strong concern that prices could move lower. Dealers are also selling ATM Puts in small size from $745 to $747, indicating their belief that prices will continue to rise on Friday, though they remain hedged, implying limited upside conviction. Dealers do not sell ATM Puts unless they believe there is a floor in the market at $745. Below $744 is bearish and above $746 is bullish, while should SPY fail to hold $745, the zone from $739 to $744 will be choppy and full of traps. Dealer positioning is unchanged at neutral/slightly bearish.
Looking Ahead to Next Friday:
Dealers are selling SPY $748 to $768 and higher strike Calls, indicating the Dealers' belief that resistance will remain a factor into the end of next week. The ceiling for next week appears to be $754. To the downside, Dealers are buying $742 to $638 and lower strike Puts in a 4:1 ratio to the Calls they're selling, displaying strong concern that prices could move lower. Dealers are also selling ATM Puts broadly across a very wide range of strikes from $743 to $747 into June 26, indicating strong conviction that prices will continue to rise. Dealers do not sell ATM Puts unless they believe there is a floor in the market at $743. There is major resistance at $748 to $754 and Dealers are positioned for a continuation of the rally anticipating further upside into late June. Remain bullish above $743 but below $741 and especially $737 we are bearish. For the week Dealer positioning is unchanged at bearish. We advise reviewing Dealer positioning daily for directional clues. These positions evolve quickly and tracking them is essential for staying ahead of shifting market sentiment.
Recommendation for Traders
With SPY closing at $746.62 on a constructive session, the bias leans bullish. Watch $743.86 as immediate support — a hold above that level keeps the bulls in control. Resistance sits near the $748.23 high, and a clean break above that zone opens the door for further upside. Shorts should stay cautious here given the broad strength across tech and small caps.
Keep position sizes reasonable and stops defined, especially with gold and Bitcoin pulling back, which could signal some risk-off rotation ahead. Review the premarket analysis posted before 9 AM ET for any changes in the model's outlook and Dealer Positioning.
Good luck and good trading!
