Market Insights: Tuesday, June 17th, 2025
Market Overview
Stocks lost ground on Tuesday as hopes for a rapid diplomatic breakthrough in the Israel-Iran conflict faded, sending markets lower following aggressive rhetoric from President Trump. In a post on Truth Social, Trump demanded “unconditional surrender” from Iran and claimed the U.S. knew the whereabouts of Iran’s top leader, sparking concerns about the potential for direct U.S. involvement. The President’s remarks rattled markets, and the selloff intensified after reports surfaced that Trump had met with his national security team to weigh military options. The Dow dropped around 300 points, or 0.70%, the S&P 500 shed more than 0.8%, and the Nasdaq slid over 0.9%, as risk aversion returned. The Energy sector was the lone standout, rising 1% on surging oil prices, which jumped more than 4% amid fears of broader conflict. Brent settled above $76.50 while WTI crude closed just below $75. Adding to market jitters, May’s Retail Sales dropped 0.9%, worse than expected, suggesting consumers may be pulling back ahead of anticipated tariffs. Meanwhile, Wall Street is now eyeing Wednesday’s FOMC meeting for clarity on the Fed’s policy stance, particularly around the potential for two rate cuts in 2025. With Trump pushing forward on trade and war talk simultaneously, investor sentiment remains tense and headline-driven.
SPY Performance
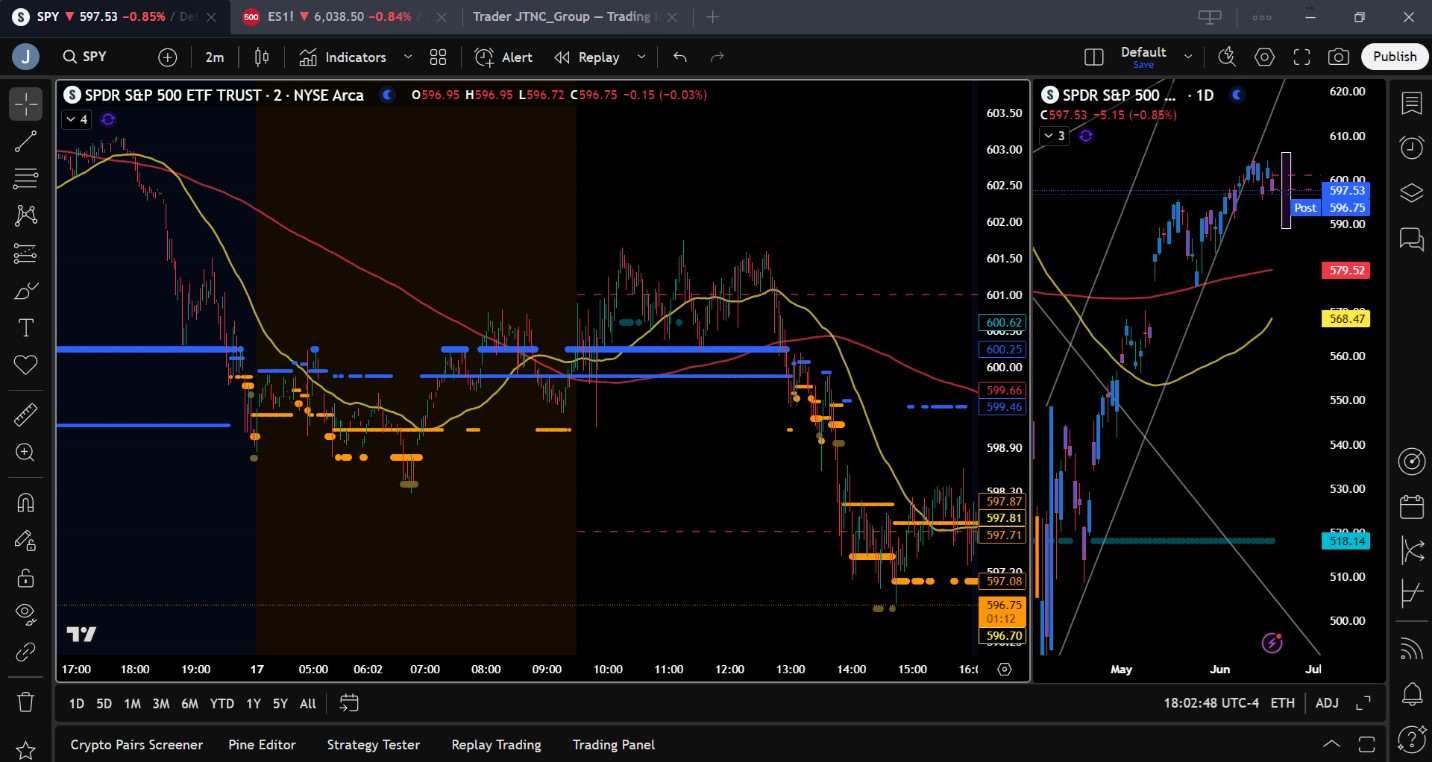
SPY slipped 0.85% to close at $597.53 after opening at $600.21 and reaching an intraday high of $601.75 before pulling back to a low of $596.76. Volume was strong at 71.92 million shares, well above average, suggesting that the move lower was backed by conviction. The drop below $600 is notable, as that level had served as critical psychological and technical support in recent sessions. Despite testing higher early in the day, selling pressure grew as the session wore on, driven by mounting geopolitical concerns and weak retail sales data. The breakdown below $598 leaves the door open for further downside if macro risks continue to escalate.
Major Indices Performance
The Russell 2000 led Tuesday’s declines with a 1.04% drop, reflecting a sharp pullback in small caps amid geopolitical unease. The Nasdaq followed with a 0.91% loss as tech stocks retreated in unison. The S&P 500 fell 0.85%, and the Dow posted a 0.70% decline, losing around 300 points. The losses were triggered by a mix of heightened war rhetoric from President Trump and disappointing retail sales. Defensive sectors underperformed relative to Energy, which was the only major sector to finish in the green, up about 1% as oil prices spiked. Overall, the session reflected growing nervousness around potential U.S. involvement in the Middle East and a cautious stance ahead of the FOMC decision.
Notable Stock Movements
It was a broad risk-off day for the Magnificent Seven, with every member of the group closing in the red. Tesla led the downside with a nearly 4% plunge, under pressure from the broader pullback in high-growth names and renewed macro uncertainty. The remaining tech giants, including Apple, Microsoft, and Meta, all posted declines, confirming the shift away from riskier assets. The uniform weakness across these market leaders underscores how quickly sentiment can flip in the face of geopolitical escalation and economic disappointment.
Commodity and Cryptocurrency Updates
Crude oil soared 5.55% to settle at $75.43, driven by growing fears that the U.S. may become directly involved in the Middle East conflict. This marks a sharp reversal from recent weakness and invalidates the previous near-term forecast of a move toward $60 unless the conflict deescalates. Gold edged up 0.12% to $3,405, reflecting cautious demand for safe-haven assets. Bitcoin fell 2.01% to close just above $104,600, continuing to pull back from recent highs. We remain buyers of Bitcoin between $83,000 and $77,000 only and continue to warn against purchasing below $77,000 due to elevated downside risk.
Treasury Yield Information
The 10-year Treasury yield rose 0.93% to close at 4.500%, a crucial threshold that now sits at the high end of the recent range. Yields above this level have historically pressured equities, and any sustained move toward 4.8% would likely intensify risk-off sentiment. The rise reflects renewed inflation concerns following the oil spike and persistent geopolitical tensions. As yields continue climbing, equity markets may face stiffer headwinds, especially if upcoming Fed commentary tilts more hawkish than expected.
Previous Day’s Forecast Analysis
Monday’s forecast projected SPY would range between $597 and $605 with a bullish tilt above $595, targeting $600, $605, and a possible move to $610. The model warned that a loss of $595 could open the door to lower support zones near $590 or even $585. Long trades were favored on pullbacks to $595, while shorts were only advised on clean breaks below $595 or failed moves above $602. The outlook highlighted sensitivity to geopolitical news and upcoming economic data, with an emphasis on a cautiously bullish bias given SPY’s hold above $600 heading into Tuesday.
Market Performance vs. Forecast
SPY’s session landed at the lower end of the forecasted range, breaking below the key $600 level and closing at $597.53. The intraday high of $601.75 aligned with upside expectations, but the early rally failed to gain traction. Instead, the market reversed sharply, breaching the $597 support late in the session. This price action confirmed the forecast’s caution about downside potential below $595 and validated the model’s warning that bullish sentiment hinged on a firm hold above $600. While SPY didn’t collapse, the pullback reinforced the significance of key levels and affirmed the strategy of taking profits early amid choppy conditions.
Premarket Analysis Summary
In Tuesday’s premarket analysis posted at 8:01 AM, SPY was trading at $599.98, with the bias level set at $600. The analysis expected weakness if SPY remained below $600, favoring a move to $597.75 or lower. Upside targets were listed at $600, $603, and $605.75, with the outlook emphasizing that any rally would likely be sold into unless a strong catalyst emerged. The report cautioned that choppy, ambiguous price action was likely and advised traders to prioritize smaller plays between levels rather than chasing extended moves. Overall, the tone was cautious and defensive.
Validation of the Analysis
Tuesday’s trading confirmed the premarket forecast with impressive accuracy. SPY failed to sustain trade above the $600 bias level after the open, and quickly retreated toward the downside target of $597.75, eventually closing just below that level. No meaningful break toward $603 occurred, and the predicted chop and clustering played out as markets digested geopolitical tensions. The analysis successfully flagged the lack of momentum and the need for quick profit-taking. Traders who followed the plan had multiple opportunities to short near $600 and lock in profits near $597 or lower. The guidance proved timely and precise in a headline-driven session.
Looking Ahead
Markets will be on edge Wednesday as the FOMC decision and updated economic projections take center stage. With recent data showing cooling inflation but weak consumer activity, the Fed’s tone on future rate cuts could shape sentiment into quarter-end. Unemployment claims also drop in the morning, adding another layer of risk. Traders should expect volatility and prepare for sharp moves depending on how the Fed signals its path for the rest of 2025. Macro developments, especially in the Middle East, will continue to weigh on risk appetite and market direction.
Market Sentiment and Key Levels
SPY closed Tuesday at $597.53, beneath the critical $600 level and just above support at $595. This loss of momentum shifts short-term sentiment slightly bearish, especially given the geopolitical context and rising Treasury yields. Key resistance now sits at $600, followed by $605, while support lies at $595, $592, and $590. A break below $590 could accelerate losses toward $585, undermining the current bullish structure. Conversely, a move back above $600 may reestablish bullish control and target $605. For now, sellers appear to be regaining the upper hand, but economic news could quickly change that outlook.
Expected Price Action
Our AI model projects SPY’s range for Wednesday between $590 and $603, implying a wide range and the likelihood of trending action. The market leans bearish under current conditions, with downside targets at $595, $592, and $590. If SPY loses $590, a deeper pullback to $585 could follow. On the upside, recovery above $600 would open the path toward $603 and a stretch to $605. This is actionable intelligence: traders should favor short trades on failed rallies below $600 and long setups only if $595 holds with confirmation. External risks, especially from the Fed and Middle East developments, may produce sharp swings in either direction.
Trading Strategy
With the VIX jumping 13.13% to 21.62, volatility is rising and traders should stay cautious. Long trades can be considered near $595 with tight stops, targeting $600 and $605 if support holds. Short trades are preferred on failed breaks above $600 or if SPY decisively breaks $595, with targets at $592 and $590, and a stretch to $585 on heavy selling. Use smaller size and wider stops when volatility spikes. The elevated VIX signals two-way action is likely, and quick reversals remain a risk. Maintain a flexible mindset and adjust trade sizes accordingly in this unstable environment.
Model’s Projected Range
The model projects SPY’s maximum expected range for Wednesday of $589 to $606.25, with the Put side dominating across a widening band suggesting trending price action for Wednesday as a result of the war in the Middle East and FOMC. Tuesday’s session reflected concerns that the US could become directly involved in the conflict, potentially putting American troops at risk. While the market pulled back, the move was not particularly significant. We believe that any further escalation involving direct US engagement would likely trigger substantial market pressure. Risks stemming from the Middle East should not be underestimated. As such, we maintain a cautious outlook until more clarity emerges. The broader bullish narrative remains intact as long as prices hold above $585. A break below $595 would be an early warning signal that the market may test lower levels. In the absence of a major external catalyst, our model continues to suggest that dips are likely to be bought. Key resistance levels are now seen at $600 and $605, while support is identified at $595, $592, and $590. SPY once again closed below the lower bound of a steep, uncorrected bull channel that has been in place since April. The model is expected to redraw this channel after tomorrow’s close. Resistance in the $600–$610 range is likely to cap near-term upside, while support between $590 and $585 appears to be firming. Consequently, SPY seems poised to revert to the $575–$595 range that has defined much of the trading since mid-May, assuming geopolitical tensions remain contained. For Wednesday, holding above $590 would support a recovery toward $595 or $600. A break below $590, however, could target $585, a critical level for maintaining the current bullish structure. Since April, market direction has been closely aligned with macroeconomic data, bond yields, inflation readings, tariff developments, and fiscal policy signals, a dynamic that is likely to persist barring a significant policy shift. Meanwhile, the VIX jumped 13.13% to 21.62. While still below the 23 level typically associated with risk-off sentiment, the move reflects rising investor caution and an increased likelihood of volatility. In this environment, traders are advised to remain agile and responsive to both economic data releases and evolving geopolitical developments as the week unfolds.
Market State Indicator (MSI) Forecast
Current Market State Overview:
The MSI is currently in narrow Bearish Trending Market State, with SPY closing just below MSI resistance. There were no extended targets printing into the close which implies a weak bear trend which may stall above $595. The MSI opened the day in a very narrow bullish state which initially saw prices move higher toward the $602 level. There were no extended targets and in a very narrow state, the bull trend was clearly weak. By 1 pm on news that the White House called on Iran to surrender unconditionally, the market sold off and the MSI began a series of rescalings lower with extended targets printing below. This continues into the close with SPY settling near the lows of the session. Currently, MSI support stands at $597.08 with resistance at $597.81.
Key Levels and Market Movements:
On Monday, we noted: “With escalating tensions in the Middle East, don’t assume today resolved the conflict or eliminated the associated risks. This may have been nothing more than a dead cat bounce.” We also stated, “Our model suggests a likely test of the overnight gap at $597,” and, “We continue to favor long setups above $595 and shorts above $600.” With this plan in hand, SPY tested $598.25 overnight and opened Tuesday at $600.21, above a narrow bullish MSI and with a premarket level at $601 just overhead. Given this setup, we held off and waited for a more actionable trade. SPY briefly spiked lower to $599.20, forming a weak failed breakdown, sufficient for us to initiate a long at MSI support at $599.90, with a first target set at the premarket level of $601. This level was reached after 10 a.m., but instead of continuing higher, SPY began moving sideways. With our second target set at another premarket level at $603, the lack of momentum prompted us to exit the long and reverse short on a head-and-shoulders pattern forming near $601.50 just before 1 p.m. We set our first target at MSI support at $600.21, which was quickly hit. Given the countertrend nature of the move, we tightened risk by moving the stop to breakeven and set our second target at $597.75, another key premarket level. Then news broke suggesting the U.S. might become more directly involved in the Middle East conflict, triggering a sharp sell-off. SPY hit our second target by 2 p.m., and we opted to trail the position. After a failed breakdown just before 3 p.m. and with extended targets no longer printing, we exited the short, capping off a strong countertrend day. Going two for two ahead of Wednesday’s FOMC, this session underscored the value of a structured plan, disciplined execution, and the strategic use of MSI for control, timing, and identifying actionable levels. Integrated within our broader framework and model levels, MSI continues to prove indispensable for consistent trading performance.
Trading Strategy Based on MSI:
Wednesday brings Unemployment Claims premarket, which are unlikely to significantly move markets given the broader global dynamics at play. Instead, FOMC and developments in the Middle East will be the primary market drivers. FOMC days are often filled with traps, multiple failed breakdowns and failed breakouts, and traders should remain alert. This session has the potential to move markets by $10 or more. Should the U.S. escalate its involvement in the Middle East conflict, expect a knee-jerk selloff in equities as crude spikes, particularly if crude breaches $100 per barrel. At that level, inflation concerns will resurface and likely weigh heavily on the market, even if only temporarily. Absent these macro risks, the bull trend remains intact as long as SPY holds above $585. However, a test and failure of $590 would be an early warning that further downside may be ahead. It’s essential to trade what’s in front of you, recognizing that the model cannot anticipate the impact of economic releases or geopolitical developments until they materialize. The market remains priced for perfection, making it vulnerable to sharp selloffs on negative headlines. We highly recommend downside protection via protective puts or VIX calls. External catalysts such as tariffs continue to pose significant risk and could swiftly shift sentiment. A return to the $575–$595 range that has dominated since May is very possible. On the upside, as long as SPY holds above $590 on Wednesday, a move toward $605 remains on the table. Conversely, a break below $590 could trigger a deeper pullback toward $585. This area forms a critical inflection zone that could shift short-term control back to the bears. Unless a meaningful breakdown occurs, the path of least resistance remains higher. A sustained move above $605 would likely open the door to new all-time highs. We continue to favor long setups above $590 and shorts above $600. Tactical shorts can also be considered on failed breakouts or failed holds below $590, particularly if MSI shows signs of weakening. Failed breakouts and breakdowns remain high-quality opportunities. Stay alert and responsive as these setups develop. Avoid trading during Ranging Market States and always align your strategy with the MSI. MSI provides real-time insight into market control, momentum shifts, and actionable levels. When paired with our Pre-Market and Post-Market Reports, it sharpens execution and elevates trade quality. If you haven’t yet integrated MSI and model levels into your process, now is the time. Contact your representative to get started as these tools are built to promote consistency and improve performance.
Dealer Positioning Analysis
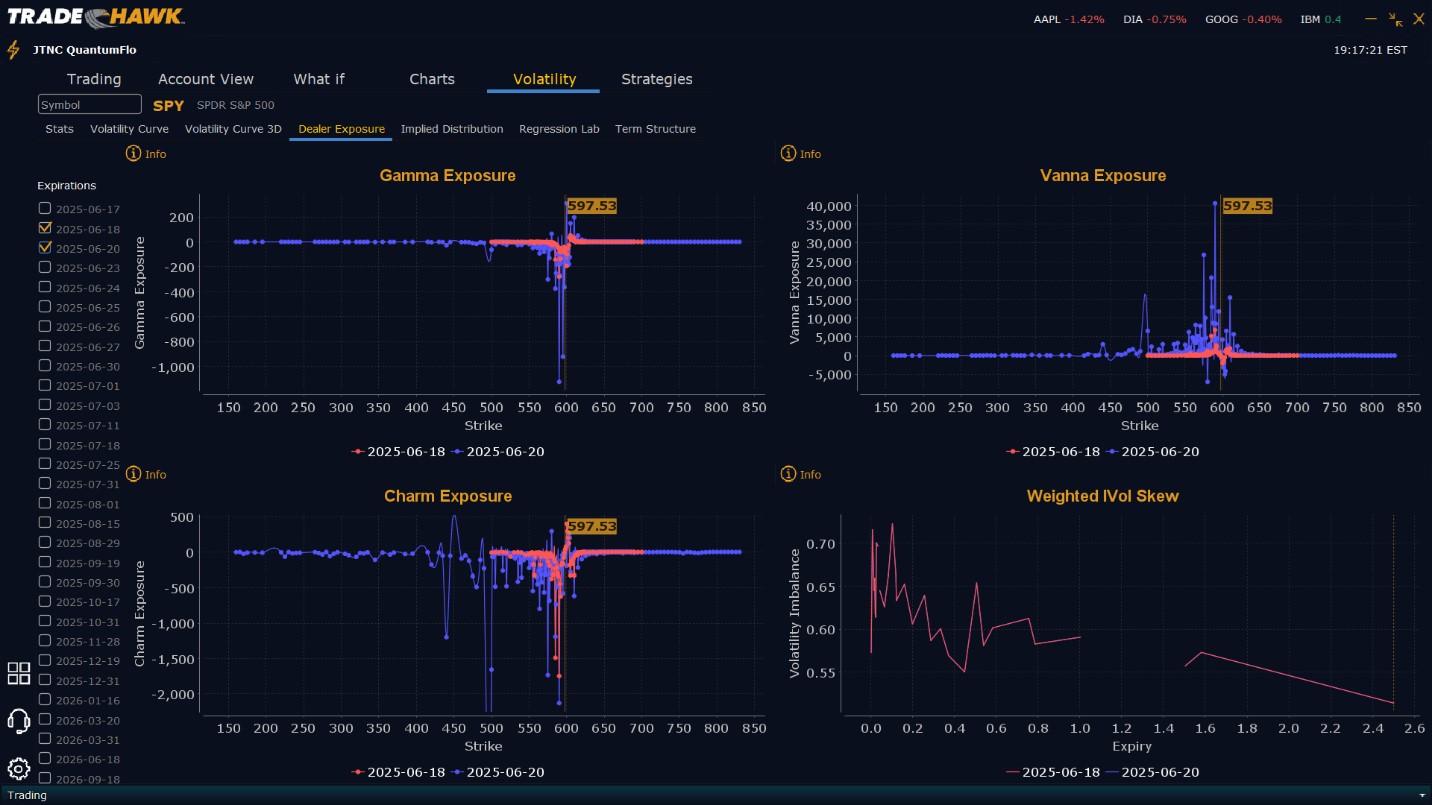
Summary of Current Dealer Positioning:
Dealers are selling SPY $604 to $610 and higher strike Calls while buying $598 to $603 Calls indicating the Dealers desire to participate in any rally on Wednesday. The Dealers are implying a peak for Wednesday of $605. To the downside, Dealers are buying $597 to $550 and lower strike Puts in a 2:1 ratio to the Calls they’re selling/buying implying less concern that prices may move lower. Dealer positioning has changed from slightly bearish to neutral.
Looking Ahead to Friday:
Dealers are selling $604 to $615 and higher strike Calls while buying $598 to $603 Calls as well as selling $580 Puts implying the Dealers belief that if the market continues to fall, the floor is $580. They are using the revenue from the sale of Puts to buy Calls in order to participate in any rally which may develop by the end of the week. This is called a risk reversal trade, selling one side to finance a long for the other side, This positioning showed up yesterday and isn’t typically seen this clearly in Vanna. Given it remains with three days to expiry, the Dealers are convinced the range will stabilize no lower than $580 but also no higher than $605. To the downside, Dealers are buying $597 to $505 and lower strike Puts in a 4:1 ratio to the Calls/Puts they’re selling/buying, reflecting a bearish outlook for the week. Dealer positioning is unchanged from bearish to bearish. As we stated yesterday, we have not seen bearish positioning in some time so Dealers are implying concern that the bull trend may in fact be coming to an end or at least face headwinds. We advise reviewing Dealer positioning daily for directional clues. These positions evolve quickly and tracking them is essential for staying ahead of shifting market sentiment.
Recommendation for Traders
SPY’s failure to hold $600 and a close near $597.50 suggests caution is warranted. Long trades may be considered above $595 with targets at $600 and $605, but traders should use tight stops to manage risk amid rising volatility. Short trades are favored on failed breakouts near $600 or clean breaks below $595, with targets at $592, $590, and potentially $585. The elevated VIX at 21.62 signals increased price swings, so traders should reduce exposure and position size. Monitor geopolitical headlines closely as they remain the key driver of sentiment. Review the premarket analysis posted before 9 AM ET to align with the latest strategy and dealer positioning.
Good luck and good trading!
