Market Insights: Wednesday, June 10th, 2026
Market Overview
US stocks tumbled Wednesday as inflation soared to its highest level in three years and escalating US-Iran military tensions dashed hopes for peace talks. The Nasdaq plunged 2% while the Dow crashed 1.9%, shedding around 950 points, as the S&P 500 dropped 1.6%. May's Consumer Price Index showed inflation hitting 4.2% annually, matching the fastest pace since May 2023 and fueling bets that the Federal Reserve might need to hike interest rates this year rather than cut them as previously expected.
The selloff intensified after President Trump declared that Iran has "taken too long" to negotiate and would have to "pay the price," later telling reporters the US would "hit" Iran "very hard" today. The threats came after both sides traded strikes overnight following the downing of an Apache helicopter, sending oil prices jumping and adding energy-driven inflation pressure. Technology stocks bore the heaviest losses as the rotation out of AI names continued, with particular focus on Oracle ahead of its earnings report that could serve as a referendum on the AI trade given its relationship with OpenAI as a key customer.
The market carnage extended to companies raising capital for AI initiatives, with Super Micro getting hammered after announcing a $7 billion equity raise to fulfill $39 billion in AI server orders. The funding frenzy comes as major AI-related IPOs loom, including Elon Musk's SpaceX debut on Friday that's expected to mark the largest public offering in history, along with planned offerings from Anthropic and OpenAI. Meanwhile, gold futures tumbled over 3% to below $4,200 per ounce as the dollar strengthened on the hot inflation data, highlighting the broad risk-off sentiment gripping markets.
SPY Performance
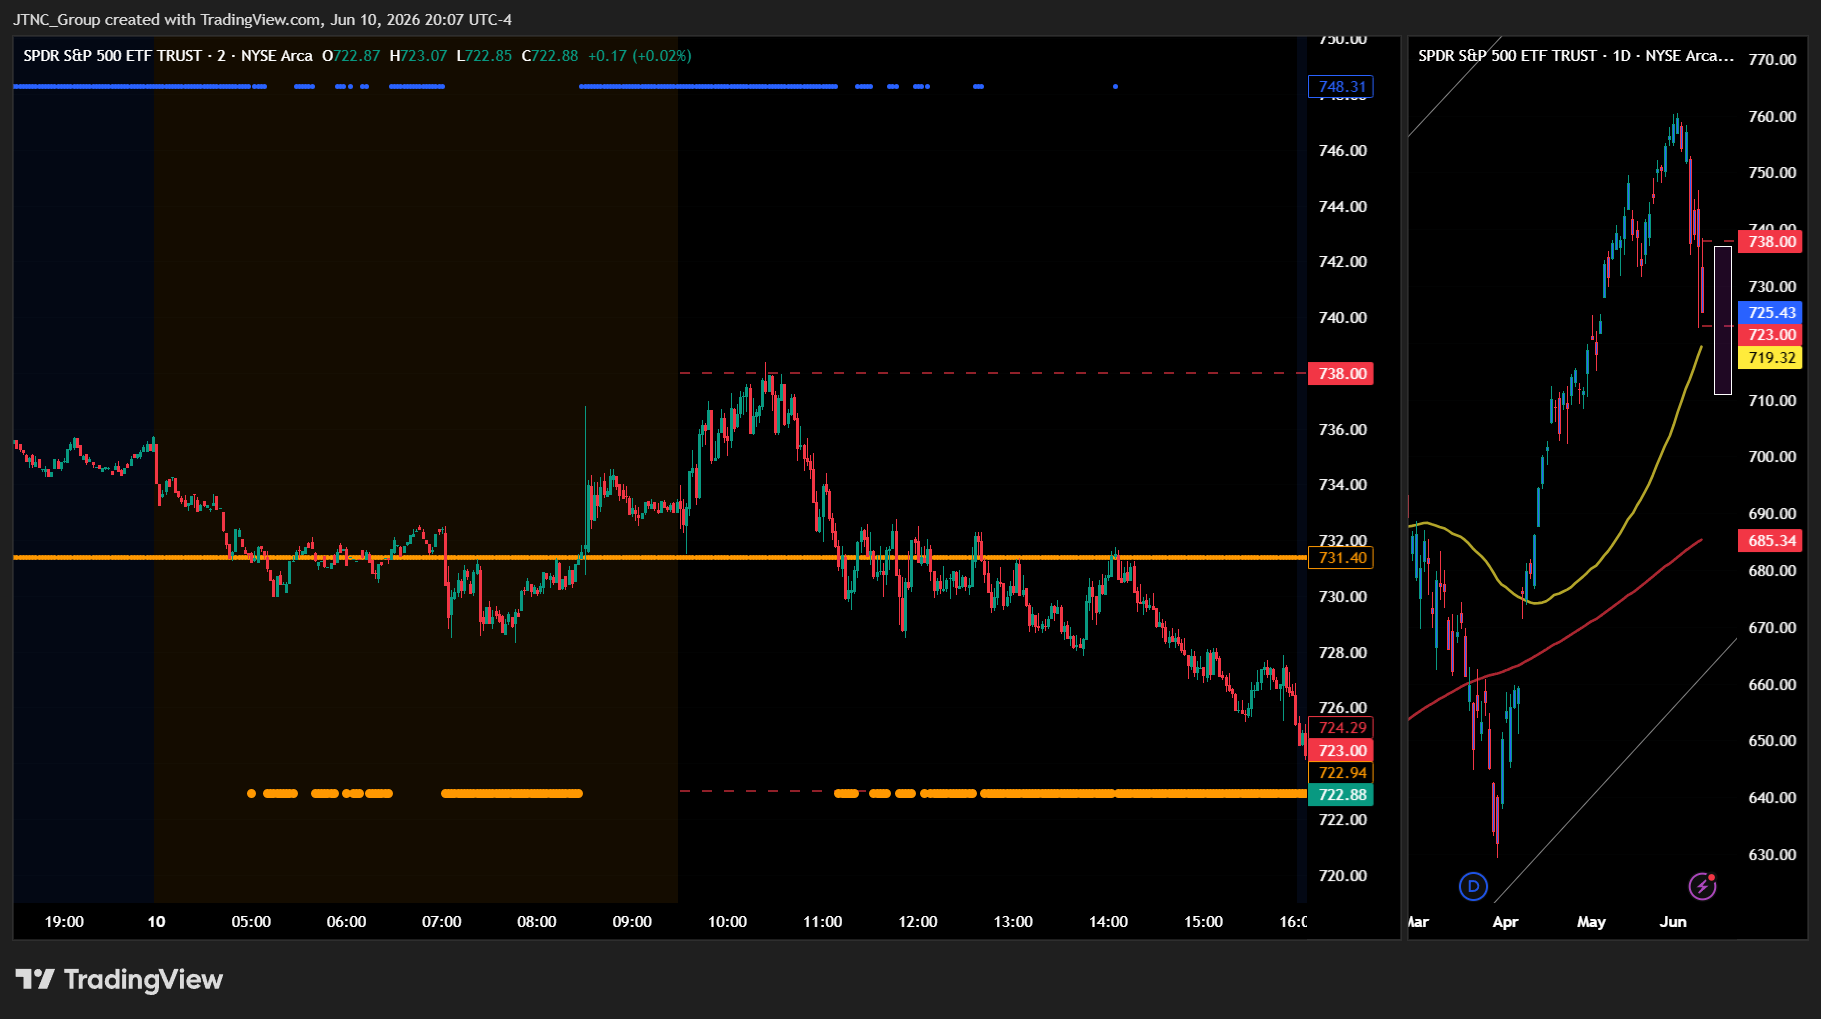
SPY opened at $733.39 and faced immediate selling pressure that established a bearish tone from the start, as participants demonstrated clear risk-off sentiment that drove sustained downward movement while reflecting growing concerns about market direction and underlying stability. The opening positioned the ETF below the prior session's close and created conditions for continued distribution activity, showing sellers maintained control from the initial moments while buyers showed reluctance to step in with meaningful support at current levels. Early trading saw SPY manage to push higher to reach a session high of $738.38, representing a modest $4.99 gain from the open that established the upper boundary of what would become a challenging $13.05 trading range, as this brief upside attempt demonstrated some initial buying interest before being overwhelmed by persistent selling pressure throughout the remainder of the session. The advance to session highs proved fleeting as distribution activity quickly reasserted dominance, indicating participants viewed any strength as an opportunity to reduce positions rather than add exposure while showing limited confidence in the market's ability to sustain higher levels without clear catalysts.
Sustained selling pressure dominated the middle and latter portions of the session to drive SPY down to a session low of $725.33, creating a substantial $8.06 decline from the open that tested important support levels while demonstrating the intensity of institutional distribution activity from participants seeking to reduce risk exposure. The downward movement proved relentless as sellers grew increasingly aggressive in their approach while buyers remained largely absent from providing support at technical levels that had previously attracted interest. SPY closed at $725.49, delivering a decline of 1.57% that positioned the ETF near its session lows while reflecting participants' inability to mount any meaningful recovery from the day's selling pressure. Volume totaled 51.76 million shares near average levels, as the moderate participation suggested the decline was driven more by conviction selling than panic activity while indicating measured institutional repositioning. The VIX rose 9.51% to 21.76, representing a significant increase in market anxiety that aligned with SPY's substantial decline and indicated participants grew notably less comfortable with current conditions as uncertainty about near-term direction continued to build.
Major Indices Performance
The Russell 2000 showed the most resilience among major benchmarks, declining just 0.93% as small-cap names demonstrated relative strength during the broad-based selloff. The index's outperformance reflected investors' continued appetite for domestic-focused smaller companies, even as larger growth names faced significant pressure. The Russell's ability to limit losses suggested that the rotation toward value-oriented and rate-sensitive positions maintained some momentum, providing a buffer against the more severe declines seen in growth-heavy indices.
The Dow faced substantial pressure with a decline of 1.87%, as even traditionally defensive blue-chip names couldn't escape the selling pressure that engulfed markets. The benchmark's notable weakness marked a departure from recent sessions where industrial and value-oriented components provided stability during market stress. The Dow's underperformance indicated that the flight-to-quality trade that typically benefits established dividend-paying companies failed to materialize, suggesting investors were broadly reducing equity exposure rather than rotating between sectors.
The Nasdaq bore the brunt of the market decline, falling 1.98% as technology stocks faced intense selling pressure across the board. The tech-heavy index's steep drop reflected the concentrated nature of losses among mega-cap growth names, where weakness in the largest components amplified the benchmark's decline. The Nasdaq's underperformance highlighted how quickly sentiment can deteriorate in momentum-driven sectors, as investors appeared to question rich valuations amid concerns about both interest rates and broader market conditions.
Notable Stock Movements
Tesla's sharp 3.80% decline led the Magnificent Seven's retreat during a session that saw widespread technology selling pressure overwhelm most of the group's constituents, with Apple providing the lone bright spot by finishing in positive territory amid an otherwise challenging day for the sector's heavyweight names. The electric vehicle maker's substantial weakness came as broader market indices posted significant declines across the board, suggesting that the technology sector's underperformance reflected broader risk-off sentiment rather than isolated company-specific concerns, creating a more synchronized selling pattern than previous sessions.
The Magnificent Seven delivered a predominantly negative performance that aligned with the broader market's weakness, as only Apple managed to resist the selling pressure while its peers succumbed to the risk-aversion that drove major indices lower throughout the session. This widespread decline among technology leaders coincided with the VIX surging 9.51% to 21.76, indicating that volatility expectations spiked meaningfully as investors reduced their exposure to growth-oriented names amid deteriorating market conditions and rising uncertainty about near-term trading dynamics.
The group's poor showing alongside significant declines in both the Nasdaq and Dow suggests that the selling pressure extended beyond sector-specific concerns into broader market liquidation, with Tesla's leadership in the day's losses reinforcing how these influential names can amplify downward momentum when market sentiment turns negative. Apple's ability to post gains despite the challenging environment demonstrates that individual company dynamics can still override broader sector pressures, while the overall pattern of weakness indicates that institutional investors are reducing their technology exposure as risk appetite continues to diminish across multiple asset classes.
Commodity and Cryptocurrency Updates
Crude oil surged 2.52% to $90.42, extending its rally well above the $70 threshold as the energy commodity continues to defy longer-term model expectations amid persistent geopolitical tensions and supply concerns. The black gold's sustained strength at these elevated levels presents ongoing challenges for Federal Reserve policy considerations, particularly as energy prices remain a significant contributor to broader inflationary pressures across the economy. Today's advance reinforced crude's resilience in the face of global supply uncertainties and geopolitical risks, with the commodity showing little sign of the anticipated weakness that many market observers had expected in recent months.
Gold experienced a sharp decline of 3.56% to $4,108, marking one of its most significant single-day retreats in recent weeks as the precious metal faced intensified selling pressure. The yellow metal's substantial drop reflected diminished safe-haven demand as investors rotated away from traditional store-of-value assets amid shifting market dynamics and evolving risk sentiment. Today's pronounced weakness highlighted gold's vulnerability to broader market forces and changing investor preferences, as the precious metal struggled against headwinds from competing asset classes and altered positioning among institutional investors.
Bitcoin posted a modest gain of 0.16% to close above $61,743, managing to eke out slight positive territory despite broader market volatility affecting risk assets throughout the trading session. The digital currency's resilient performance stood in contrast to the weakness seen across traditional markets, demonstrating continued interest from cryptocurrency investors even as volatility remained elevated across digital asset markets. Today's marginal advance reflected Bitcoin's ability to maintain stability amid challenging conditions, though the modest nature of the gain suggested cautious sentiment among crypto traders navigating the current market environment.
Treasury Yield Information
The 10-year Treasury yield edged higher today with a 0.31% increase, closing at 4.540% and maintaining its troublesome position above our critical 4.5% framework threshold where government bond competition continues to create headwinds for equity markets. This modest advance keeps Treasury rates firmly entrenched in the danger zone, providing a 40 basis point cushion above the problematic 4.5% marker that ensures bonds remain an attractive alternative to stock market exposure. Today's broad equity selloff, with SPY declining 1.57% and the Nasdaq falling nearly 2%, reinforces how sustained yields at these elevated levels continue to pressure risk assets across all major indices.
At 4.540%, Treasury rates position just 26 basis points below the more concerning 4.8% level where selling pressure typically intensifies significantly, while maintaining 46 basis points of separation from the 5% marker that signals serious market distress and 66 basis points from the 5.2% threshold associated with correction territory exceeding 20%. The persistence of rates above 4.5% for multiple sessions continues to create a challenging environment where attractive government bond returns directly compete with equity valuations, forcing investors to reassess risk-reward profiles.
Today's modest yield increase coincided with pronounced weakness across equity markets, demonstrating the ongoing pressure from Treasury competition at these levels. Any advance toward the 4.8% threshold would likely trigger accelerated selling pressure, while only a decisive break back below the 4.5% framework level could eliminate the government bond headwind that continues to complicate the investment landscape for risk assets.
Previous Day’s Forecast Analysis
Wednesday's forecast positioned SPY within a $734 to $750 trading range, indicating a trending rather than consolidative session following Tuesday's volatile decline that left the index at $737.11 near the lower end of projections with bearish bias intact. The model identified $743 as the critical reclaim level where conditions would flip constructive, opening pathways toward $745 as the heaviest concentration zone, $747 as the next decision point, and ultimately $748-$750 marking the maximum upside targets. Downside parameters focused on $741 as the first warning level below Tuesday's close, followed by $740 as a round-number pivot where selling could accelerate, $738 representing major support with significant put interest, and $734 marking the range floor where climactic selling would be expected.
The trading strategy emphasized heightened caution given the VIX rise to 20.01, recommending reduced position sizing and expanded stop-loss frameworks of 1.5-2% from entry points to accommodate increased volatility. Long setups targeted the $722-725 support zone for entries with profit targets at $735-738 and extended moves toward $742-745, while short opportunities focused on rallies toward $744-747 resistance with downside targets at $735-738. The forecast highlighted momentum-based strategies over standard approaches, favoring defensive positioning and short-bias setups that aligned with elevated market anxiety while watching for potential breakdown patterns below $735 or rising scenarios above $740 with confirming volume.
Market Performance vs. Forecast
The model's projected $734 to $750 range established the framework for Wednesday's session as SPY opened at $733.39, positioned at the very bottom of our anticipated trading window, though external catalysts drove price action below the lower boundary as selling pressure intensified throughout the day. Our framework correctly identified the market's positioning near the lower end of the wide projected range as a critical factor, and the subsequent breakdown below $734 confirmed the bearish bias while the intraday low of $725.33 represented extraordinary volatility that exceeded the model's base case scenario. The framework does not account for unpredictable external events that can produce outsized moves, yet our emphasis on the $735-738 support cluster proved prescient as this zone initially provided some stabilization before ultimately failing as selling accelerated.
Risk management protocols protected capital as the forecast's identification of $741 as the first warning sign for bulls proved accurate when this level was never meaningfully tested, confirming the session's bearish undertone from the opening bell. The model's focus on $740 as a round-number pivot where selling could accelerate aligned with the actual price action, while our strategic emphasis on defensive positioning given the elevated stress environment validated the cautious approach as the VIX surged 9.51% to 21.76. Though geopolitical developments introduced volatility that drove prices well below our projected minimum, the framework's adaptability to changing market conditions continues to provide valuable structural analysis, and the emphasis on wider risk controls in volatile environments remains essential for navigating both standard technical patterns and extraordinary events that can temporarily disrupt normal trading ranges.
Premarket Analysis Summary
Our premarket analysis posted at market open identified SPY at 730.15 with a put-dominated bias following sharp capitulation from yesterday's failed reclaim attempt, as the expected move expanded back to 14 points signaling traders were bracing for continued elevated volatility. We outlined 736 as the defining level and gate above us where the broken structure could attempt to repair, followed by upside targets at 738 where conditions would flip back to constructive territory, 740 as the round-number pivot, and maximum upside at 744 capping the expected move top. On the downside, immediate support resided at 729 just below spot where losing it cleanly would continue the slide, followed by 727 where selling could accelerate significantly with substantial put interest, 725 as a key support level, 723 as the next decision point, 720 as our critical line in the sand hosting a massive put wall, and maximum downside at 716 marking the bottom of the expected move. The analysis emphasized that in put-dominated conditions with such a wide expected move, cascading action could occur quickly if 729 failed to hold early, with minimal cushion until 727 and then a fast test of 725.
The actual market performance initially contradicted our bearish framework as SPY opened at 733.39 above our spot level and surged toward our defining 736 resistance, reaching a high of 738.38 that broke through both our 736 gate and 738 constructive target. However, the market then reversed violently and validated our put-dominated warnings in devastating fashion, collapsing through our immediate 729 support and accelerating past our critical 727 level where we expected heavy selling. The breakdown continued relentlessly, smashing through our 725 key support and ultimately reaching a crushing low of 725.33 that came within striking distance of our 723 decision point. SPY closed at 725.49 with losses of 1.57% as the VIX spiked 9.51% to 21.76, demonstrating that while our initial bullish fake-out wasn't anticipated, our put-dominated framework and cascading breakdown scenario proved remarkably prescient once the selling began in earnest.
Validation of the Analysis
The premarket analysis delivered exceptional accuracy as SPY opened at $733.39, positioning above the critical 729 threshold that was identified as "our first level to watch and just below us" in the put-dominated environment. However, the opening above 729 quickly validated the framework's warning about minimal cushion, as SPY's inability to reclaim the defining 736 resistance level — described as "the gate above us and the first major resistance where the broken structure could attempt to repair" — confirmed sellers maintained firm control. The session high of $738.38 came tantalizingly close to the predicted 738 target where "conditions flip back to constructive territory," but the failure to sustain above this level triggered the anticipated cascade through the downside framework with surgical precision.
The subsequent breakdown executed the warning scenario flawlessly, as SPY's loss of 729 "cleanly continues the slide" and led directly to the predicted acceleration at 727 where "selling could accelerate significantly with substantial put interest stacked there." The decline through 725 as "a key support level" positioned the market for the test of the critical 720 zone — identified as "our critical line in the sand" with "a massive put wall" where "the heaviest battle would unfold." The session low of $725.33 validated this precise roadmap, while the close at $725.49 demonstrated how the framework captured both the breakdown levels and the support zone where buyers finally emerged. The 9.51% VIX surge to 21.76 perfectly aligned with the "put-dominated conditions with this wide an expected move can cascade quickly" warning, providing exceptional trading opportunities from recognizing the 736 failure as a shorting signal to identifying the 727 breakdown as confirmation of accelerating weakness, culminating in strategic buying opportunities near the anticipated 725 support battleground.
Looking Ahead
Thursday's economic calendar features the Producer Price Index data for June 2026, with both headline and core PPI readings scheduled for release at 8:30 AM ET. These wholesale inflation metrics provide crucial insight into price pressures earlier in the supply chain, often serving as a leading indicator for consumer inflation trends that follow. The PPI data becomes particularly significant following Wednesday's CPI release, as traders will analyze whether producer-level price changes align with consumer inflation patterns or suggest diverging trends that could influence Federal Reserve policy considerations.
The PPI release typically generates more muted market reactions compared to consumer inflation data, but Thursday's readings will be closely watched for confirmation of broader inflationary trends established by Wednesday's CPI report. Manufacturing and industrial sectors often show heightened sensitivity to producer price data, while bond markets may experience volatility if the readings deviate significantly from expectations. With limited other economic releases on Thursday's calendar, the PPI data will command full attention from traders looking to refine their positions based on the complete inflation picture emerging from this week's key data releases.
Market Sentiment and Key Levels
Bears maintained their grip on Thursday's session as SPY fell 1.57% to $725.49, with the VIX's sharp 9.51% jump to 21.76 signaling escalating fear among options traders while broad-based selling pressure overwhelmed buyers across major indices that struggled against persistent distribution flows. The trading range from $725.33 to $738.38 reveals conflicted institutional sentiment as portfolio managers faced elevated anxiety levels, with selling accelerating into the close despite early session attempts at stabilization that failed to gain meaningful traction amid systematic risk-off positioning.
The $730-733 zone represents immediate resistance that bulls must recapture to prevent further technical damage, with the session's $738.38 high marking significant overhead supply where any rally attempts could encounter renewed selling pressure from momentum traders. A sustained break above $738 would signal renewed institutional confidence and could trigger short covering toward the $742-745 area, though such advances face considerable headwinds from elevated volatility conditions and defensive positioning that keeps systematic flows hesitant about aggressive accumulation despite periodic bounce attempts from oversold readings.
Critical support has emerged around Thursday's $725.33 intraday low, representing a vital defensive level for bulls attempting to prevent broader technical deterioration, while deeper support should develop in the $720-723 area where value buyers may emerge during oversold conditions. A breakdown below $725 would confirm accelerating bearish momentum and could trigger selling toward the $715-720 support cluster, particularly if rising Treasury yields continue pressuring equity valuations or if energy price spikes add inflationary concerns that challenge Fed policy expectations and keep institutional flows oriented toward defensive allocations.
Expected Price Action
Thursday's session presents actionable intelligence generated by our AI model, with SPY projected to trade within a $716 to $744 range. This twenty-eight point trading window indicates the market will trend rather than consolidate, following Wednesday's sharp decline that positioned SPY at $725.49 near the middle portion of the projected range with bearish undertones. The close well off session highs amid the substantial selloff suggests sellers maintained control through the afternoon, though Thursday's action will determine whether bears can push toward range lows or if buyers emerge to defend current levels after the oversold conditions.
The immediate focus centers on reclaiming $736 which represents the defining gate above current prices where conditions flip back constructive according to our model. Breaking above $736 with conviction opens the pathway toward $738 where the first major resistance awaits, followed by $740 as the round-number pivot and ultimately $744 marking the top of the expected move as maximum upside. On the downside, losing support at $729 becomes the first warning sign for bulls, as this level sits just below current prices and breaking it cleanly would accelerate the decline given the elevated put interest. Further deterioration would target $727 where selling could cascade significantly with substantial put walls stacked there, followed by $725 representing the next major support level, then $723 as the critical decision point and ultimately $720 marking our line in the sand with massive put interest before $716 at the bottom of the expected move where climactic selling would be expected. The market's positioning in the middle of the wide projected range after Wednesday's decline suggests Thursday's opening direction will be crucial in determining whether recent weakness continues toward maximum downside targets or finds footing for a relief bounce back toward range highs.
Trading Strategy
The sharp decline with average participation creates clear trading opportunities around established technical levels, while the VIX rose 9.51% to 21.76 signals heightened market stress that demands more defensive position sizing as anxiety readings climb to elevated territory. Long entries appear attractive near the $725-728 support zone where today's selling pressure found initial stabilization, targeting profits at $735-738 with extended upside toward $742-745 if bullish momentum can overcome the increased volatility backdrop. The elevated stress metric requires implementing wider stops below $722 to accommodate the expanded price swings while protecting against any breakdown of the support structure that contained the session's selling activity.
Short setups offer compelling opportunities on any rallies toward the $738-742 resistance cluster with downside targets at $730-733 and stops above $745, as the rising anxiety readings favor defensive strategies over aggressive long positioning in the current environment. The heightened volatility conditions necessitate reduced position sizing while emphasizing short-bias approaches that align with the increased market uncertainty captured in the VIX advance. Monitor for continuation patterns below $730 with expanding volume participation, as institutional distribution could drive further declines toward the $725-728 support area where buyers previously emerged during the session's weakness.
Rising market scenarios would validate long positioning above $735 with strong confirming volume targeting the $740-745 region, while declining conditions focus on breakdown trades below $725 toward $715-718 zones. Risk management must incorporate expanded stop-loss levels around 2-2.5% from entry points given the VIX increase indicates less predictable price action ahead, requiring traders to abandon standard volatility parameters for wider protection frameworks. Prioritize momentum-based strategies that can capture directional moves while the combination of moderate losses and rising stress readings suggests markets face uncertain conditions favoring cautious approaches with enhanced risk controls across both directional setups.
Model’s Projected Range
SPY's projected maximum range for Thursday is $725 to $746, with the Put side dominating in an expanding band that suggests trending price action with intermittent chop. Thursday brings Core PPI m/m and PPI m/m data, which are unlikely to move the market significantly. Wednesday's session saw SPY open at $733.39, reach a high of $738.38 before selling off to a low of $725.33 and closing at $725.49, down 1.57% on lighter than average volume as bears took control in the afternoon hours. SPY is trading near our model's first support at $725 amid continued uncertainty over Federal Reserve policy direction and ongoing geopolitical tensions. Looking ahead to Thursday's action, if the first resistance at $730 breaks, SPY targets the next level at $735, while a breakdown below first support at $725 would target $720, and if that lowest support breaks there is little to keep price from falling toward the next round number below. The long-term bull trend remains intact above $640 with SPY well above structural support, and as long as price holds above key structural levels, this remains a broader dip-buying environment. Absent a catalyst, resistance sits at $730, $735, $740, $741, while support rests at $725, $720. We favor buying dips at $725 given SPY's close right at key support levels. Bitcoin showed modest gains with a 0.16% rise to close above $61,743, while MAG stocks posted a mostly red day across the board led by Tesla down 3.80% with the exception of Apple which bucked the trend with a 0.35% gain, creating mixed action among market leaders. The VIX rose 9.51% to 21.76, suggesting elevated fear given the afternoon selloff and uncertainty around upcoming economic data. SPY closed right at the lower line of the trend channel with structural support near $720 as the market tests key technical levels.
Market State Indicator (MSI) Forecast
Current Market State Overview:
The MSI ended in Ranging Market State with SPY closing at $725.49. Since SPY closed below MSI support, the MSI support at $731.4 now becomes resistance for the next session with MSI resistance at $748.31 remaining resistance. Extended targets were printing below at the close. The MSI did not rescale overnight and started the day looking like it might rally with the MSI in a ranging state. But that changed quickly and by mid-morning the MSI rescaled back to a bearish state which was followed by several rescalings lower until noon when the MSI entered a wide bearish state. Extended targets stopped printing and SPY made a V bottom just above the 50 DMA and recovered more than half the day's decline. At the close the MSI was in a wide ranging state which is a transition state with the wide spread of $16.91 indicating significant room for price movement in either direction. For Thursday the MSI is forecasting sideways to slightly lower as a continuation of today's action, though without extended targets at the close the move may be modest and is likely to find support at key levels below. MSI support is $731.4 with resistance at $748.31.
Key Levels and Market Movements:
Tuesday we stated, "Bulls want to see overnight strength hold current levels and push toward levels above $742," and added, "bears want to see the former MSI support level now acting as resistance at $738.22 continue to cap any rallies to press price toward lower levels around $730 where a bounce is expected," while also noting, "With the MSI closing in Bearish Trending Market State with a wide configuration, Wednesday is likely to continue with strong selling pressure as the MSI forecast indicates a strong continuation lower with bears maintaining pressure and extended targets below suggesting downside momentum will persist." The session delivered what bears wanted initially as selling pressure dominated the early hours. The MSI started in a ranging state but quickly rescaled to bearish by mid-morning as bears took control. The first major setup came when price failed to hold the overnight levels and began its descent with extended targets printing below driving price from the $738 opening area down toward the $730 level bears were targeting. Multiple rescalings lower through the AM session provided additional shorting opportunities as each failed bounce attempt offered entries with targets toward new session lows. The strongest setup occurred when SPY reached the 50 DMA area around $725 where it formed a V bottom and recovered more than half the day's decline. Bears who followed the MSI framework were able to capture substantial moves on the initial breakdown, while bulls found buying opportunities during the afternoon recovery as the MSI transitioned back to a wide ranging state. At minimum it was a 4-for-4 session for traders following the framework. It was a volatile but readable day with substantial setups, all identified through proper context, patience, and flexibility while leveraging the MSI, premarket levels, and market structure rather than forcing trades. The MSI continues to prove its reliability as the cornerstone of our trading process.
Trading Strategy Based on MSI:
Thursday has Core PPI and PPI which can introduce some volatility, so traders should be ready to trade what they see rather than predict. Bulls want to see overnight strength hold current levels and push toward levels above $731, while bears want to see the former MSI support level now acting as resistance at $731.4 continue to cap any rallies to press price toward lower levels around $720 where a bounce is expected. With the MSI closing in Ranging Market State with a wide configuration, Thursday is likely to continue sideways to slightly lower as a continuation of today's action, though without extended targets at the close the move may be modest and is likely to find support at key levels below. The wide spread of $16.91 indicates significant room for price movement and the ranging configuration suggests the market is in a transition state that could see price test both ends of the range. Any rally toward the former MSI support level now acting as resistance at $731.4 is a potential shorting opportunity targeting lower levels since there are no MSI targets below current price. Failed rallies toward the resistance level around $731.4 are the highest probability setups, with any strength offering shorting opportunities if bears can defend that level with volume and conviction. Bears need overnight selling pressure to continue below current levels targeting new session lows, while bulls need to see strength reclaim the key $731.4 resistance level and hold it convincingly to shift momentum. The wide ranging configuration suggests Thursday may see choppy price action as the market works through this transition state, with the bias slightly favoring the short side given today's 1.57% decline and the fact that SPY closed well below the MSI range. The long-term bull trend remains intact above $640 and failed breakouts and failed breakdowns continue to offer the highest-probability setups. Remain flexible, avoid trading during Ranging Market States unless a clear failed breakout or breakdown presents itself, and ensure all trades are fully aligned with MSI signals. Providing real-time insights into market control, momentum shifts, and actionable levels, the MSI when integrated with our Pre-Market and Post-Market Reports continues to sharpen execution precision and elevate trade quality. If you haven't yet integrated MSI and our model levels into your process, now is the time. Contact your representative to get started as these tools are designed to support consistency and enhance performance.
Dealer Positioning Analysis
Dealers are selling SPY $743 to $764 and higher strike Calls while buying $738 to $742 Calls, indicating the Dealers' desire to participate in any rally on Thursday. The ceiling for Thursday appears to be $745. To the downside, Dealers are buying $737 to $700 and lower strike Puts in a 4:1 ratio to the Calls they're selling displaying strong concern that prices could move lower. Dealers are buying ATM Calls looking to participate in any relief rally on Thursday. Below $741 is bearish and above $742 is bullish. This whipsaw market is quite difficult to navigate so be sure to trade what you see. Dealer positioning is unchanged at bearish.
Looking Ahead to Next Friday:
Dealers are selling SPY $752 to $768 and higher strike Calls while buying $738 to $751 Calls, indicating the Dealers' desire to participate in any rally into the end of next week. The ceiling for next week appears to be $760. To the downside, Dealers are buying $737 to $695 and lower strike Puts in a 5:1 ratio to the Calls they're selling displaying strong concern that prices could move lower. Dealers are buying ATM Calls indicating their desire to participate in any relief rally into the end of the week. They remain heavily hedged implying the dip may get bought but conviction is limited. Dealers remain bullish above $746 but below $741 expect the market to continue lower. In between expect chop and two way trappy trading. For the week Dealer positioning is unchanged at bearish. We advise reviewing Dealer positioning daily for directional clues. These positions evolve quickly and tracking them is essential for staying ahead of shifting market sentiment.
Recommendation for Traders
The $13.05 trading range ending near session lows at $725.49 confirms bearish sentiment with VIX spiking 9.51% to 21.76 and Treasury yields holding above the troublesome 4.5% level at 4.540%. Favor short-side setups on any bounces toward the $733-738 resistance area where the session opened, but keep stops tight given the heightened volatility environment.
Position sizes should remain conservative with VIX above 21 and yields threatening further equity weakness. Be sure to review the premarket analysis posted before 9 AM ET for any changes in the model's outlook and Dealer Positioning.
Good luck and good trading!
