Market Insights: Thursday, May 8th, 2025
Market Overview
Markets climbed for a second straight session on Thursday, riding a wave of trade optimism and White House cheerleading. President Trump unveiled a new trade deal with the United Kingdom and encouraged investors to “buy stock now,” sparking hopes that global trade tensions may be easing. The agreement, which includes a cut in US tariffs on auto and steel imports from the UK, was promoted as the beginning of broader economic cooperation. Trump also pointed to a new tax bill moving through Congress and upcoming negotiations with China, with Treasury Secretary Scott Bessent set to travel to Switzerland. When pressed about potential tariff reductions on Chinese goods, Trump quipped, “We’ll see,” noting current duties stand at 145%. Despite a midday pullback, the major indices finished in the green. Bitcoin surged above $102,000, helped by the positive sentiment and Coinbase’s announcement of a $2.9 billion acquisition of crypto options platform Deribit. The rally followed a recent dip to $75,000 in the wake of Trump’s April tariff escalation. Markets also continued digesting Wednesday’s Fed decision to hold rates steady, though Trump reignited his feud with Chair Powell, calling him a “fool” in remarks Thursday. For investors, Trump’s bullish rhetoric and hints of more deals ahead were enough to keep the rally intact, at least for now.
SPY Performance
SPY advanced 0.67% to close at $564.92 on Thursday, a second day of gains as optimism around international trade and tech strength helped lift equities. The ETF traded in a tight but productive range, opening at $560.15 and hitting a high of $570.31 before paring gains. Volume came in at 58.97 million shares, slightly above average, indicating solid participation following Wednesday's post-Fed rally. SPY now hovers just below the crucial $565 resistance level, a battleground that could determine whether bulls can sustain momentum into the end of the week.
Major Indices Performance
The Russell 2000 led the way with a 1.87% gain, signaling a resurgence in small caps and risk appetite. The Nasdaq followed, rising 1.07% on the back of strong tech sector performance. The S&P 500 climbed 0.6%, and the Dow added 0.62%, or roughly 250 points, lifted by trade optimism and supportive commentary from the administration. Defensive sectors continued to lag while cyclicals and growth names took center stage. With back-to-back green days and easing trade tensions, the overall tone shifted toward cautious optimism, though uncertainty around tariffs and Fed policy still looms.
Notable Stock Movements
Tesla led the Magnificent Seven, gaining over 3% as tech continued to catch a bid. Microsoft, Amazon, and Alphabet also posted solid gains north of 1%, contributing to the Nasdaq's outperformance. The entire group saw green except for Netflix, which slipped 0.95%. These moves reflected investor confidence in large-cap tech leadership despite ongoing regulatory and valuation concerns. The positive response to trade headlines helped reinforce sentiment, particularly for companies seen as barometers of global growth and innovation.
Commodity and Cryptocurrency Updates
Crude oil surged 3.99% to settle at $60.17, hitting the model’s long-standing target. The rally was driven by a falling dollar and renewed risk appetite tied to global trade developments. However, our outlook remains bearish below $60, with expectations for crude to fall back toward $50 in the weeks ahead. Gold tumbled 1.81% to $3,304 as traders rotated out of safe havens amid rising equities and less defensive posturing. Bitcoin rallied 5.73%, closing just above $102,800, its highest level since January. The breakout followed both bullish trade headlines and Coinbase’s high-profile acquisition of Deribit, which lifted sentiment across the crypto space.
Treasury Yield Information
The 10-year Treasury yield jumped 2.48% to close at 4.381%, creeping closer to the critical 4.5% threshold that could begin to weigh more heavily on equities. While still under the danger zone, the uptick reflects a shift in market expectations for longer-term inflation and interest rates. Should yields continue their march higher, growth stocks may face renewed pressure, particularly if Fed commentary turns more hawkish during Friday’s speaking engagements.
Previous Day’s Forecast Analysis
Wednesday’s forecast anticipated a potential consolidation day with key levels at $555 and $565 defining the likely battleground. The model favored long trades above $555 and noted upside targets at $560 and $565, with potential for breakout continuation to $569 or $572. A failure at $558 was expected to lead toward $555 and lower. The strategy remained cautiously bullish while highlighting the importance of tight risk management and flexibility near major inflection zones. With the market in a call-dominated setup, the framework leaned toward upward moves, especially if key resistance levels gave way.
Market Performance vs. Forecast
Thursday’s action aligned well with the model’s expectations. SPY opened at $560.15, climbed steadily to a high of $570.31, and closed just under the $565 bias level at $564.92. This confirmed the validity of the projected $555 to $565 range, with SPY briefly peeking above resistance before fading late. Support at $559 and $562.25 held firm, providing clean entry zones for intraday long trades. The upward bias, driven by bullish macro headlines, provided strong directional signals, particularly for traders who took advantage of the breakout above $563.75 and targeted $566 and beyond.
Premarket Analysis Summary
In Thursday’s premarket analysis posted at 7:46 AM, SPY was trading near $567.01 with a projected consolidation day following an overnight rally sparked by US-UK tariff news. The model identified $566 as a likely pivot level and highlighted $562.25 as the key bias zone. Upside targets were $570 and $575, with downside supports marked at $559, $556.25, and $553.25. The bias leaned bullish, contingent on holding above $562.25, and favored long trades on dips or momentum rallies above key levels.
Validation of the Analysis
Thursday’s price action validated the premarket blueprint. SPY hovered around the $566 pivot early before briefly advancing toward the $570 resistance zone. The dip back below $566 found support just above $562.25, where buyers stepped in to resume upward pressure, perfectly aligning with the model’s suggestion to buy strong rallies at or above the bias level. The predicted churn zone between $562 and $559 never saw a full breakdown, and upside levels were nearly reached before the late-session pullback. The forecast proved actionable, offering traders dependable signals to execute successful long entries while avoiding false breakdowns.
Looking Ahead
Friday’s session brings minimal scheduled news beyond several Fed speakers throughout the day. Market participants will likely key in on any fresh signals from policymakers regarding rate direction or inflation commentary. With CPI and PPI data set for next week, Friday may serve as a transition day, with limited volatility unless headlines from the Fed or White House provide a new spark. Traders should stay focused on key levels as consolidation continues.
Market Sentiment and Key Levels
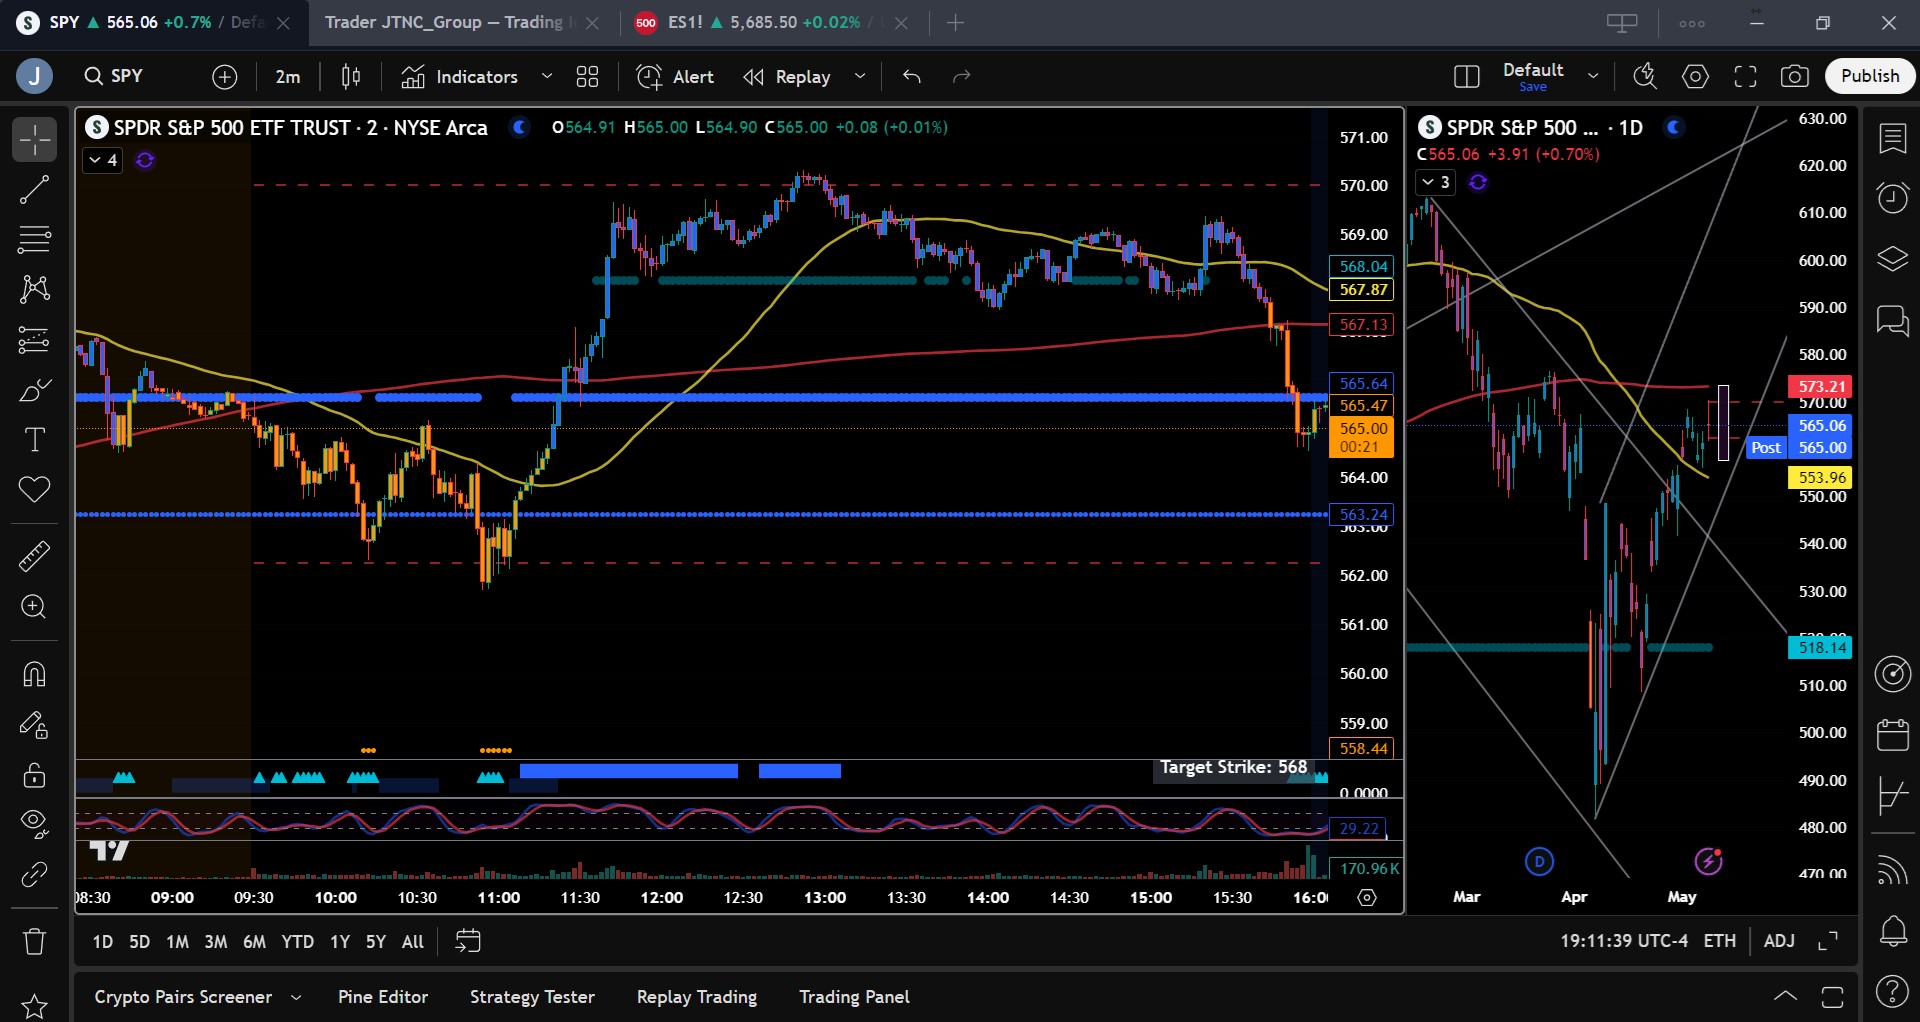
SPY closed at $565.06, placing it at critical resistance at $565. Sentiment remains cautiously bullish, with bulls holding the advantage following two strong sessions. Resistance is stacked at $567, $570, and $575, and a confirmed break above this zone could open the door toward $580 and higher. Support sits at $562, $560, and $558. A break below $560 could invite renewed selling pressure down to $555. Traders should watch Friday’s reaction around the $565 pivot closely, as it may determine whether bulls continue to press higher or yield to consolidation and profit-taking.
Expected Price Action
Our AI model forecasts a trading range of $560 to $571 for Friday, with the market still showing a bullish bias. This wide range suggests potential for directional movement following early consolidation. A hold above $565 could drive price action toward $570 and $575, while a failure to maintain that level could lead to a drop back toward $560 and $555. Momentum favors the bulls, but upward traction requires support from macro commentary or continued buying pressure. A stall at resistance might spark rotation back to safer levels, particularly if bond yields rise or Fed speakers strike a more hawkish tone. This is actionable intelligence. Expect sideways movement early, followed by a possible breakout attempt in either direction.
Trading Strategy
SPY remains in a well-defined channel with key resistance at $567, $570, and $575. Long trades are favored above $562, especially on dips that find support at or near $560. Targets for upside moves include $565 and $570, and breakout strength could drive the market toward $575. Traders should consider short entries on failed moves near resistance, particularly if SPY cannot sustain above $567. Downside targets include $560, $558, and $555. With the VIX closing lower at 22.48, volatility is easing but remains elevated enough to demand tight stop-losses near resistance and slightly wider ones at support. Position sizing should remain conservative, particularly ahead of Friday’s Fed speakers, with traders remaining agile around key levels to manage risk and capture opportunity.
Model’s Projected Range
The model’s maximum projected range for Friday is $557.75 to $573.50, with the Call side dominating in an expanding range suggesting consolidation with periods of trending behavior. There is no significant economic news scheduled for Friday, aside from a few Federal Reserve speakers throughout the day. After Thursday’s strong rally, which was driven by news that the US and UK have agreed to a trade deal, the market sold off in the final hour, ending the session near where it began; right back at the major pivot level of $565. Given this price action, we anticipate a relatively quiet session on Friday unless there are unexpected developments from the White House. Although the projected trading range has expanded slightly, it still trading within a well-defined range indicating continued sideways pressure rather than a strong continuation of the recent bullish trend. For several sessions, we have noted that as SPY approaches the $565–$585 zone, institutional traders are likely to reduce risk exposure and initiate protective strategies to lock in recent gains. While a move toward the 200-day moving average is still on the table, that level continues to be a major hurdle for bulls. The bulls retain the upper hand unless SPY begins probing key support levels lower down. A confirmed close above $585 would signal a reclaiming of the broader uptrend, while a break below $545 could trigger a move toward $535. If that level fails, a gap-fill move toward $530 becomes more probable, which would shift the momentum back in favor of the bears. Key technical levels to watch for Friday include resistance at $567, $570, $572, and $575, and support at $562, $560, $558, and $555. Resistance from $567 to $575 remains firm, while support below $560 has shown signs of weakening. Looking ahead, over the next 80 days, key macroeconomic forces such as tariffs, bond yields, and inflation are expected to remain dominant unless more concrete policy direction emerges from the White House. The VIX closed slightly lower at 22.48 and remains just below its pivot at 23. Moves above that level generally pressure equities, while dips below tend to provide support. With SPY settling at $565, bulls will likely aim to push the price toward $570 on Friday. However, SPY remains stuck in a range between $560 and $570, suggesting further consolidation is likely as the market builds energy for a potential breakout above $570. If $560 fails, a test of $555 becomes likely. A break below that could give the bears enough strength to challenge deeper support levels heading into the end of May. SPY is currently trading within a steep and newly formed bullish trend channel that began at the April lows. This channel is likely too steep to sustain, and we expect it to flatten out as price consolidates or moves lower to retest previous levels. Momentum still favors the bulls, but in such a volatile environment, it is important to remain nimble and ready for sudden shifts in market sentiment.
Market State Indicator (MSI) Forecast
Current Market State Overview:
The MSI is currently in a narrow Bullish Trending Market State, having rescaled higher following yesterday’s close on news of the UK trade deal. Overnight, SPY traded within a range of $562 to $570, with several hours of extended targets printing above the MSI, driving price up to $568 in the premarket. At the open, extended targets stopped printing, and price pulled back into the MSI bullish range. However, around 11 a.m., after the White House confirmed the UK trade deal, extended targets resumed, pushing SPY to the session high of $570.28. By 3 p.m., extended targets again ceased, and while SPY briefly rallied, it fell from $570 to close just above the key $565 pivot, an area that had flipped from support to resistance. This price action reflects market indecision and suggests the bullish trend may require further consolidation within the current range before making another attempt to break through the 200 DMA at $573. Current MSI resistance is at $565.60, with support at $563.25.
Key Levels and Market Movements:
On Wednesday, we noted: “Given the prevailing bullish trend, a break higher is more probable.” We also emphasized, “The prudent approach remains to trade with the trend,” and highlighted that, “Bulls may attempt to push SPY back above $565.” Finally, regarding the $565–$575 zone, we stated, “As price enters this zone, hedging activity will likely increase, acting as a drag on continued upside.” Armed with this actionable intelligence, we entered long at the open as price tested MSI support at $563, with the premarket low of $562.25 just below. A textbook failed breakdown setup emerged at $562.75 before 11 a.m., and we took the trade. Knowing the odds of SPY reaching MSI resistance were over 70%, we set our first target at $565.60, which hit quickly, allowing us to bank 70% of our position. When extended targets began printing, we knew we were aligned with the trend. We set our second target at the premarket resistance of $570, holding 30% of the position for this level. SPY reached $570 at 12:48 p.m., and we booked another 20%, thinking there might be room for a larger third target. However, a textbook failed breakout formed shortly after we took our second target. While it was tempting to go short, we held off as extended targets were still printing, and we never fight the herd. Still, the $562.75 to $570 move was a monster trade, so we closed the remaining 10% of our long and waited for a short opportunity at these extended levels. That came at 3:20 p.m. on a less-than-perfect failed breakout to $569. While we often pass on late-day trades, the setup was compelling. We entered short with a first target at MSI resistance-turned-support: $565.60. That level hit with about eight minutes left in the session so we took the entire position off which capped the day with a clean mean reversion short. Three for three, no heat, and high-quality trades, all driven by disciplined execution, a clear plan, and precise levels from the MSI. The MSI reveals who’s in control, when that control shifts, and where actionable levels lie—enabling sharp entries and exits. Paired with our framework, it keeps us aligned with dominant market forces. It continues to deliver with precision, helping us avoid traps, stay in sync with momentum, and capture profits confidently. We strongly recommend integrating the MSI into your trading toolkit. Combined with a structured plan, it becomes a powerful engine for long-term performance.
Trading Strategy Based on MSI:
Friday brings no economic news, so SPY is likely to remain rangebound. The MSI remains in a narrow Bullish Market State, but the absence of extended targets above signals a weakening of the current uptrend. We expect SPY to trade between $560 and $570 as it builds momentum for a potential breakout toward the 200 DMA. Bulls will continue to press for a move above $565 to gain traction. However, as price enters the $565–$570 zone, increased hedging activity may act as a drag on further upside. While bulls still control the tape, bears are watching closely for a break below $555, which could trigger a test of $550. That said, any significant bearish momentum would require a break below $545. Until then, failed breakdowns below $555 and failed breakouts above $565 are the more probable scenarios. This backdrop supports a two-way trading environment with opportunities on both sides. A break below $545 would open the door to $535, with a potential gap-fill toward $525. On the other hand, if bulls reclaim and hold above $565, a move toward the 200-day moving average at $572 becomes likely. Given the technical significance of the 200 DMA, expect more of a gradual grind than a sharp rally. Above $585, bulls would clearly reassert control and likely target new highs. For Friday, look for two-way trading opportunities from the range edges. Avoid trading when the MSI is in a Ranging State, and as always, trade what’s in front of you. The MSI continues to prove invaluable in this type of environment, offering real-time insight into structural shifts and momentum. When combined with the levels from the Premarket Report, it highlights high-probability targets and clean entry points, helping traders stay aligned with dominant flows and avoid costly missteps. If you’re not yet using the MSI and model levels, now is the time. Reach out to your rep as these tools can make a real difference in your trading.
Dealer Positioning Analysis
Summary of Current Dealer Positioning:
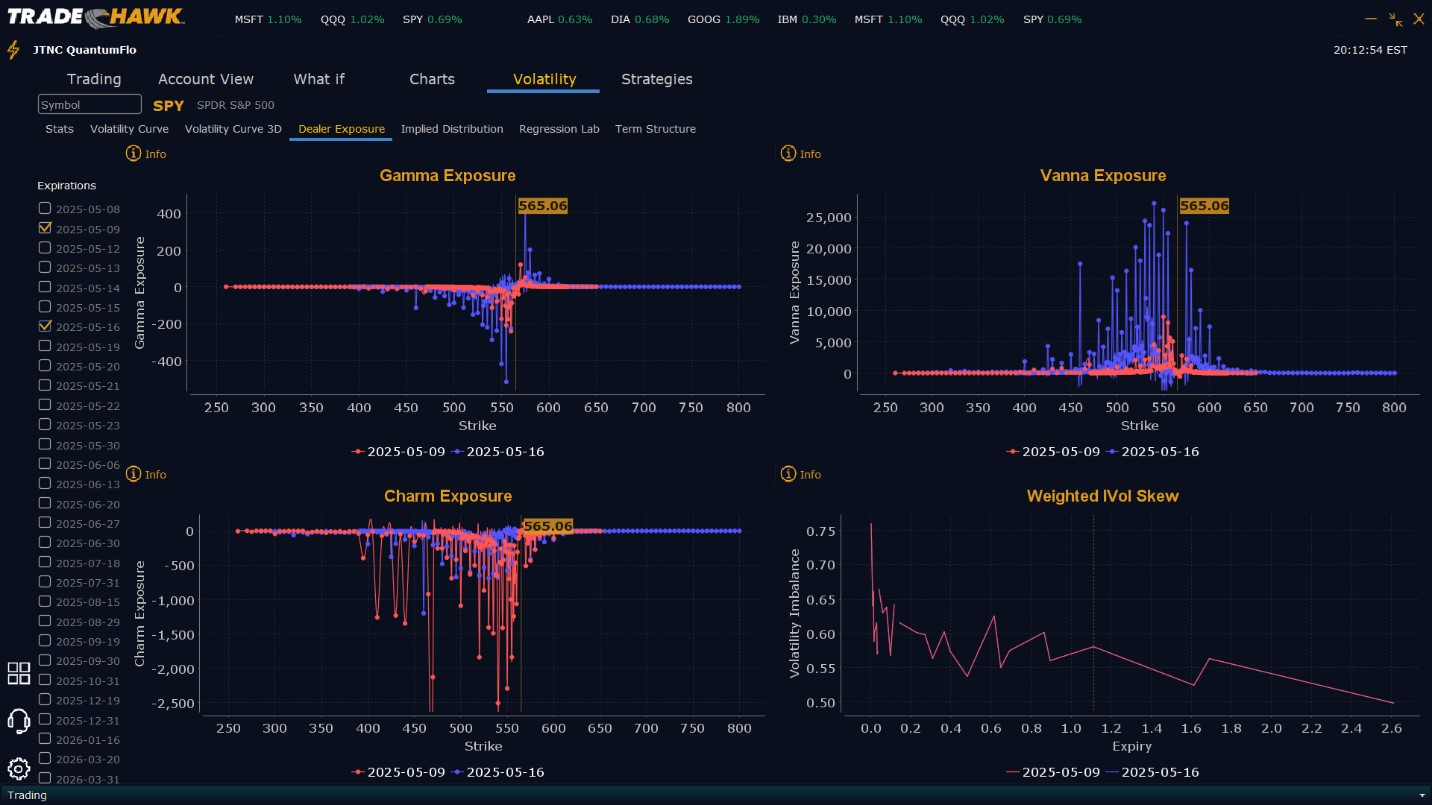
Dealers are selling $569 to $600 and higher strike Calls while also buying $566 to $568 Calls in very small size, indicating the Dealers’ desire to participate in any continuation of the bull rally on Friday. The upside appears limited to $570 for Friday. To the downside Dealers are buying $565 to $500 and lower strike Puts in a 3:1 ratio to the Calls they are selling/buying, implying a slightly bearish posture for Friday. Dealer positioning has changed from neutral to slightly bearish. Dealers seem ready for the market move both higher toward $570 or drop to $550.
Looking Ahead to Next Friday:
Dealers are selling $566 to $610 and higher strike Calls indicating the Dealer’s belief that the market is likely to drift higher than rally hard next week. Dealers appear to believe the peak for SPY for next week is $575. Options volume is quite high. To the downside, Dealers are buying $565 to $460 and lower strike Puts in a 4:1 ratio to the Calls they’re selling, reflecting a bearish outlook for next week. Dealers are heavily protected should $555 fail but are also open to prices reaching $575 next week. Dealer positioning is unchanged from bearish to bearish. We advise reviewing Dealer positioning daily for directional clues. These positions evolve quickly and tracking them is essential for staying ahead of shifting market sentiment.
Recommendation for Traders
SPY’s close at $565.06 puts it at the edge of a significant resistance zone. Long trades can be considered if SPY holds above $565 with conviction, with upside targets at $570 and $575. Look for continued strength on breakouts above $567. On the short side, failed breakouts near $570 or breakdowns below $562 could offer opportunities, targeting $560 and $555. With the VIX now at 22.48 and just below its pivot of 23, traders should remain alert for sharp reversals. Tight stops near resistance and slightly wider stops near support remain critical. Be prepared for elevated volatility during and after Friday’s Fed speeches. Make sure to review the premarket analysis before 9 AM ET to capture any shifts in model levels or Dealer Positioning.
Good luck and good trading!
