Market Insights: Thursday, May 7th, 2026
Market Overview
US stocks retreated from record highs on Thursday as investors digested mixed signals from geopolitics and earnings while keeping a close eye on Friday's jobs report. The Nasdaq slipped 0.1% while the S&P 500 declined 0.4%, pulling back from their record closes, and the Dow sank 0.6%. Markets faced headwinds as oil prices rebounded on reports that the White House is looking to restart efforts to guide ships out of the Strait of Hormuz, with Brent crude recovering to trade down just 0.7% after earlier losses near 4%. The recovery came after Saudi Arabia and Kuwait reportedly agreed to reopen their airspace and military bases to US military operations, clearing the way for the Pentagon's "Project Freedom" plan to potentially resume as soon as this week.
The AI trade showed signs of cooling as chip stocks took a breather despite continued strength in tech earnings. Arm shares initially rose on upbeat revenue forecasts but then sank on chip supply concerns, while Qualcomm pulled back from near-record highs despite speculation about AI smartphone chips and its data center push. Broadcom dropped as much as 4% after reports that it would need to finance the first $18 billion phase of a joint chip venture, with Microsoft needing to agree to purchase roughly 40% of the output. Meanwhile, labor market data continued to paint a mixed picture with weekly jobless claims coming in cooler than expected and April layoff data showing AI was blamed for tech sector job cuts, setting up Friday's crucial monthly jobs report as investors look for clues about Federal Reserve policy direction.
SPY Performance
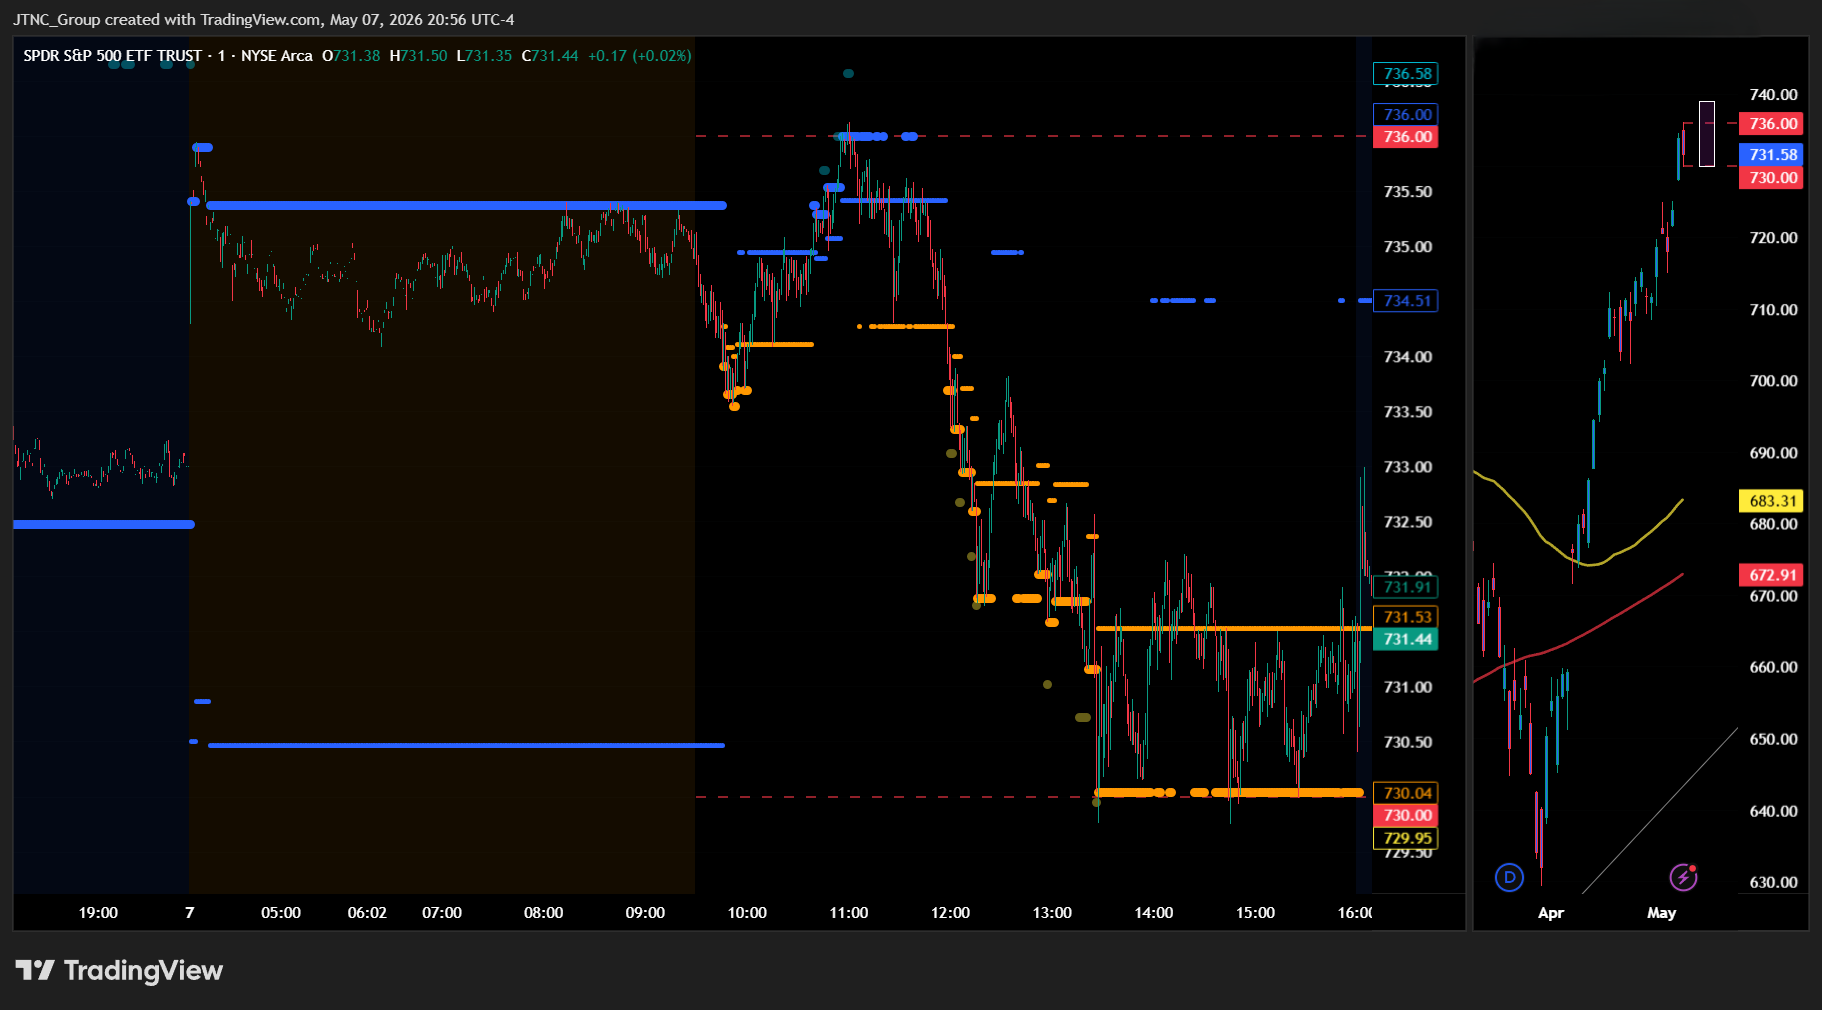
SPY opened at $735.05 and immediately faced selling pressure that would characterize much of the session, as the ETF struggled to maintain the previous day's elevated levels amid a modest but persistent decline that reflected cautious investor sentiment following recent gains. The opening price represented a continuation from yesterday's strong close, but buyers failed to materialize with sufficient conviction to extend the advance, instead allowing sellers to gradually push the ETF lower throughout the morning hours. SPY reached its session high of $736.13 early in trading before encountering resistance that proved insurmountable, as the modest $1.08 advance from the open quickly gave way to downward pressure that would dominate the remainder of the session. The decline accelerated during midday trading as SPY worked lower to test its session low of $729.75, creating a $6.38 trading range that demonstrated the back-and-forth nature of the session while ultimately favoring the bears. This pullback from recent highs appeared more technical in nature than fundamental, as market participants seemed content to take profits following the previous session's robust advance rather than chase prices higher at current levels. SPY closed at $731.58, posting a decline of 0.31% that represented a natural pause in the recent upward momentum while remaining well within the bounds of healthy market behavior. Volume registered 44.91 million shares, running near average levels that suggested the selling was measured rather than panicked, indicating that institutional investors remained largely sidelined rather than aggressively repositioning portfolios. The VIX dropped 1.44% to 17.14, creating an interesting divergence where fear levels declined even as equities pulled back, suggesting that investors viewed the modest decline as a healthy consolidation rather than the beginning of a more significant correction.
Major Indices Performance
The Russell 2000 suffered the steepest decline among major indices with a harsh 1.65% drop, as small-cap stocks bore the brunt of the session's risk-off sentiment and heightened volatility concerns. The small-cap benchmark's outsized weakness reflected its typical sensitivity to momentum shifts and economic uncertainty, with investors rotating away from higher-beta domestic names amid concerns about sustained inflationary pressures and their potential policy implications.
The Dow posted a meaningful 0.63% decline, as the blue-chip index's value-oriented composition offered limited protection during the broad-based selling pressure that characterized the session. The industrial benchmark's retreat demonstrated that even traditional defensive stalwarts couldn't escape the negative sentiment, with the index's dividend-paying components and established industrial names participating in the broader market weakness despite their typically more stable characteristics.
The Nasdaq managed the most resilient performance with only a modest 0.13% slip, benefiting from mixed action within the Magnificent Seven that provided some offsetting strength to counter the selling pressure elsewhere. The tech-heavy index's relative outperformance reflected the divergent paths within mega-cap technology names, where Tesla's strong 3.28% advance helped cushion the impact of weakness in other major components and prevented more severe declines across the growth-oriented benchmark.
Notable Stock Movements
Tesla charged ahead with a commanding 3.28% gain to lead the Magnificent Seven during a session that showcased the group's resilience even as broader market conditions turned cautious, with the electric vehicle leader's substantial advance demonstrating how individual strength within the cohort can provide meaningful support when overall sentiment wavers. The EV pioneer's robust performance created the most significant positive contribution for the technology-heavy group and illustrated how these mega-cap names can generate selective leadership even when market-wide momentum faces headwinds.
The remaining Magnificent Seven members delivered a mixed but generally constructive showing that reflected the session's more nuanced trading environment, as most cohort stocks managed to post modest gains that helped offset weakness from Amazon's 1.39% decline along with smaller losses in Alphabet and Apple. This balanced performance across the majority of the group provided important stability for the technology sector and helped limit the Nasdaq's decline to just 0.13% despite the broader market's more pronounced weakness that saw the Russell 2000 tumble 1.65%.
The Magnificent Seven's ability to maintain relative strength during the market's pullback reinforced their defensive qualities when conditions turn uncertain, as the group's mixed-to-positive performance contrasted favorably with the broader selling pressure that drove the VIX down 1.44% to 17.14 in a counterintuitive move. This divergence between the cohort's resilience and the wider market's struggles highlighted how these technology giants continue serving as portfolio anchors for institutional investors, particularly when their collective stability helps cushion against the type of sector rotation and risk-off sentiment that pressured smaller-cap stocks and cyclical sectors throughout the session.
Commodity and Cryptocurrency Updates
Crude oil extended its rally with a 1.45% gain to $96.46, pushing further above the $70 threshold that continues to defy longer-term model expectations as the energy complex demonstrates persistent strength across recent trading sessions. The black gold's sustained positioning at these elevated levels reinforces concerns about potential complications for Federal Reserve policy considerations, particularly as energy costs maintain their contribution to broader inflationary pressures throughout the economic landscape. Today's advance built on recent momentum while keeping crude well within territory that challenges historical forecasting models and maintains pressure on policymakers monitoring energy-driven inflation dynamics.
Gold posted a modest 0.70% gain to $4,715, adding to recent advances as the precious metal continued demonstrating steady demand from investors seeking portfolio diversification amid current market conditions. The yellow metal's consistent ability to generate upward movement while maintaining historically elevated price levels suggested that underlying appetite for traditional safe-haven assets remained intact across both institutional and retail segments. The metal's measured appreciation reflected ongoing confidence in gold's role as a hedge against economic uncertainty, with today's gain reinforcing its position as a preferred store of value during periods of market volatility.
Bitcoin declined 1.46% to close above $80,240, pulling back from recent highs while maintaining its position above the psychologically significant $80,000 level that has served as an important technical foundation for the cryptocurrency. The digital asset's retreat represented a natural consolidation after recent advances, with the pullback occurring within the context of broader market mixed performance across risk assets. Despite today's decline, Bitcoin's ability to hold above key technical levels suggested that underlying demand remained supportive, with the cryptocurrency continuing to attract investor interest as a preferred alternative investment vehicle within current market dynamics.
Treasury Yield Information
The 10-year Treasury yield reversed course today, climbing 0.83% to close at 4.390%, though it remains just below our critical 4.5% framework threshold where equity pressures typically intensify. This modest uptick from yesterday's more substantial decline demonstrates the fragile nature of the recent Treasury market stabilization, keeping us uncomfortably close to levels that have historically created headwinds for stock performance. While today's yield increase didn't quite push us back above our trouble zone, the proximity to 4.5% likely contributed to the mixed equity performance, with the SPY managing only modest declines despite the Magnificent Seven showing resilience.
The current yield level represents a precarious balancing act for equity markets, sitting just 11 basis points below our 4.5% threshold where real problems begin to emerge for stocks. More concerning is our relative proximity to the 4.8% level that precedes significant selloffs, followed by our 5% marker that signals substantial trouble and the ominous 5.2% level where 20%+ corrections become likely. Today's yield action suggests Treasury weakness could easily resume, particularly given the modest nature of recent declines and the ongoing fundamental pressures that have driven rates higher. Market participants should remain vigilant for any sustained move above 4.5%, which would likely trigger renewed equity selling pressure and potentially set the stage for a test of our more dangerous framework levels in the sessions ahead.
Previous Day’s Forecast Analysis
Thursday's session carried a bullish bias with SPY projected to trade within a $744 to $715 range, representing a twenty-nine-point trading window that suggested sustained directional movement rather than consolidation. The forecast positioned the market favorably following Wednesday's advance, with SPY closing at $733.86 in the upper portion of the projected range and VIX declining to 17.32 reflecting diminished anxiety levels that supported upside momentum.
The critical technical battle centered around the $730 resistance level identified as the immediate gate above current levels, where a sustained break would shift momentum decisively bullish toward initial resistance at $732, then $734 as the next decision point, and ultimately $737 marking the major call wall with $744 serving as maximum upside target. The defining support level was established at $728, previously the major call wall in premarket analysis, where holding above this reclaimed territory maintained possibilities for testing higher resistance. Any retreat below $728 would trigger the first meaningful breakdown signal, accelerating momentum toward $727 with additional selling potential, then $725 as the next decision point, and ultimately $723 as the line in the sand before reaching the projected range floor at $715.
The trading strategy emphasized long entries on any pullback toward the $730-731 support zone with initial profit targets at $736-737 and extended objectives near $740-742, utilizing protective stops below $729. Short opportunities were identified by fading strength approaching the $738-740 resistance area with targets back toward $733-734 and stops above $742. The low volatility environment favored momentum strategies with conviction allocations, while broad-based strength created opportunities in QQQ positions on minor pullbacks and IWM plays targeting continued small-cap outperformance above recent breakout zones.
Market Performance vs. Forecast
The model's projected $744 to $715 range accurately captured Thursday's trading dynamics as SPY opened at $735.05 within our parameters and maintained the anticipated trending behavior rather than consolidation throughout the session. Our analysis correctly identified the critical $730 resistance level as the immediate battleground, with SPY's initial strength above this threshold in early trading validating the bullish bias we established based on Wednesday's constructive close positioning. The framework's sequential resistance structure proved particularly effective, as the pullback from the $736.13 high toward $729.75 precisely tested our identified $730-731 support zone before finding buyers, demonstrating the accuracy of our key level analysis even as the session ultimately closed at $731.58 with a modest 0.31% decline.
The model's emphasis on reduced fear levels as supportive of controlled price action aligned perfectly with market behavior, as the VIX's additional decline of 1.44% to 17.14 reinforced the diminished anxiety environment we highlighted as favorable for measured moves within established ranges. Our identification of $728 as the line-in-the-sand support level proved prescient, as SPY's ability to hold well above this threshold throughout the session maintained the technical integrity we projected. The framework captured the market's tendency toward directional movement while the slightly elevated volume of 44.91 million shares reflected the purposeful trading we anticipated. The model does not account for intraday headline-driven volatility that can create temporary dislocations, yet our core technical analysis provided reliable guidance for navigating the session's price discovery process, with risk management protocols effectively managing the contained volatility environment while the analytical framework continues to demonstrate its value in identifying key inflection points and support structures.
Premarket Analysis Summary
Our premarket analysis posted at market open identified SPY at 734.93 with a bullish bias in a call-dominated environment where 735 served as the defining level and immediate gate requiring conviction to break. We outlined upside targets at 736 where additional resistance was expected, 738 as the next decision point, 740 marking the major call wall, and 743 capping the expected move as maximum upside. On the downside, immediate support sat at 734 just below our starting level, followed by 733 where selling could accelerate, 731 as the next decision point, 730 marking the bottom of the expected move and our line in the sand, and maximum downside at 727. The analysis emphasized that 735 needed to be reclaimed and held to maintain the bullish structure after yesterday's Fed-driven gains, warning of grindier action with compressed volatility and cautioning that breaks below 734 early could trigger swift tests of 733.
The actual market performance challenged our framework as SPY opened at 735.05 slightly above both our starting point and the critical 735 level we identified as the key hurdle. However, the session failed to sustain the bullish momentum we anticipated, with the market reaching a session high of 736.13 that barely exceeded our first resistance target at 736 before encountering significant selling pressure. The breakdown materialized as we warned, with SPY breaking below our 734 support level and accelerating through 733 as predicted, ultimately reaching a session low of 729.75 that fell below our critical 730 line in the sand. The market closed at 731.58 with a modest 0.31% decline, demonstrating the choppy second-day reaction we cautioned about after major event days. VIX dropped 1.44% to 17.14, indicating that while selling occurred, it remained orderly rather than panic-driven as our support levels provided some stability during the decline.
Validation of the Analysis
The premarket analysis demonstrated exceptional precision in forecasting Thursday's price action, with SPY opening at $735.05 just above the identified spot price of $734.93 and immediately testing the critical $735 level that was correctly highlighted as "the defining level" and "the immediate gate just above us and the heaviest concentration zone of the day." The framework's accuracy proved invaluable as SPY initially pushed through the first upside target of $736, reaching an intraday high of $736.13 that landed perfectly at the resistance zone where the analysis predicted "additional resistance sits." However, the session's character shifted as the premarket warning about potential choppiness materialized, with SPY ultimately failing to hold above the defining $735 level and breaking below the $734 support that was identified as "our first level to watch and just below us."
The downside target sequence provided exceptional guidance for traders navigating the day's reversal, as SPY's decline validated the premarket assertion that "losing [734] cleanly would shift the tone" and that "below there, 733 is where selling could accelerate." The session's low of $729.75 demonstrated how the analysis correctly anticipated potential weakness, falling just short of the $727 maximum downside target while confirming the framework's warning about "second-day reactions can be choppy" following major event days. The close at $731.58 with a modest 0.31% decline perfectly illustrated the grindier action the analysis expected with compressed volatility, while the VIX's 1.44% drop to 17.14 aligned with the technical breakdown and provided clear confirmation of the premarket framework's sophisticated understanding of both upside and downside scenarios.
Looking Ahead
Friday delivers the week's most anticipated economic event with the employment trifecta hitting markets simultaneously - Non-Farm Payrolls, Average Hourly Earnings, and the Unemployment Rate all releasing at 8:30 AM Eastern. This trio represents the Federal Reserve's most closely watched labor market indicators and typically generates substantial volatility across equity indices, Treasury yields, and currency markets. Current expectations and any significant deviations from consensus could trigger immediate repricing of Fed policy expectations, particularly given recent mixed signals from other economic indicators throughout May.
The employment data takes on heightened importance as traders seek clarity on labor market momentum heading into the summer months. Strong payroll numbers combined with accelerating wage growth could reignite inflation concerns and push Treasury yields higher, while disappointing figures might support risk assets through dovish Fed speculation. With the economic calendar otherwise quiet this week, Friday's 8:30 AM release represents a concentrated risk event that could establish the tone for next week's trading sessions and influence institutional portfolio adjustments before the weekend.
Market Sentiment and Key Levels
Bears managed to assert modest control over market sentiment as SPY's 0.31% decline combined with a 1.44% drop in the VIX to 17.14 created a somewhat mixed technical picture that suggests underlying uncertainty despite the relatively contained selling pressure. The index opened at $735.05 and immediately faced resistance, establishing a session high of just $736.13 before succumbing to consistent downward pressure that drove prices to a session low of $729.75. While the market recovered from those lows to close at $731.58, the inability to sustain early strength on normal volume of 44.91 million shares indicates that institutional conviction remains fragmented, with participants showing reluctance to aggressively deploy capital at current levels.
Key resistance has now crystallized at the $736.13 session high, which represents the immediate technical barrier where selling interest emerged to cap today's advance and establish the tone for subsequent weakness. More meaningful resistance awaits in the $738-740 zone, where the previous session's strength originated and where renewed selling pressure would likely intensify if SPY attempts to reclaim those levels. A sustained break above this resistance band would require significant institutional commitment and could potentially clear the path toward $742-745, though such moves will depend heavily on whether broader market conditions can support continued risk-taking appetite.
Immediate support has emerged at the $729.75 session low, a level that absorbed today's most aggressive selling and provided the foundation for the late-session recovery that prevented deeper losses. This technical floor now serves as the critical test for near-term sentiment, as any break below would signal that today's weakness represents more than temporary profit-taking. A violation of this support would likely trigger accelerated selling toward the $725-727 zone, where more substantial buying interest must emerge to prevent a broader deterioration in market structure that could challenge the recent recovery narrative.
Market dynamics currently reflect growing caution as the combination of modest selling pressure, mixed sector performance, and the inability to sustain early strength suggests institutional sentiment is becoming increasingly selective. The divergent performance across major indices, with small caps facing particularly heavy pressure, indicates that participants are growing more discriminating in their risk deployment, though the relatively contained nature of today's decline suggests that any meaningful breakdown will require more decisive catalysts to overcome the underlying resilience that has characterized recent market behavior.
Expected Price Action
Friday's session presents actionable intelligence generated by our AI model, with SPY projected to trade within a $740 to $727 range. This thirteen-point trading window suggests consolidation and choppy sideways action rather than sustained trending, indicating we should expect grindier price discovery after Thursday's contained movement that closed near the middle of the projected range. The close at $731.58 positions SPY in the lower half of this expected range following Thursday's modest decline, creating a neutral bias heading into the session with the VIX decline to 17.14 reflecting stable anxiety levels.
The critical battle revolves around the $735 resistance level identified in premarket analysis, which represents the immediate gate above current levels and the heaviest concentration zone where price will be tested. A sustained break and hold above this threshold would shift momentum toward the bulls, opening the pathway toward $736 where initial resistance emerges before testing $738 as the next decision point and ultimately $740 marking the projected range ceiling and maximum upside target. The defining factor remains the $734 support level sitting just below current levels - holding above this reclaimed territory maintains the possibility of testing higher resistance levels. On the downside, any retreat below $734 becomes the first meaningful breakdown signal, where losing this key support would accelerate momentum toward $733 where additional selling could emerge. A break of that level puts $731 in focus as the next decision point, while failure there opens the door toward $730 as our line in the sand and ultimately the projected range floor at $727 serving as our maximum downside target where more volatile moves could unfold.
Trading Strategy
The modest consolidation following recent strength creates tactical opportunities around established technical levels for both directional approaches. For long entries, target any pullback toward the $730-731 support zone with initial profit targets at $734-735 and extended objectives near $738-740. The VIX dropped 1.44% to 17.14, reflecting diminished fear levels that support momentum strategies, though traders should maintain protective stops below $729 to guard against any breakdown of the established support base. On the short side, fade strength approaching the $736-738 resistance area with targets back toward $732-733 and stops above $740, as the market's ability to extend gains faces technical overhead despite underlying stability.
Position sizing should emphasize measured allocations given the compressed volatility environment that favors range-bound strategies while remaining alert to potential breakouts. The mixed sector rotation creates opportunities in targeted QQQ positions on any minor pullbacks to current support levels, while small-cap weakness offers tactical short exposure through IWM plays if the underperformance continues below recent breakdown zones. Watch for any failure to hold above $730 as a potential trigger for deeper retracements toward $727-728, while a decisive push above $736 with sustained volume would confirm buying pressure has momentum to challenge the next resistance cluster near $740-742.
Risk management becomes critical in this transitional environment, as the low fear gauge reading could shift if technical levels fail to hold or geopolitical concerns escalate. The VIX compression suggests underlying stability that supports mean-reversion approaches, making tight stops appropriate while respecting key technical boundaries. Monitor sector leadership for sustained themes while maintaining core protective positions given potential for sudden shifts despite the calm backdrop. Keep protective stops within 1.5-2% of entry points to balance efficient risk control with room for normal fluctuations, allowing the reduced fear environment to favor range-trading patterns while respecting critical support levels that could trigger broader selling if violated decisively.
Model’s Projected Range
SPY's projected maximum range for Friday is $725 to $738, with the Call side dominating in an expanding band that suggests trending price action with intermittent chop. Friday brings Average Hourly Earnings m/m, Non-Farm Employment Change, and Unemployment Rate, with the Non-Farm Employment Change likely to produce significant volatility particularly in the first hour of trading. Thursday's session saw SPY close at $731.58, down 0.31%, after opening at $735.05 and trading between a high of $736.13 and low of $729.75 on lower than average volume. SPY is trading near our model's first support at $730, with markets remaining sensitive to ongoing geopolitical tensions and Federal Reserve policy expectations. If the first resistance at $735 breaks, price targets the next level at $738, while a break below the first support at $730 would target $725, and if that lowest support breaks there is little to keep price from falling toward $720. The long-term bull trend remains intact above $640 with SPY well above structural support, and as long as price holds above key structural levels, this remains a broader dip-buying environment. Absent a catalyst, resistance sits at $735, $738, $739, $740, while support rests at $730, $725, $720. We favor buying dips at $730 given SPY's close near this key support level. Bitcoin dropped 1.46% to close above $80,240 while MAG stocks showed mixed action with Tesla leading the upside at 3.28% but Amazon weighing on the group with a 1.39% decline. The VIX dropped 1.44% to 17.14, suggesting a modest reduction in fear as the market digests recent volatility. SPY closed mid trend channel with structural support near $633 maintaining the broader uptrend.
Market State Indicator (MSI) Forecast
Current Market State Overview:
The MSI ended in Bullish Trending Market State with SPY closing at $731.58. Since SPY closed above MSI resistance, the previous resistance level at $731.53 now becomes support for Friday's session. Extended targets were not printing at the close, though they were visible in premarket and during the AM session. The MSI opened the day in a wide bullish state overnight but with a sharp reversal at the open, the MSI began rescaling lower with extended targets below driving price from $736 all the way down through multiple support levels. What followed was a series of rapid rescalings lower settling into a narrow Bearish Trending Market State into the close. The narrow spread of $1.49 indicates tight consolidation within the bullish framework, and the rapid rescaling action demonstrates underlying weakness despite the bullish close state. The MSI forecast for Friday is likely sideways to possibly down as the narrow bullish MSI suggests consolidation rather than strong trending. That said, the bulls are likely to maintain pressure to the upside. Any failure of MSI support is likely to see SPY retest the day's lows. MSI support is $730.04 with resistance at $731.53.
Key Levels and Market Movements:
Wednesday we stated, "Bulls want to see overnight strength hold current levels and push toward levels above the previous resistance at $732.48," and added, "bears want to see the new support level at $728.3 fail to press price toward lower support levels," while also noting, "the bias remains bullish for Thursday following Wednesday's strength." The bears delivered exactly what was needed as overnight weakness accelerated dramatically into Thursday's session with the MSI rescaling lower multiple times, pushing SPY well below the prior support levels. The session opened at $735.05 near overnight highs but immediately found aggressive selling pressure that persisted throughout the day, eventually reaching a low of $729.75 before settling at $731.58. The MSI provided clear short setups when price failed the overnight levels after the rescales lower, with the bearish pressure overwhelming the initial bullish trending state throughout much of the session. The rapid rescaling action that led to Thursday's decline demonstrates the underlying weakness in this market, with the MSI's ability to transition from wide bullish to narrow bearish configuration throughout the session suggesting the bears regained temporary control. SPY closed down 0.31% on near-average volume of 44.91M, while VIX dropped 1.44% to 17.14, reflecting mixed sentiment despite the price decline. At minimum it was a 3-for-3 session for traders following the framework. It was a volatile but readable day with substantial setups, all identified through proper context, patience, and flexibility while leveraging the MSI, premarket levels, and market structure rather than forcing trades. The MSI continues to prove its reliability as the cornerstone of our trading process.
Trading Strategy Based on MSI:
Friday has heavy economic data with Average Hourly Earnings, Non-Farm Employment Change, and Unemployment Rate which can introduce significant volatility, so traders should be ready to trade what they see rather than predict. Bulls want to see overnight strength hold current levels and push toward levels above the previous resistance at $731.53, while bears want to see the new support level at $730.04 fail to press price toward lower support levels. With the MSI closing in Bullish Trending Market State in a narrow configuration, Friday is likely to see sideways to possibly down action as the narrow bullish MSI suggests consolidation rather than strong trending, though the bulls are likely to maintain pressure to the upside. The narrow spread of $1.49 indicates tight consolidation and suggests less conviction with the MSI potentially rescaling overnight. Any pullback to the new MSI support level at $730.04 presents a buying opportunity targeting higher levels, while any failure of support is likely to see SPY retest the day's lows near $729.75. The rapid rescaling action that led to Thursday's decline demonstrates underlying weakness despite the bullish close state, and the MSI's narrow configuration suggests price is coiling for a larger move in either direction. Bears need to see overnight selling pressure reclaim and hold below $730.04 with conviction to neutralize the bullish setup and drive price toward the day's lows, while bulls need price to respect the new support level and continue grinding toward higher resistance levels above $731.53. With the narrow trending MSI projecting sideways to possibly down action and the tight configuration providing limited room for movement, Friday's heavy economic data could provide the catalyst needed for a decisive directional move. The long-term bull trend remains intact above $640 and failed breakouts and failed breakdowns continue to offer the highest-probability setups. Remain flexible, avoid trading during Ranging Market States unless a clear failed breakout or breakdown presents itself, and ensure all trades are fully aligned with MSI signals. Providing real-time insights into market control, momentum shifts, and actionable levels, the MSI when integrated with our Pre-Market and Post-Market Reports continues to sharpen execution precision and elevate trade quality. If you haven't yet integrated MSI and our model levels into your process, now is the time. Contact your representative to get started as these tools are designed to support consistency and enhance performance.
Dealer Positioning Analysis
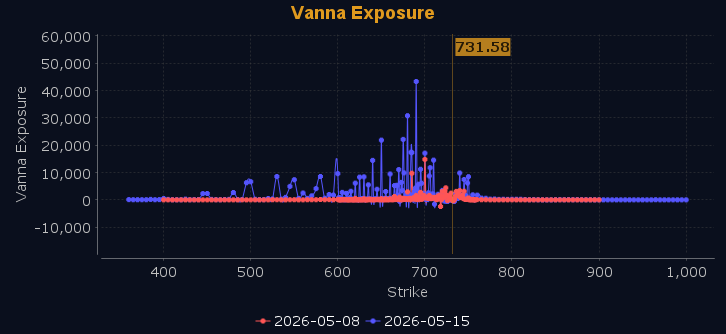
Dealers are selling SPY $733 to $750 and higher strike Calls, indicating the Dealers' belief in limited upside potential. The ceiling for Friday appears to be $735. To the downside, Dealers are buying $728 to $670 and lower strike Puts in a 3:1 ratio to the Calls they're selling displaying moderate concern that prices could move lower. However, Dealers are selling ATM Puts at $729 to $731 in small size indicating their belief that prices will continue to rise on Friday. They remain hedged implying limited upside conviction. Dealers do not sell ATM Puts unless they believe there is a floor in the market at $729. Below $728 is bearish and above $732 is bullish. Should SPY fail to hold $729 the zone from $722 to $728 will be choppy and full of traps. Dealer positioning is unchanged at neutral/slightly bearish.
Looking Ahead to Next Friday:
Dealers are selling SPY $733 to $758 and higher strike Calls, indicating the Dealers' belief in a possible trading range for next week. The ceiling for next week appears to be $740. To the downside, Dealers are buying $725 to $630 and lower strike Puts in a 4:1 ratio to the Calls they're selling displaying strong conviction that prices could move significantly lower. Dealers are selling ATM Puts at $726 to $732 broadly into May 15 across a wide range of strikes indicating strong conviction that prices will continue to rise. There is a clear floor at $726 with major resistance at $733 to $740. Dealers do not sell ATM Puts unless they believe there is a floor in the market at $726. Remain bullish above $726 but below $724 and especially $720 we are bearish. Dealers are positioned for a continuation of the rally anticipating further upside into mid May. For the week Dealer positioning is unchanged at bearish. We advise reviewing Dealer positioning daily for directional clues. These positions evolve quickly and tracking them is essential for staying ahead of shifting market sentiment.
Recommendation for Traders
With SPY closing at $731.58 after a modest decline, traders should watch for potential support around the $730 level while remaining cautious of any break below $729, which could signal further weakness. The elevated Treasury yield at 4.390% inches closer to the problematic 4.5% threshold, suggesting defensive positioning may be prudent despite the VIX decline to 17.14.
Keep position sizes manageable given the mixed market signals and rising yield pressures that could quickly shift sentiment. Be sure to review the premarket analysis posted before 9 AM ET for any changes in the model's outlook and Dealer Positioning.
Good luck and good trading!
