Market Insights: Monday, May 4th, 2026
Market Overview
US stocks stumbled on Monday as escalating tensions between the US and Iran in the crucial Strait of Hormuz overshadowed last week's strong momentum and solid economic data. The Dow led the decline with a sharp 1.1% drop, while the S&P 500 fell 0.4% and the Nasdaq managed to limit losses to just 0.2%. Markets turned sour after reports emerged that Iranian strikes hit a US patrol boat and forced a US warship to retreat from the strategic waterway, though the US denied these claims. However, the UAE confirmed that an oil carrier belonging to Abu Dhabi National Oil Company was targeted and that the Fujairah petroleum export complex was struck by Iranian forces, adding credibility to the escalation concerns.
The geopolitical flare-up sent oil prices soaring, with Brent crude futures jumping more than 5% to near $114 per barrel and WTI crude crossing $105 as investors priced in supply disruption risks from the world's most important oil chokepoint. This comes as President Trump launched "Project Freedom" to help trapped ships exit the Gulf waterway, prompting Iran to warn of retaliation against any US interference. Meanwhile, the 30-year Treasury yield spiked 6 basis points to 5.03% in its biggest single-day move since March, crossing back above the critical 5% threshold that has historically spelled trouble for stocks. The bond market pressure coincided with Fed leadership transition uncertainty as Kevin Warsh awaits confirmation to replace Jerome Powell, adding another layer of complexity to an already volatile situation.
SPY Performance
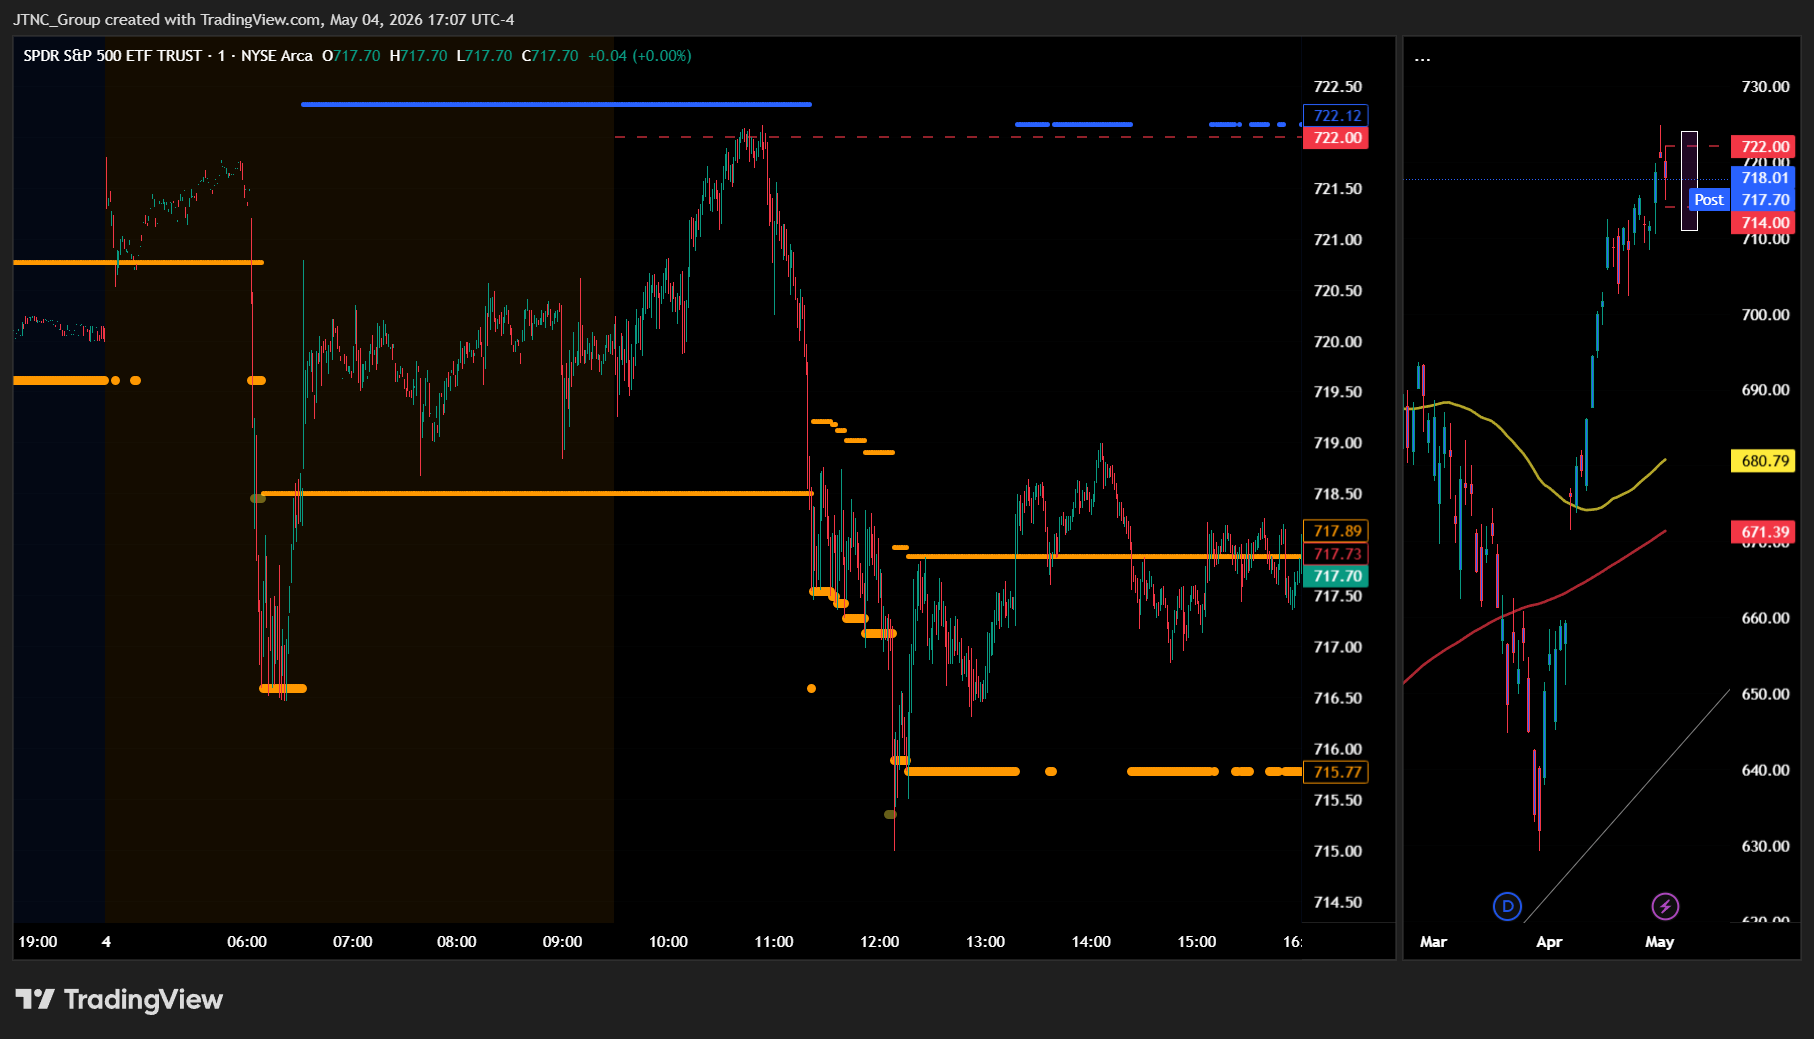
SPY opened at $720.07 but faced immediate selling pressure that prevented the ETF from building on previous session gains, as early weakness established the tone for a session marked by persistent distribution and growing risk aversion. The decline accelerated through the morning hours as SPY broke below key support levels, ultimately reaching a session low of $714.99 that represented a significant breach of recent technical floors and suggested that institutional selling had intensified. Despite attempts at recovery during midday trading, the ETF struggled to regain meaningful ground and managed only a modest bounce to its session high of $722.12 before sellers reasserted control. The inability to hold higher levels throughout the session demonstrated that buyers lacked conviction at current prices, with profit-taking from recent gains combining with fresh bearish positioning to create sustained downward pressure. SPY closed at $718.01, recording a 0.37% decline that broke the recent string of advances and marked a clear shift in short-term momentum as the ETF gave back a portion of its recent rally. Volume expanded to 48.02 million shares, reaching near-average levels as the selling attracted broader participation and suggested more than just surface-level profit-taking was occurring. The $7.13 trading range captured elevated volatility as SPY worked through multiple support levels during the session, creating the type of choppy action that often signals changing sentiment and potential trend exhaustion. Reflecting the equity weakness, the VIX surged 7.65% to 18.29, confirming that fear levels spiked as investors grew increasingly concerned about near-term market stability and risk appetite showed signs of diminishing.
Major Indices Performance
The Nasdaq posted the most resilient performance among major indices with a modest 0.19% decline, demonstrating relative strength even as broader market sentiment turned cautious. The tech-heavy benchmark's ability to limit losses reflected continued investor interest in technology names, with the Magnificent Seven stocks showing mostly positive momentum that helped cushion the index's retreat. The relatively shallow pullback suggested underlying buying interest in growth-oriented sectors remained intact despite the day's overall negative tone.
The Russell 2000 followed with a 0.6% decrease, as small-cap stocks faced pressure from the elevated VIX environment and risk-off sentiment that typically weighs more heavily on higher-beta names. The small-cap benchmark's decline marked a reversal from recent strength, with domestically-focused companies losing some of their appeal as market volatility increased and investors sought safer positioning heading into year-end.
The Dow suffered the steepest losses with a 1.13% drop, as the blue-chip index bore the brunt of broad-based selling pressure across industrial and traditional value sectors. The industrial benchmark's sharp underperformance reflected investor concerns about economic sensitivity among its large-cap components, with the index's price-weighted structure amplifying the impact of declines in higher-priced shares that dragged the average significantly lower.
Notable Stock Movements
Amazon powered the Magnificent Seven higher with a commanding 1.41% advance that provided crucial support for technology stocks amid broader market weakness, as the e-commerce giant's strength helped offset significant pressure elsewhere in the cohort and demonstrated the group's ability to maintain relative resilience even when market conditions turn challenging. The retail and cloud computing leader's robust performance stood out particularly given the session's mixed tone across major indices and served as a stabilizing force that prevented more severe deterioration in growth-oriented investments.
Apple created the most substantial headwind within the group, declining 1.18% in a move that weighed heavily on the cohort's overall performance and contributed to the technology sector's struggles against the backdrop of rising Treasury yields and elevated volatility. Microsoft and Alphabet also finished in negative territory among the notable laggards, while the remaining members posted modest gains that helped cushion the group's net performance but couldn't fully offset the weakness from the underperformers.
The Magnificent Seven's mixed showing reflected the broader market's defensive posture that drove the VIX sharply higher by 7.65% to 18.29, as the group's inability to deliver uniform leadership highlighted growing investor caution about high-multiple growth stocks in an environment of increasing bond yields and market uncertainty. This cohort's lackluster collective performance underscored how these influential mega-caps can struggle to provide their typical market support when conditions favor more defensive positioning, particularly as their mixed results contributed to the Nasdaq's modest 0.19% decline despite Amazon's notable strength.
Commodity and Cryptocurrency Updates
Crude oil surged 3.14% to $105.14, extending its rally well above the $70 threshold and defying longer-term model expectations as energy markets continued their persistent upward momentum. The black gold's sustained strength above $70 creates increasingly complex challenges for Federal Reserve policy, particularly as these elevated energy prices risk contributing to broader inflationary pressures that could complicate the central bank's delicate balancing act. Today's significant advance reinforced concerns about supply constraints and geopolitical tensions that continue to underpin oil markets, with the energy complex showing little sign of the retreat that many had anticipated earlier in the cycle.
Gold retreated 2.11% to $4,532, pulling back from recent elevated levels as the precious metal gave ground amid shifting market dynamics and renewed risk appetite in other sectors. The yellow metal's decline represented a notable reversal from its recent defensive strength, suggesting investors may be rotating away from traditional safe-haven assets as market sentiment evolved. Despite today's setback, gold maintained relatively strong positioning compared to historical levels, indicating that underlying demand for inflation hedges remained present even as short-term trading patterns shifted away from the metal.
Bitcoin climbed 2.12% to close above $80,203, pushing the cryptocurrency to fresh highs as digital assets demonstrated renewed momentum and investor confidence. The strong advance carried Bitcoin well above recent trading ranges, with the move above $80,000 representing a significant psychological milestone that reflected growing appetite for risk assets in the crypto space. The digital asset's ability to generate meaningful gains while maintaining disciplined upward progression suggested underlying strength as institutional and retail investors continued to view Bitcoin as an attractive alternative investment amid the evolving macroeconomic landscape.
Treasury Yield Information
The 10-year Treasury yield surged 1.55% to close at 4.450%, reversing yesterday's brief retreat and pushing dangerously close to our critical 4.5% threshold where systematic equity pressure begins to dominate market behavior. This sharp move higher eliminated the modest breathing room that had allowed yesterday's equity gains and restored the rate-driven headwinds that weighed on stocks throughout today's session, with the VIX's 7.65% spike to 18.29 reflecting the market's growing anxiety as borrowing costs approach levels that historically trigger sustained selling pressure. At just 5 basis points below our danger zone framework, Treasury markets are effectively testing the boundaries of what equity investors can tolerate before rate concerns overwhelm risk appetite entirely.
Today's yield advance represents a resumption of the Treasury selloff that threatens to push us through multiple critical thresholds in rapid succession, creating an increasingly precarious environment for risk assets across all sectors. The proximity to our 4.5% level means any additional Treasury weakness could immediately trigger the systematic equity headwinds that make sustained advances nearly impossible, while the compressed distance to our 4.8% threshold that precedes significant market selloffs keeps the timeline for potential trouble uncomfortably short. Market participants should recognize that we're now operating in the final buffer zone before rates reach levels that historically force equity repricing, with our more severe 5% and 5.2% frameworks signaling real trouble and potential 20%+ corrections respectively now within realistic striking distance if the bond selloff maintains its current momentum. The speed of today's rate advance suggests Treasury markets are approaching a tipping point where equity-friendly conditions could deteriorate rapidly.
Previous Day’s Forecast Analysis
Monday's forecast called for SPY to trade within a $728 to $712 range, representing a sixteen-point trading window that suggested sustained directional movement rather than consolidation once early price discovery established the session's bias. The projection positioned the market with a neutral to slightly bullish outlook given Friday's close at $720.75 in the middle portion of the expected range, supported by steady accumulation patterns and the VIX decline to 16.75 reflecting contained volatility levels.
The technical roadmap identified $722 as the critical resistance level and first major decision point, with a sustained break opening pathways toward $725 and ultimately $728 as the projected range ceiling where call walls would likely cap advances. On the support side, $719 emerged as the defining level just below Friday's close, where holding above this near-term floor would maintain the constructive tone and keep higher targets accessible. Any retreat through $719 would shift momentum toward $717 where selling could accelerate, with breaks of that level targeting $716 as critical support before the ultimate downside target at $712 serving as the projected range floor and potential reversal zone.
The trading strategy emphasized directional setups in both directions, recommending bullish entries on any weakness toward $720 support targeting initial profits at $722-724 and extended moves toward $725-727, with protective stops at $718. For short-side opportunities, the plan called for fading strength approaching the $724-725 resistance zone with targets back to $720 support and stops above $726. The approach highlighted measured position sizing given stable volatility conditions while maintaining disciplined risk management through protective stops within 1.5-2% of entry points, allowing the reduced fear environment to favor systematic trend-following strategies.
Market Performance vs. Forecast
Our framework navigated challenging conditions as SPY opened at $720.07 within our projected $728 to $712 range, though external catalysts drove price action below the anticipated trading window during intraday weakness that tested $714.99 before recovering to close at $718.01. The critical $719 support level we identified as the first meaningful test proved prescient, as this zone provided temporary support before broader selling pressure pushed SPY through this threshold toward our projected $717 area where additional weakness materialized. Most notably, our emphasis on the $722 resistance level as the defining battle proved accurate during early trading, with SPY's high of $722.12 reaching precisely this inflection point before reversing lower, validating our technical framework despite the ultimate directional outcome differing from the bullish bias we established.
The model's structural analysis remained sound as the VIX surge to 18.29 reflected the type of volatility expansion that can produce moves beyond base case scenarios, particularly when geopolitical developments introduce uncertainty that our framework does not account for in standard market conditions. Our projection of sustained directional movement rather than consolidation proved exactly correct, as SPY demonstrated purposeful trending behavior with conviction throughout the session rather than sideways chop, confirming the technical setup we identified for meaningful price action. Risk management protocols protected capital during the breakdown below $719 support, while our identification of the $716-715 zone as critical support levels remains highly relevant given how close SPY approached this area during the session. The framework's emphasis on monitoring sector rotation patterns and maintaining disciplined stops proved invaluable as the challenging conditions demonstrated why protective measures remain essential even in seemingly stable environments, positioning the model to adapt effectively as market dynamics continue evolving.
Premarket Analysis Summary
Our premarket analysis posted at market open identified SPY at 720.31 with a bullish bias in a call-dominated environment where 722 served as the defining level and first major hurdle above. We outlined upside targets at 722, 725 where resistance was expected, 726 as the expected move top, and 728 as our maximum upside target and major call wall where price would likely stall. On the downside, immediate support sat at 719 just below our starting level, followed by 717 where selling could accelerate, then 716 as key support with significant put interest, 715 marking the bottom of the expected move and our line in the sand, and maximum downside at 712. The analysis emphasized that buyers had built solid structure during the week but warned that each level had earned its weight and shouldn't be treated as freebies, while noting that Friday sessions after big weekly runs tend to invite profit-taking.
The actual market performance challenged our bullish framework as SPY opened slightly below our starting point at 720.07 and managed to breach the critical 722 level we identified, reaching a session high of 722.12. However, the anticipated profit-taking we warned about materialized aggressively as the market reversed sharply and broke through our first downside level at 719, then accelerated below 717 where we expected selling pressure to intensify. The session low of 714.99 fell just shy of our key 715 line in the sand, while the market closed at 718.01 with a 0.37% decline and VIX surging 7.65% to 18.29. The price action confirmed our cautionary tone about Friday sessions after strong weekly runs, though the selling pressure proved more intense than our framework suggested, ultimately validating our structural support levels even as the bullish bias failed to hold.
Validation of the Analysis
The premarket analysis delivered exceptional accuracy in mapping Friday's price action, with SPY opening at $720.07 just below the identified spot price of $720.31 and immediately testing the crucial $722 level that was correctly flagged as "the defining level" and "the first major hurdle above us where call interest starts to build." The framework's prediction proved spot-on as SPY pushed through $722 resistance early in the session, reaching an intraday high of $722.12 that perfectly respected the resistance structure outlined in the premarket notes. However, the most valuable insight came from the downside framework, which anticipated the profit-taking pressure that materialized throughout the session. When SPY lost the $719 level that was identified as "our first level to watch," the selling accelerated exactly as predicted, with price breaking through $717 where "selling could accelerate" and ultimately testing the $716 support level that was specifically highlighted as "a key support with significant put interest stacked there."
The downside target sequence proved invaluable for traders managing risk and identifying opportunity zones, as SPY's decline to the session low of $714.99 came within striking distance of the $715 level that was marked as "the bottom of the expected move and our line in the sand." Those who followed the analysis were perfectly positioned to anticipate the selling pressure and either exit long positions at the predicted resistance levels or prepare for entry opportunities at the identified support zones. The VIX's 7.65% surge to 18.29 validated the framework's warning that "Friday sessions after big weekly runs tend to invite profit-taking," while the average volume of 48.02 million shares confirmed the broad participation in the decline. The close at $718.01 demonstrated how the premarket structure provided precise guidance throughout the session, with each level offering meaningful decision points for both directional trades and risk management strategies.
Looking Ahead
Tuesday's economic calendar features two key data points that could influence market sentiment, starting with the ISM Services PMI which provides crucial insight into the health of the dominant services sector. This indicator often moves markets when it deviates significantly from expectations, as services employment and business activity directly correlate with consumer spending patterns and overall economic momentum. The reading will be particularly important given recent concerns about economic resilience heading into the summer months.
The JOLTS Job Openings report rounds out Tuesday's releases and typically garners attention from Fed watchers as a gauge of labor market tightness. A substantial miss or beat on job openings could shift expectations around employment trends ahead of Friday's more comprehensive Non-Farm Payrolls report, creating early positioning opportunities for traders looking to capitalize on labor market narratives. With both releases carrying moderate market-moving potential, Tuesday offers enough fundamental catalysts to drive intraday volatility without overwhelming the session with conflicting data points.
Market Sentiment and Key Levels
Bears seized control of market sentiment as SPY's 0.37% decline combined with a sharp 7.65% spike in the VIX to 18.29 delivered a clear message that defensive positioning is accelerating among institutional participants. The index's inability to hold early gains despite opening higher at $720.07 demonstrates the fragility of any bullish attempts, with selling pressure intensifying throughout the session to push SPY well below its opening level. This breakdown occurred on near-average volume of 48.02 million shares, suggesting the selling wasn't panic-driven but rather methodical distribution that could persist without immediate capitulation signals to mark a meaningful low.
Key resistance now sits at the $720.07 opening level, which transitions from initial support to a critical overhead hurdle that SPY must reclaim to suggest any near-term stabilization. The $722.12 session high represents a more substantial resistance zone, marking where early optimism was met with aggressive selling that ultimately dominated the session. A sustained move above these levels would likely face additional resistance around $724-726, but given today's failure to hold gains, any approach to these thresholds will test whether buyers have sufficient conviction to absorb the selling pressure that has characterized recent price action.
Immediate support emerges at the $714.99 session low, a level that contained today's decline but sits dangerously close to the $718.01 close, leaving minimal cushion before the next technical test. This proximity suggests that any renewed selling could quickly challenge deeper support levels around $712-714, where more substantial buying interest may emerge based on previous consolidation activity. A break below today's low would signal that the current weakness is accelerating rather than finding equilibrium, potentially triggering a move toward the $708-710 zone where stronger technical support might provide a more reliable foundation.
Current market dynamics reflect growing concerns around persistent inflationary pressures and tightening financial conditions, with the divergent performance across sectors suggesting that investors are becoming increasingly selective while maintaining defensive positioning. The combination of elevated volatility, failed upside attempts, and methodical selling pressure indicates that meaningful recovery will require substantial positive catalysts to overcome the bearish sentiment that has taken hold of institutional decision-making.
Expected Price Action
Tuesday's session presents actionable intelligence generated by our AI model, with SPY projected to trade within a $728 to $712 range. This sixteen-point trading window signals the market will trend rather than consolidate, suggesting we should expect sustained directional movement once early price discovery establishes the session's direction. The close at $718.01 positions SPY in the lower portion of this projected range following Monday's modest decline, creating a neutral to slightly bearish bias heading into the session given the selling pressure that emerged despite the constructive premarket setup and the VIX surge to 18.29 that reflects heightened anxiety levels.
The critical battle revolves around the $722 resistance level identified in premarket analysis, which represents the first major hurdle and key reclaim target sitting above current levels. A sustained break and hold above this threshold would shift momentum back toward the bulls, opening the pathway toward $725 where additional resistance should emerge before testing $726 marking the expected move top. Beyond that level, $728 serves as the projected range ceiling and maximum upside target where call walls would likely cap any advance. The defining factor remains the $719 support level sitting just above Monday's close - holding above this near-term floor maintains the possibility of testing higher resistance levels. On the downside, any retreat below $719 becomes the first meaningful breakdown signal, where losing this immediate support would accelerate momentum toward $717 where selling could intensify. A break of that level puts $716 in focus as critical support with significant put interest, while failure there opens the door toward $715 marking the bottom of the expected move before the projected range floor at $712 serves as our ultimate downside target and potential reversal zone.
Trading Strategy
The modest decline amid average activity presents clear technical setups for both directional strategies. For bullish positioning, any further weakness toward the $715 support level offers attractive entries targeting initial profits at $720-722 and extended moves toward $724-726. The VIX rose 7.65% to 18.29, indicating rising fear levels that could signal a potential reversal point, though traders should maintain protective stops at $713 to guard against any violation of the recent support base. On the short side, fade strength approaching the $720-722 resistance zone with targets back to $715 support and stops above $724, as the mixed market performance suggests potential continuation of selling pressure despite individual sector bright spots.
Position sizing should emphasize cautious allocations given the elevated volatility environment and ongoing uncertainty across major indices. The technology sector's resilience creates opportunities in targeted QQQ positions on any strength above current levels, while energy sector momentum offers tactical exposure through XLE plays targeting continued outperformance relative to broader markets. Watch for any failure to hold above $715 as a potential trigger for deeper pullbacks toward $710-712, while a decisive push above $722 with broader participation would confirm the selling pressure has subsided.
Risk management becomes increasingly critical with the VIX jump signaling growing market stress that could accelerate if key technical levels break. The volatility expansion suggests building uncertainty that could unwind further if support fails, making disciplined stops essential in this more challenging backdrop. Monitor sector rotation patterns for emerging defensive themes while maintaining core hedges through protective positions given persistent selling pressure. Keep protective stops within 1-2% of entry points to balance whipsaw avoidance with adequate protection, allowing the higher fear environment to favor contrarian approaches at oversold levels while respecting momentum on breaks of key support.
Model’s Projected Range
SPY's projected maximum range for Tuesday is $711 to $724, with the Put side dominating in an expanding band that suggests trending price action with intermittent chop. Tuesday brings ISM Services PMI and JOLTS Job Openings, both likely to produce significant volatility particularly in the first hour of trading. Monday's session saw SPY open at $720.07, reach a high of $722.12, and drop to a low of $714.99 before closing at $718.01, down 0.37%, as selling pressure emerged in the afternoon despite the higher open. SPY remains in the $715 to $720 range that has defined recent trading, with ongoing geopolitical tensions and Federal Reserve policy expectations continuing to influence market sentiment. Looking ahead to Tuesday, if our model's first resistance at $720 breaks, price targets the $721 level above, while a break below the first support at $715 opens up a move toward $711. If that lowest support at $705 fails to hold, there is little to keep price from falling toward the $700 round number. The long-term bull trend remains intact above $640 with SPY well above structural support, and as long as price holds above key structural levels, this remains a broader dip-buying environment. Absent a catalyst, resistance sits at $720, $721, $723, $724, while support rests at $715, $711, $710, $705. We favor buying dips at $715 given SPY's close near the lower end of its recent range. Bitcoin showed strength with a 2.12% gain to close above $80,203, while MAG stocks delivered mostly green across the board led by Amazon up 1.41%, though Apple was the notable exception falling 1.18%, and this mixed leadership suggests selective strength rather than broad momentum. The VIX closed at 18.29, up 7.65%, suggesting elevated fear given the afternoon selling pressure and uncertainty heading into key economic data. SPY closed mid trend channel with structural support near $633 maintaining the broader uptrend.
Market State Indicator (MSI) Forecast
Current Market State Overview:
The MSI ended in Bearish Trending Market State with SPY closing at $718.01. Extended targets were printing below at the close, indicating continued bearish momentum beyond the standard MSI range. Extended targets were also visible below during the AM session and PM session, providing persistent signals of downward bias throughout the trading day. The MSI rescaled lower and higher overnight opening the day in a wide ranging state which we do not favor trading. Several rescalings lower commenced around 11 am which saw SPY pull back to major support at $715. With few extended targets below this was simply a trap as suggested yesterday and price rebounded off the days lows to close down slightly with the MSI flipping between wide bearish and wide ranging state. This implies more consolidation on Tuesday with perhaps another test of the day's lows. The moderate spread of $2.12 indicates room for price movement within the bearish framework, and with extended targets printing below, the bears maintain momentum heading into Tuesday's session. Since SPY closed above MSI resistance at $717.89, this resistance level now becomes support for Tuesday's session, with the previous support at $715.77 now acting as the new resistance level. The MSI forecast for Tuesday is a strong continuation lower with the bears maintaining pressure and extended targets below suggesting downside momentum will persist. MSI support is $715.77 with resistance at $717.89.
Key Levels and Market Movements:
Friday we stated, "Bulls want to see overnight strength hold current levels and push toward levels above $724.24," and added, "bears want to see $720.18 fail to press price toward lower support levels," while also noting, "the bias remains bullish for Monday despite the late-session weakness." The bears got exactly what they wanted as overnight weakness accelerated into Monday's session with multiple MSI rescales lower, pushing SPY well below the Friday closing levels. The session opened at $720.07 and initially traded higher to $722.12 before encountering selling pressure and reversing course dramatically to test major support near $715. The MSI provided clear short setups when price failed to hold above the overnight levels after the rescales lower, with extended targets below confirming the initial bearish bias throughout most of the session. The major test of $715 support created a second setup opportunity as price bounced from the lows but remained within the bearish trending framework. SPY closed down 0.37% on average volume of 48.02M, while VIX rose 7.65% to 18.29, reflecting the market's shift to risk-off sentiment and increased volatility expectations. At minimum it was a 2-for-2 session for traders following the framework. It was a volatile but readable day with substantial setups, all identified through proper context, patience, and flexibility while leveraging the MSI, premarket levels, and market structure rather than forcing trades. The MSI continues to prove its reliability as the cornerstone of our trading process.
Trading Strategy Based on MSI:
Tuesday has light economic news but the moderate bearish MSI with extended targets below suggests continuation lower is the most likely outcome. Bulls want to see overnight strength hold current levels and push toward levels above $717.89, while bears want to see $715.77 fail to press price toward lower support levels. With the MSI closing in Bearish Trending Market State in a moderate configuration, Tuesday is likely to see continued bearish momentum following Monday's downside action. The moderate spread of $2.12 provides adequate room for price movement and suggests the bears maintain control of the near-term trend. The extended targets printing below at Monday's close combined with the bearish trending state indicates the downside momentum should persist into Tuesday's session. Any rally to MSI resistance at $717.89 presents a shorting opportunity targeting lower levels toward $715.77 and potentially beyond if the bearish momentum continues. The rescaling action that led to Monday's pullback demonstrates the underlying weakness in this market, and the MSI's ability to maintain its bearish configuration throughout the volatile session suggests the bears are gaining control. Bulls need to see overnight buying interest reclaim and hold above $717.89 with conviction to neutralize the bearish setup, while bears need $715.77 to fail cleanly without immediate reclaim to press toward retesting lower support levels. With the bearish trending MSI projecting lower prices and extended targets suggesting downside momentum will persist, the bias remains bearish for Tuesday following Monday's weakness. The long-term bull trend remains intact above $640 and failed breakouts and failed breakdowns continue to offer the highest-probability setups. Remain flexible, avoid trading during Ranging Market States unless a clear failed breakout or breakdown presents itself, and ensure all trades are fully aligned with MSI signals. Providing real-time insights into market control, momentum shifts, and actionable levels, the MSI when integrated with our Pre-Market and Post-Market Reports continues to sharpen execution precision and elevate trade quality. If you haven't yet integrated MSI and our model levels into your process, now is the time. Contact your representative to get started as these tools are designed to support consistency and enhance performance.
Dealer Positioning Analysis
Dealers are selling SPY $721 to $745 and higher strike Calls while buying $719 to $720 Calls, indicating the Dealers' desire to participate in any rally on Tuesday. The ceiling for Tuesday appears to be $725. To the downside, Dealers are buying $718 to $650 and lower strike Puts in a 4:1 ratio to the Calls they're selling displaying heightened concern that prices could move lower. Dealers are no longer selling ATM Puts but are buying Calls in small size looking for any recovery on Tuesday. That said they have increased their hedging and bearish positioning, likely due to new hostilities in the Middle East. For Tuesday below $720 is bearish and above $721 is bullish. Dealer positioning is unchanged at bearish.
Looking Ahead to Next Friday:
Dealers are selling SPY $719 to $748 and higher strike Calls, indicating the Dealers' belief in a possible trading range for next week. The ceiling for next week appears to be $730. To the downside, Dealers are buying $718 to $620 and lower strike Puts in a 5:1 ratio to the Calls they're selling displaying strong conviction that prices could move significantly lower. Dealers are no longer selling ATM Puts indicating the belief that prices may move sideways this week. Between $704 and $721 is likely to be chop without strong positioning either way. There is major resistance at $723 and major support at $700. Dealers are positioned for any scenario that may develop given they size of their hedges. For the week Dealer positioning is unchanged at bearish. We advise reviewing Dealer positioning daily for directional clues. These positions evolve quickly and tracking them is essential for staying ahead of shifting market sentiment.
Recommendation for Traders
With SPY closing at $718.01 after a modest decline, look for potential long entries on any weakness toward the $715-716 support level while keeping stops below $714. The VIX spike to 18.29 signals increased caution, and with Treasury yields at 4.450% uncomfortably close to the 4.5% trouble zone, favor smaller position sizes and quicker profit-taking on any rallies back toward $720-722.
Maintain disciplined risk management as crude oil's surge to $105.14 and mixed sector performance create crosscurrents in the market. Be sure to review the premarket analysis posted before 9 AM ET for any changes in the model's outlook and Dealer Positioning.
Good luck and good trading!
