Market Insights: Thursday, May 29th, 2025
Market Overview
Markets were jolted Thursday morning as fresh tariff concerns resurfaced, sending early futures lower across the board. A federal appeals court temporarily reinstated President Trump’s global tariffs, pausing a lower court’s decision to block the levies. The legal limbo now gives the administration time to submit a formal defense by June 9, and officials signaled they’re prepared to take the fight to the Supreme Court if necessary. Meanwhile, the White House hinted at exploring alternative routes to reimplement tariffs without invoking emergency powers. The news added a layer of uncertainty to an already fragile market landscape, with traders anxiously eyeing inflation impacts down the line. While analysts expect any tariff-driven inflation to show up in later data, the upcoming release of the April Core PCE report on Friday remains in sharp focus. Markets had been riding a wave of optimism earlier in the week, boosted by trade optimism and Nvidia’s strong earnings. But Thursday’s legal twist sapped momentum, reinforcing the narrative that the market remains sensitive to geopolitical and policy shifts. Despite the setback, SPY managed to hold above a key support zone by the close, showing resilience amid rising headline risk.
SPY Performance
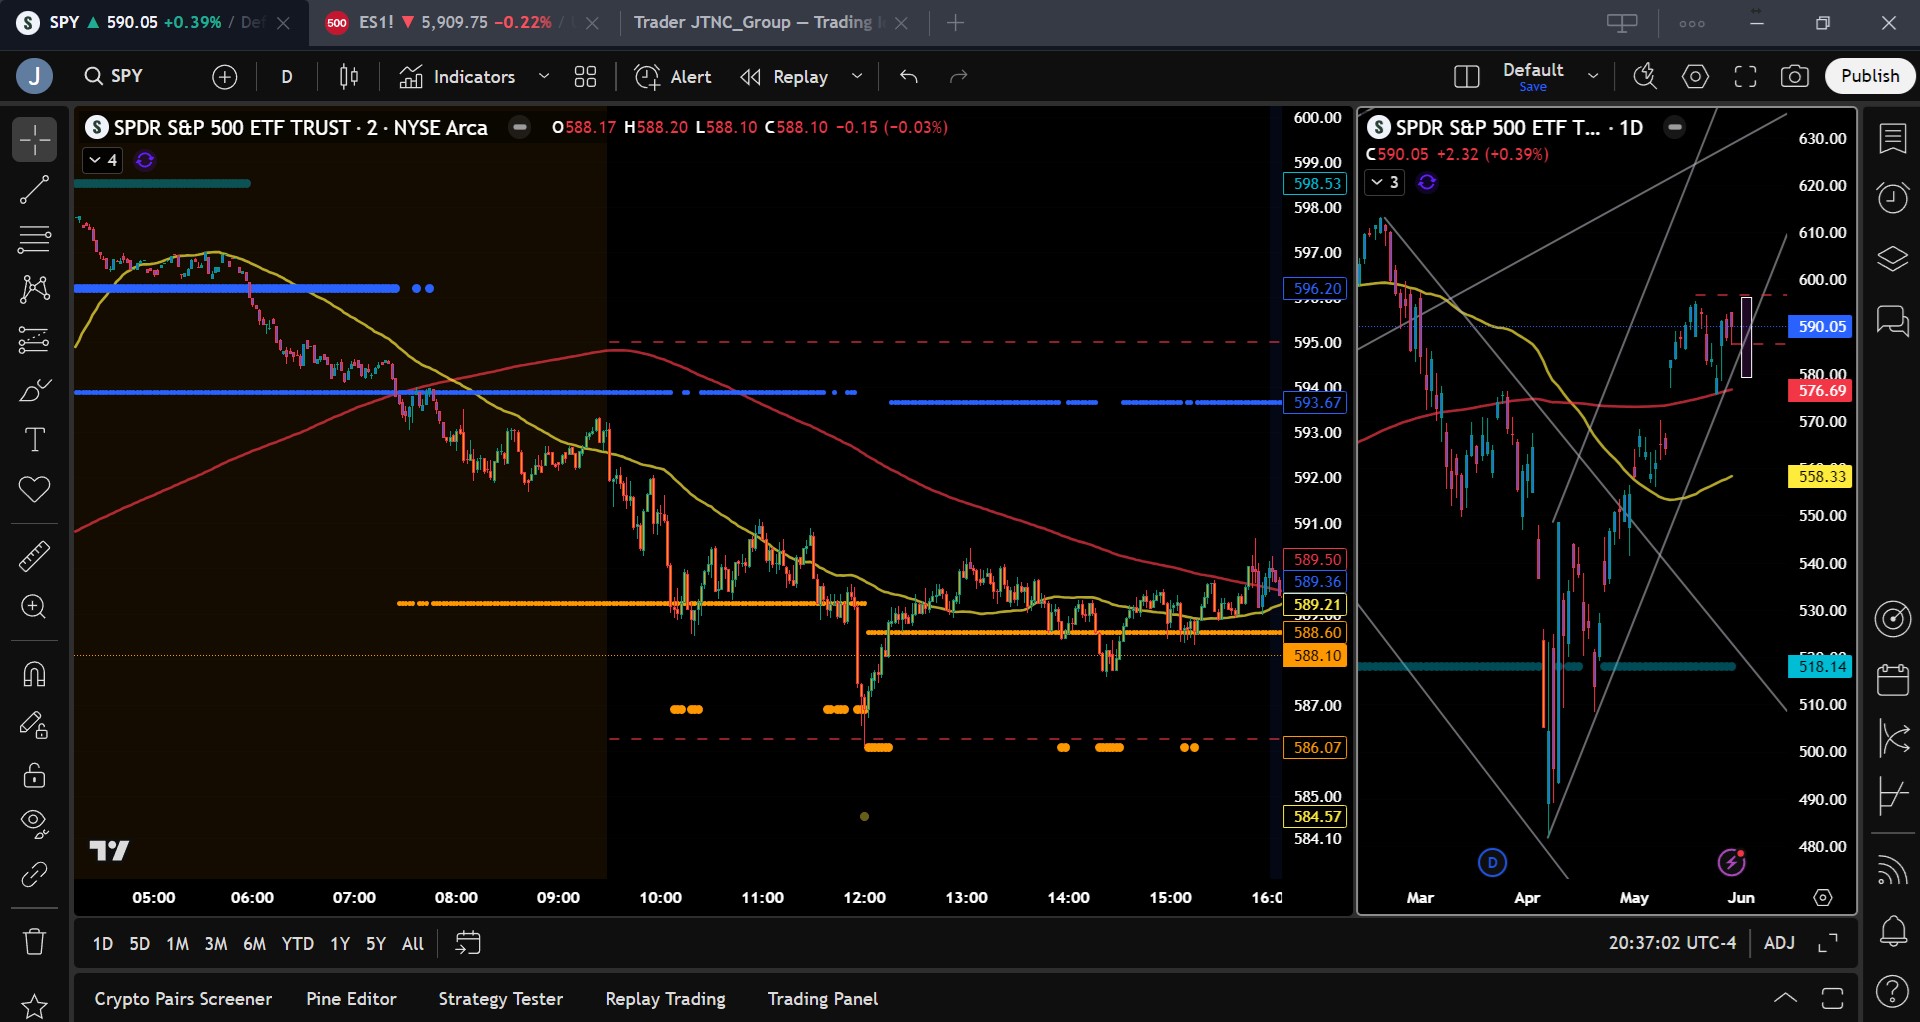
SPY slipped 0.59% on Thursday, closing at $590.05 after opening at $593.06. It reached a high of $593.20 in early trading before losing ground throughout the session and dipping to a low of $586.07. The decline, though modest, reflected hesitation as the tariff situation evolved and traders took profits following recent gains. Volume climbed to 65.01 million shares, slightly above average, indicating active positioning ahead of Friday’s inflation data. Despite the red close, SPY stayed above the critical $585 support level, keeping the broader bullish structure intact for now.
Major Indices Performance
The Nasdaq led the session with a 0.39% gain, helped by lingering strength in large-cap tech. The Dow followed with a 0.28% rise, and the Russell 2000 added 0.34%, rebounding from recent weakness in small caps. The S&P 500, like SPY, edged lower in a sign of consolidation. Early enthusiasm over the court’s temporary halt to the tariff block faded by midday as investors digested the broader implications. Defensive sectors underperformed slightly as cyclical names bounced back modestly. With no economic data on the docket, sentiment shifted more on headlines than fundamentals.
Notable Stock Movements
It was a mixed day for the Magnificent Seven. Alphabet led the group lower with a 1.98% loss, weighing on broader sentiment. Apple and Netflix also saw declines, while the remaining tech giants ended in the green. The divergence underscores how delicate market leadership remains, especially when policy headlines cloud the outlook. Nvidia’s post-earnings strength offered some lift early in the session, but the group overall lacked a clear direction, mirroring the broader indecision in markets.
Commodity and Cryptocurrency Updates
Crude oil dropped 1.54% to $60.90, nearing a long-standing downside target our model has forecasted for months. Continued weakness in oil aligns with our expectation for a bottom near $50, driven by a strengthening dollar and higher interest rates. Gold rebounded 0.89% to $3,317.91 as traders sought safety amid renewed policy uncertainty. Bitcoin continued its retreat, losing 2.07% to close above $105,000. We maintain a bullish stance on Bitcoin between $83,000 and $77,000, but urge caution below that range where further downside risk looms.
Treasury Yield Information
The 10-year Treasury yield fell 1.09% to 4.426%, easing slightly from the critical 4.5% threshold. The pullback helped stabilize equities later in the day, offsetting some of the volatility tied to tariff uncertainty. Still, with rates holding elevated levels, investors remain sensitive to inflation data and Fed expectations. A move above 4.5%, and particularly 4.8%, would likely reignite equity weakness. For now, yields remain in a zone that permits market resilience, but risks are building.
Previous Day’s Forecast Analysis
Wednesday’s forecast projected a trading range between $579.25 and $596.25, with bullish momentum likely if SPY held above $585. It highlighted $592 and $595 as upside targets, while emphasizing $585 as a crucial support. A break below $585 was expected to trigger downside action toward $582 and $580. The strategy leaned long above $585, advising tactical shorts only on failed breakouts near resistance. The outlook acknowledged potential volatility from upcoming data but kept the emphasis on continuation of the rally barring any major downside catalysts.
Market Performance vs. Forecast
Thursday’s action largely respected Wednesday’s forecast. SPY opened at $593.06 and initially pushed to $593.20, coming close to the $595 resistance but quickly fading. The session low of $586.07 narrowly held above the $585 support zone, validating the model’s call for $585 as a critical pivot. The market reversed from near resistance and consolidated near forecasted levels, providing solid opportunities for both short and long trades. Traders who sold into strength near $593 or bought the dip toward $586 likely captured strong risk-adjusted returns. The projected range held firm, and the bias toward bullish control above $585 remained intact.
Premarket Analysis Summary
In Thursday’s premarket analysis posted at 7:41 AM, SPY was trading at $593.54 with a bias level identified at $590. The forecast leaned bullish above this level, targeting $593, $595, and possibly $600 or even $604 if momentum remained strong. On the downside, support was flagged at $593, $590, $588.75, and $586.25, with $580.25 seen as a distant stretch. The premarket note cautioned against chasing long trades given signs of profit-taking, instead favoring long entries from key support levels and encouraging quick profit-taking on any short trades.
Validation of the Analysis
The market followed the premarket script with impressive accuracy. SPY opened just above the bias level and briefly tested the upper targets near $593 before slipping below $590. It found support in the 586 range, nearly tagging the premarket downside target at $586.25 before stabilizing. Traders who waited for clean entries from support were rewarded, and short trades near $593 delivered prompt returns. The analysis rightly identified both the potential for early strength and the risk of mid-session profit-taking, once again proving to be a reliable roadmap for intraday strategy.
Looking Ahead
All eyes now turn to Friday’s release of Core PCE, the Fed’s preferred inflation measure. This report has the potential to move markets, particularly if it shows signs of sticky inflation. A strong print could challenge recent bullish momentum and push yields higher. However, a soft number may clear the path for another rally leg toward SPY’s highs. With economic data becoming increasingly pivotal, traders should expect a reaction to even modest surprises. Attention will also shift next week to a wave of jobs data and Fed commentary.
Market Sentiment and Key Levels
SPY closed at $590.05 and remains within its broader bullish trend, though it’s now trading just above key support. Momentum has moderated, but sentiment still leans bullish while SPY holds above $585. Resistance remains at $592, $595, and $600, with a breakout above $595 likely opening the door to a retest of recent highs. On the downside, support lies at $585, $580, and $575. Should $585 fail, the bears could retake control and drive price toward institutional hedging zones between $565 and $585. For now, the battle continues within the $585–$595 range.
Expected Price Action
Our AI model projects a trading range of $579.25 to $596.25 for Friday. This wide range suggests potential for trending action as volatility creeps back in. The bias remains modestly bullish, with upside favored if SPY holds above $585. A push through $592 could lead to a test of $595, and if that breaks, $597 comes into play. Conversely, failure to hold $585 may drag price to $582 and possibly lower. This is actionable intelligence: expect choppy trade early, with trending opportunities emerging as the day unfolds.
Trading Strategy
Traders should continue to lean long above $585, with upside targets at $592 and $595. A breakout above $595 could see follow-through to $597. Short setups may be considered if SPY loses $585, with targets at $582 and $580. However, short trades should be managed carefully given the overall bullish structure. The VIX dipped to 19.18, still well below the key 23 level, indicating a relatively calm environment for long-biased trades. As always, maintain tighter stops into resistance and consider reducing size into key data prints.
Model’s Projected Range
The model’s maximum projected range for Friday is $579.25 to $596.25, with the Call side dominating in a slightly narrowing band—suggesting choppy price action punctuated by brief trending moves. PCE data is scheduled for release in the premarket and could modestly impact the market. No other major news is expected, though the risk of surprise headlines from the White House remains ever-present. Today, markets initially surged on news that the courts ruled the President lacks authority to impose permanent tariffs. However, the rally faded in the overnight session, with SPY opening just slightly above yesterday’s close and spending most of the day under pressure. By the close, the market had round-tripped to the prior day’s level—an emblem of the confusion characteristic of rangebound markets. That said, bulls still have the upper hand with SPY closing above $585. While momentum has softened, our model continues to indicate rising odds of a retest of the overnight highs near $598.50 before any significant pullback. A breakout to new all-time highs remains increasingly plausible. Key resistance levels are now $592, $595, and $600. On the downside, support lies at $585, $580, and $575. SPY is currently hovering just above the lower bound of its bullish trend channel, which appears increasingly unsustainable and may need to be redrawn. Above $595, a resistance wall is forming—and a new wall is beginning to develop just above $600. Conversely, solid support is taking shape below $580, extending down to $570. This suggests SPY may continue to oscillate in a $575–$595 range until a breakout occurs. Whether due to profit-taking or a brief resurgence of bearish sentiment, the overnight rally failed to hold, and SPY has returned to its recent range—a condition likely to persist. A catalyst will be needed to drive a breakout through $597 and initiate a push to new highs. As long as $585 holds on Friday, a move toward $593–$595 is likely. A break below $585, however, could trigger a sharper retracement and revive bearish momentum. The $565–$585 zone remains a key battleground where institutions are trimming exposure and increasing downside protection. Trading volume was average today, reflecting a balanced market. Since early April, market direction has largely been dictated by macroeconomic data, bond yields, inflation, tariffs, and fiscal policy—trends likely to persist absent a major policy shift. The VIX fell 0.67% to 19.18, staying well below the critical 23 level, which generally supports bullish conditions. In light of ongoing volatility and macro uncertainty, traders should remain flexible and alert to shifting dynamics in the days ahead.
Market State Indicator (MSI) Forecast
Current Market State Overview:
The MSI is currently in a wide Ranging Market State, with SPY closing at the low end of the range. Overnight the market rallied with the MSI rescaling higher several times, reaching $598 before the exuberance failed and SPY came back to earth. The MSI then rescaled from a strong bullish state with extended targets above to a ranging state and by the open, the wide-ranging state was an indicator of what the day would hold which was mostly range bound price action with brief moments of failed breakdowns and breakouts. While there were brief period of the MSI in a bearish state, this faded quickly and SPY closed in a very wide-ranging state indicating confusion and a likely trading range for Friday. MSI support stands at $588.60 with resistance at $593.67.
Key Levels and Market Movements:
On Wednesday, we noted: “Barring any major developments out of Washington, upward momentum is likely to continue.” We also stated: “As long as $588 holds, Thursday’s potential peak is $595, with $597, the March highs remaining a short-term target for the bulls.” Finally, we added: “Should $588 give way, a pullback to $585 becomes likely.” Armed with that context, and following the overnight surge, we opened Thursday with the MSI in a ranging state, a condition we typically avoid trading. So, we sat on our hands and waited for the MSI to provide clearer directional cues. A brief dip below the range at 10:00 AM didn’t catch our interest. However, by 11:45 AM, we saw an opportunity to short the MSI bearish range down to MSI support at $586.90. The move came quickly in a fast-paced market. Turning to our premarket report for a second target (T2), we set our sights on $586.25, which was also hit swiftly. With a textbook failed breakdown from a major level, we reversed long at 12:04 PM after extended downside targets stopped printing. We rode the upside to our first target at $588.50, then set a second target at a premarket level of $590, which was reached by 1:00 PM. With our stop moved to breakeven, the market drifted sideways for the remainder of the day. We exited into the close at $590.40, satisfied with two well-executed trades that added to the bankroll. This session underscored the value of having a plan and sticking to it. The MSI provided clear insight into market control, key timing shifts, and actionable levels that allowed for precise entries and disciplined exits. Paired with our structured trading process and model levels, the MSI remains a powerful tool for achieving consistency.
Trading Strategy Based on MSI:
There is little expected to move the market Friday morning, aside from continued headlines on tariffs and legal action out of the White House. While these developments can shift sentiment quickly, the best approach remains to trade what’s in front of you. In the absence of a major external catalyst, we expect the range-bound environment to persist, with a potential retest of today’s lows and a possible rally toward $593. Upward momentum is likely to continue, and dips will likely be bought. As long as $585 holds, Friday’s potential peak is $595. Favorable news could even prompt a retest of the overnight highs. However, if $585 gives way, a pullback to $580 becomes likely. This would represent a key inflection point, with some control potentially shifting back to the bears and price possibly revisiting the $565–$585 zone—an area where institutional players have been actively hedging long exposure. Barring a breakdown of that nature, the path of least resistance remains higher. A sustained break above March’s highs could put new all-time highs back on the table. We continue to favor long setups on pullbacks to as low as $585. Tactical shorts may be considered above $593, but only in the case of a failed breakout accompanied by a weakening MSI. Currently, the MSI remains in a wide-ranging state, indicating a likelihood of continued sideways action. In this environment, strength should not be faded. Above $585, long setups remain the priority. Below that level, bearish pressure could reemerge, though we expect it to be more tempered unless accompanied by clear structural shifts. Sideways price action over the next day or two may favor two-way trading, but we remain cautious about short setups unless the structure is exceptionally clean. Failed breakdowns continue to offer high-quality long entries—don’t hesitate to engage when they present themselves. As always, align your strategy with the MSI and avoid trading during Ranging Market States. Stay disciplined and responsive to shifts in momentum and structure. The MSI delivers real-time clarity on both, and when used in conjunction with our Pre-Market and Post-Market Reports, it helps surface high-probability setups with precision. These tools keep you in sync with the tape and help avoid costly mistakes. If you haven’t yet incorporated the MSI and model levels into your trading process, now is the time. Contact your representative to get started as these tools can make a meaningful difference in consistency and performance.
Dealer Positioning Analysis
Summary of Current Dealer Positioning:
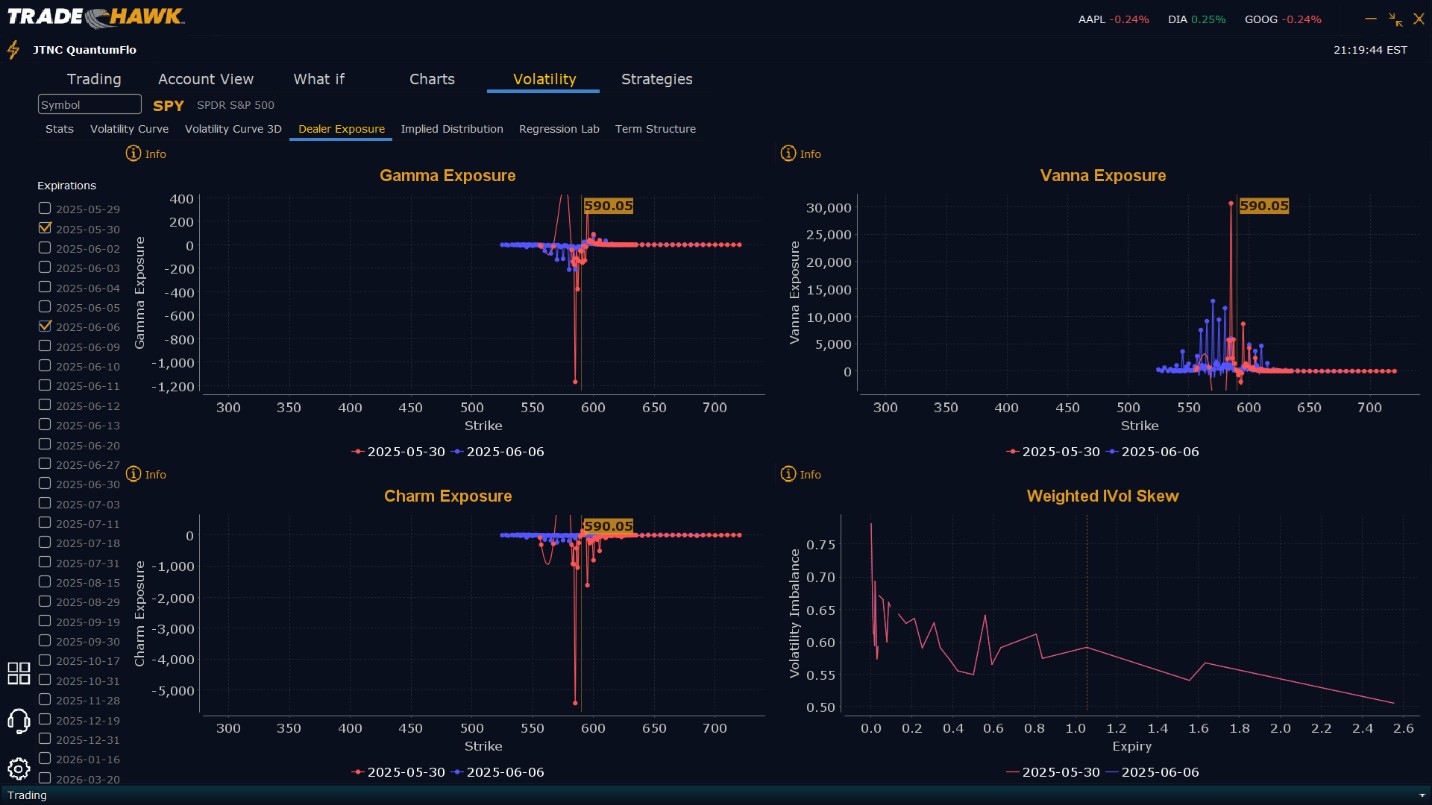
Dealers are selling SPY $591 to $605 and higher strike Calls implying the likelihood that prices will not move beyond $595 on Friday. To the downside, Dealers are buying $590 to $550 and lower strike Puts in a 3:1 ratio compared to the Calls they’re selling. Dealer positioning has changed from slightly bearish to bearish.
Looking Ahead to Next Friday:
Dealers are selling $591to $605 and higher strike Calls implying a likely ceiling in the market for next week of $600. Dealers are not positioned for materially higher prices next week and instead are relatively evenly balanced. To the downside, Dealers are buying $589 to $530 and lower strike Puts in a 4:1 ratio to the Calls they’re selling, reflecting a bearish outlook for next week. Dealer positioning has changed from slightly bearish to bearish. We advise reviewing Dealer positioning daily for directional clues. These positions evolve quickly and tracking them is essential for staying ahead of shifting market sentiment.
Recommendation for Traders
SPY continues to trade near key levels, holding above the crucial $585 area despite Thursday’s intraday weakness. Long setups remain favored above $585, with targets at $592 and $595. A break above $595 would point toward $597 and a potential retest of the March highs. Short trades can be considered if SPY loses $585, with downside targets at $582 and $580, but caution is warranted given the prevailing bullish momentum. The VIX at 19.18 indicates a relatively stable volatility backdrop, supporting swing trades and intraday setups. Be sure to review the premarket analysis posted before 9 AM ET to account for any changes in the model’s outlook and in Dealer Positioning.
Good luck and good trading!
