Market Insights: Wednesday, May 28th, 2025
Market Overview
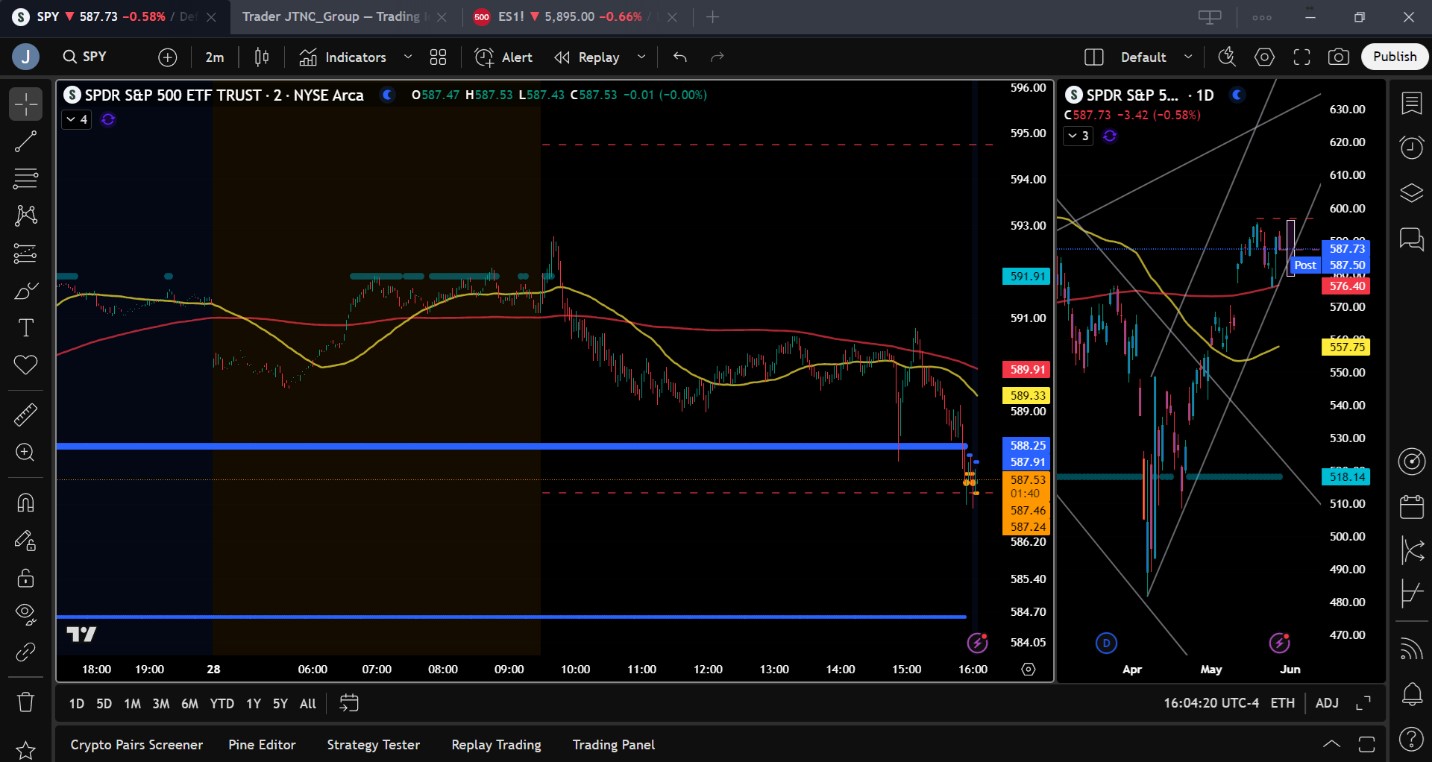
Markets gave back some ground on Wednesday after a strong start to the week, as traders showed caution ahead of Thursday’s economic data. The day opened on a firm note, following Tuesday’s rally sparked by the White House’s decision to pause its proposed tariffs on EU imports. But as the session wore on, momentum faded, and sellers began to pressure SPY below the 591 level. The afternoon sell-off pushed prices to a low of 586.99 before a modest recovery post-close lifted SPY slightly. Still, the bulls managed to hold the critical 585 level, suggesting that control remains in their hands for now.
The market appears to be stuck in a holding pattern as investors brace for tomorrow’s GDP and unemployment claims data. These figures are unlikely to move the market unless there is a significant miss, but the proximity to key resistance levels like 595 and 597 means any surprise could trigger a sharp move. So far, bulls have absorbed selling well, with institutional buyers defending the 580–587 range. Still, with price action stalling below 593 and volume slightly below average, traders are showing a preference for waiting rather than pressing new positions. Momentum remains tilted to the upside, but the market is clearly looking for a fresh catalyst to break through the next wall of resistance.
SPY Performance
SPY declined 0.59% on Wednesday, closing at $587.68 after opening at $591.55. It traded in a tight range early but weakened into the afternoon, reaching a low of $586.99 before rebounding slightly. While the session ended red, SPY managed to close above the 585 support area, keeping the bullish structure intact. Volume was 59.84 million shares, slightly below average, reflecting a more cautious stance from traders ahead of Thursday’s data releases.
Major Indices Performance
The Russell 2000 led the pullback with a 1.01% loss, reflecting renewed weakness in small caps. The Nasdaq fell 0.51% while the Dow shed 0.58%, with all three major indices closing lower after fading from early session highs. The S&P 500 joined the retreat, mirroring SPY’s decline. No major economic news drove the reversal, but traders appeared reluctant to chase gains after Tuesday’s run-up. Defensive sectors like healthcare held up better than cyclicals, suggesting a mild rotation into safety while investors await more direction.
Notable Stock Movements
It was a mostly red day for the Magnificent Seven, with only Apple and Meta managing gains. Tesla was the biggest laggard, dropping over 1.7% as enthusiasm cooled from Tuesday’s energy segment buzz. Nvidia gave up early strength ahead of earnings, while Alphabet, Amazon, and Microsoft also ended in the red. The group’s performance reflected the broader market’s indecision, as profit-taking set in after the prior day’s rally. Still, the tech giants remain key to the bullish narrative, and their resilience above support levels keeps sentiment intact.
Commodity and Cryptocurrency Updates
Crude oil climbed 1.12% to $61.57, continuing a choppy march lower that aligns with our model’s forecast for a drop toward $50. While short-term rallies remain possible if the dollar weakens, a longer-term decline is still expected as interest rates eventually stabilize and the dollar finds a bottom. Gold dipped 0.21% to $3,321 as demand for safe havens stayed muted. Bitcoin dropped 2.53% to close above $106,800, extending a recent pullback. Our outlook remains unchanged: buy between $83,000 and $77,000, avoid entries below $77,000.
Treasury Yield Information
The 10-year Treasury yield rose 1.04% to 4.480%, nudging closer to the 4.5% threshold that often pressures equities. The increase in yields signaled a slight shift back toward inflation concerns and may have contributed to Wednesday’s weakness in risk assets. While yields remain below crisis levels, a move toward 4.8% or above would likely reignite selling in stocks. Traders should continue to monitor the bond market closely as it remains a key driver of equity valuation.
Previous Day’s Forecast Analysis
Tuesday’s outlook projected a bullish setup with a trading range between $584.50 and $598.25. The model favored long setups above $588, with targets at $594 and $595, while support was seen at $582 and $580. It emphasized that a break below $588 would weaken momentum, and if SPY slipped below $585, downside risk would increase. The strategy leaned bullish but warned of a potential retracement if key levels failed. Traders were advised to stay long above $588 and only consider shorts if the market dropped back into the $582 zone or lower.
Market Performance vs. Forecast
Wednesday’s action closely followed the prior forecast. SPY opened at $591.55 and initially pushed higher but stalled just below the $594 resistance zone before reversing. Price dropped sharply into the $586 range by afternoon, briefly breaching the $588 support level. While SPY never touched $582, the failure to hold $588 triggered a slide that aligned with the model’s cautionary signal. The market did not test the upper targets near $595, confirming the forecast’s warning that upside would be limited if momentum waned. The decline validated the emphasis on $588 as a pivot, and traders who exited longs or initiated tactical shorts below that level found the strategy useful.
Premarket Analysis Summary
In Wednesday’s premarket analysis posted at 7:17 AM, SPY was trading at $591.57 with a bias level set at 591. The note suggested favoring long trades as long as SPY stayed above this level, targeting $594.75 and potentially $600. On the downside, it flagged $587.25 as a key support, with a warning that if broken, SPY could drift to the lower end of the range near $582. The tone leaned bullish but with a cautionary message: if 591 failed, recovery would be difficult. The analysis also predicted chop if SPY slipped below 591 and into the 587–594 zone.
Validation of the Analysis
Wednesday’s session validated the premarket roadmap with remarkable accuracy. SPY opened just above the 591 bias level but quickly lost it, triggering the projected pull into the 587 range. It bottomed near 587 and consolidated before recovering some ground post-close. The call to favor longs above 591 but expect downside if that level broke played out well. Price action behaved exactly as forecasted: strength faded early, consolidation set in between 588 and 591, and a deeper drop occurred after losing 587.25, nearly touching the lower target of $586. Traders who followed the guidance had clear levels to trade against and opportunities to act on both sides of the market.
Looking Ahead
All eyes turn to Thursday’s Preliminary GDP and Unemployment Claims data. While neither release is expected to significantly shake markets unless there’s a surprise, their proximity to key resistance could amplify reactions. A strong GDP beat could trigger a breakout through $595, while a miss might push SPY back toward $582 or lower. Friday’s Core PCE data will also be closely watched for signals on inflation. Until then, traders should expect choppy price action within established ranges as markets seek clarity from the incoming data.
Market Sentiment and Key Levels
SPY closed at $587.68 and remains within its bullish trend channel, albeit at the lower edge. Sentiment is still tilted bullish, but momentum has cooled. Key resistance now sits at $592, $595, and $600, with bulls needing a clean break above $592 to reignite upside momentum. Support lies at $585, $582, and $580. A break below 585 would mark a trend shift, bringing bears back into play. Until then, the 580–600 range remains the battleground, and bulls still have the upper hand unless data surprises to the downside.
Expected Price Action
Our AI model projects a trading range of $579.25 to $596.25 for Thursday. This wide range implies potential for trending moves rather than sideways chop. The bias remains modestly bullish, with momentum favoring retests of $592 and $595 if SPY holds above $585. A move above $595 could test $597 and potentially trigger a run toward new highs. However, if SPY fails to hold $585, a drop toward $582 and even $580 is likely, with momentum unwinding quickly. This is actionable intelligence: watch the $585 and $592 zones for breakout or breakdown setups.
Trading Strategy
Traders should lean long above $585, targeting $592 and $595, with stops tightened as resistance is approached. A break above $595 opens the door to $597. Conversely, if SPY drops below $585, tactical shorts may target $582 and $580. These setups carry higher risk given recent bullish strength, so shorts should be managed aggressively. The VIX rose 1.79% to 19.30, signaling slightly higher volatility, though still well below panic levels. With key economic data ahead, reduce size around key releases and prioritize precision over aggressiveness.
Model’s Projected Range
The model’s maximum projected range for Thursday is $579.25 to $596.25, with the Put side dominating in a slightly expanding range suggesting choppy price action with periods of trending behavior for Thursday. GDP and unemployment claims are due tomorrow, but unless both significantly miss expectations, they’re unlikely to meaningfully move the market. No other news is expected, though the risk of surprise headlines from the White House always lingers. Today, markets initially rallied but stalled below $593, spending most of the session in a narrow range between $588 and $591. In the final hour, SPY sold off to the day’s lows before recovering much of the loss after the close. Despite this, bulls remain in control with price holding above $585. Momentum continues to build, and our model forecasts rising odds that SPY will test its April highs near $597 before experiencing a meaningful pullback. A breakout to new all-time highs from the April base is becoming increasingly plausible. Key resistance levels are now $592, $595, and $600. On the downside, support is seen at $585, $582, and $580. SPY currently sits just above the lower bound of its bull trend channel, which is increasingly likely to break and be redrawn, as the current slope appears unsustainable over the longer term. Above $592, a wall of resistance has formed, but beyond $600, there is little technical overhead. Below $580, support weakens, while the $580–$587 zone remains a firm area of buying interest. This suggests SPY may continue to trade in a range between $580 and $600 until a breakout occurs. Bears briefly emerged today but failed to disrupt the rally. Unless an external catalyst appears, bulls will likely push for a breakout through $595 and $597 to set up a run at new highs. As long as $588 holds on Thursday, a move toward $593 and $595 is likely. However, a break of $588, and especially $585, could trigger a sharp retracement, bringing bears back into play. The $565–$585 range remains a battleground, where institutions have been reducing exposure and increasing downside protection. Trading volume was slightly below average today, so we caution against overinterpreting the day’s price action. Since early April, markets have been driven by macroeconomic data, bond yields, inflation figures, tariffs, and fiscal policy, factors that will likely remain in focus barring a major policy shift. The VIX rose 1.79% to 19.30, still well below the key 23 level, which generally supports bullish momentum. Given the persistent volatility and macro uncertainty, traders should remain flexible and attentive to shifting market dynamics in the days ahead.
Market State Indicator (MSI) Forecast
Current Market State Overview:
The MSI is currently in a narrow Ranging Market State, with SPY closing mid-range. Overnight and for most of the day the MSI held steady in the prior days, wide Bullish Trending Market State. With just minutes to go in the regular session, the MSI rescaled lower to a ranging then a bearish state but given the time of day and how narrow these were, the MSI settled in a ranging state likely waiting on results from Nvidia earnings. It’s likely the MSI rescales after NVIDA earnings. Should the MSI rescale once again to a wide MSI, this favors a continuation of the rally that has been underway for several days. MSI support stands at $587.46 with resistance at $588.25.
Key Levels and Market Movements:
On Tuesday, we noted: “some follow-through can be expected as long as $588 holds.” We also stated: “Wednesday’s potential peak is $595,” and “We continue to favor longs on pullbacks to as low as $585.” With this plan in hand and with the market drifting higher overnight, there was little to do at the open but sit on our hands as extended targets printed. At 9:40 a.m., price set up a failed breakout. We waited for extended targets to stop printing and entered short at $592, aiming for MSI support at $588.25. This was a meaningful target, but we didn’t expect to reach it quickly. Reviewing yesterday’s post-market report, we noted $590 as a support level, a more realistic spot for taking first profits. We exited 70% of our position there at 10:15 a.m., then focused on $588 for our second target. It took most of the day, but just before 3 p.m., we hit our target right at MSI support. A failed breakdown at that level prompted us to exit and reverse long at $588.30, targeting $590 for our first target. A quick pop put us in the money again, with T2 set at the premarket level of $591. Although price came close, it didn’t quite reach $591. After a less-than-ideal failed breakout, we decided to exit the remaining position. Given it was after 3 p.m. we called it a day. We did consider a short, which would have worked well, but long-time readers know we never risk going red on a green day. With two solid, profitable trades under our belt, there was no reason to jeopardize those gains on a third trade. One or two quality setups per day is more than enough to build a strong trading career. Once again, today’s success came from having a plan, following that plan, and relying on the clarity provided by the MSI. It identified market control, key timing shifts, and actionable levels that allowed for precise entries and disciplined exits. Combined with a structured trading process and our model’s levels, the MSI remains a powerful tool for consistency. We continue to strongly recommend incorporating the MSI into your approach, as it aligns you with dominant market forces, helps avoid traps, and supports confident execution.
Trading Strategy Based on MSI:
GDP and Unemployment data loom before the open, with NVIDIA earnings set for release after the close, any of which could move markets significantly in either direction. While today was a modest pullback, price closed above $585, signaling that the bulls remain firmly in control. Barring any major developments out of Washington, upward momentum is likely to continue. As long as $588 holds, Thursday’s potential peak is $595, with $597, the March highs remaining a short-term target for the bulls. Should $588 give way, a pullback to $585 becomes likely. That level is critical; if it fails, control may shift back to the bears, potentially driving price back into the $565–$585 range, where institutional players have been hedging long exposure. Absent that kind of breakdown, the path of least resistance remains higher, with a break above March’s highs putting new all-time highs on the table. We continue to favor longs on pullbacks as low as $585, and we see potential for tactical shorts above $593, but only in the case of a failed breakout accompanied by a weakening MSI. Currently, the MSI is in a narrow range and is likely to rescale overnight. Traders should look to align with the MSI, particularly when extended targets are printing. This remains an environment that does not favor fading strength. Above $585, long setups remain the focus. Below that, bearish pressure could return, though likely in a more tempered fashion. Sideways price action over the next day or two may favor two-way trading, but we remain cautious about recommending shorts unless the setup is exceptionally clean. Failed breakdowns continue to offer high-quality long entries; don’t hesitate to participate in the uptrend when they appear. As always, align your strategy with the MSI and avoid trading during a Ranging Market State. Stay disciplined and responsive to changes in market structure. The MSI provides real-time clarity on momentum and structure, and when combined with our Pre-Market and Post-Market Reports, it highlights high-probability setups and precise entries. This keeps you in sync with the tape and helps you avoid costly mistakes. If you haven’t yet incorporated the MSI and model levels into your trading approach, now is the time. Contact your representative to get started as these tools can make a meaningful difference in both consistency and performance.
Dealer Positioning Analysis
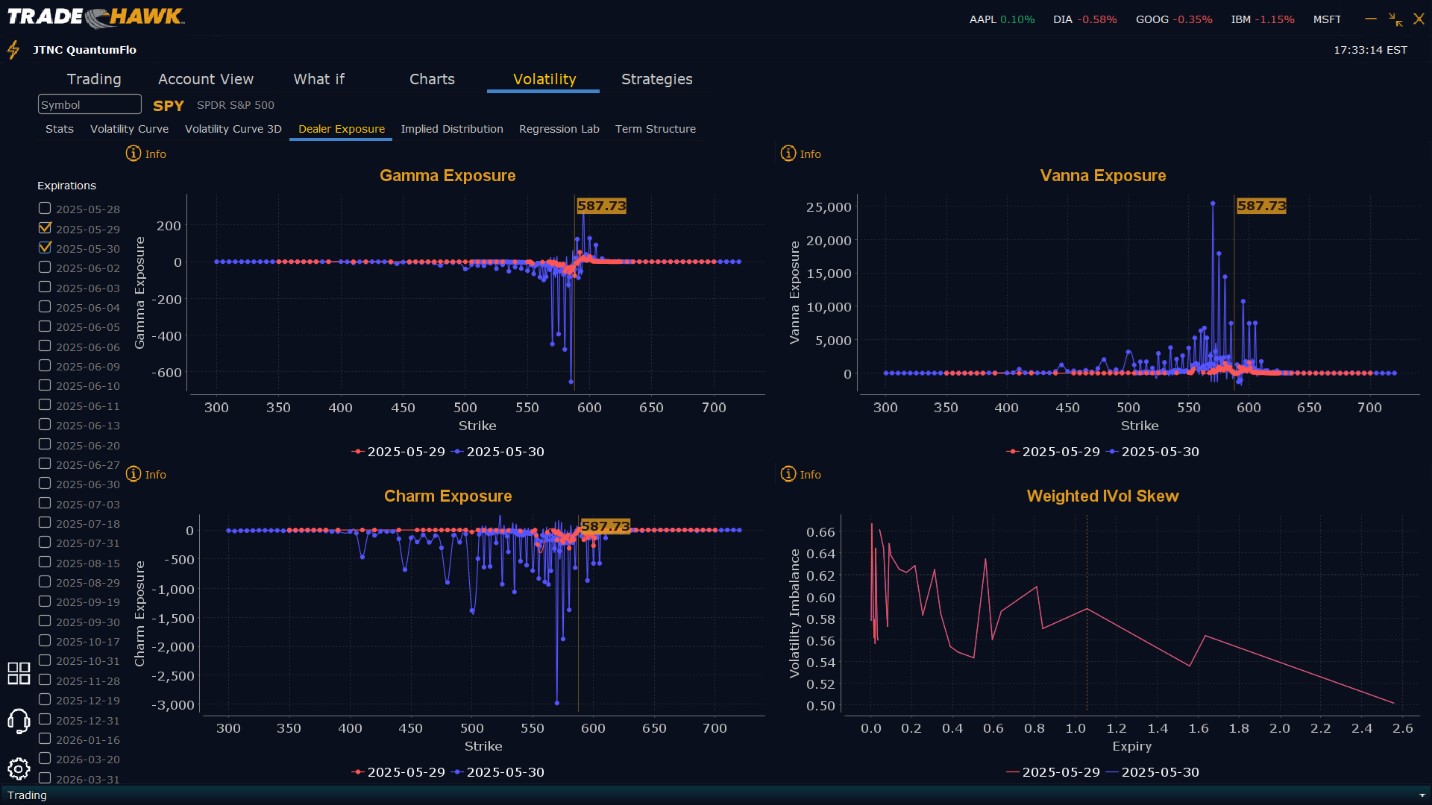
Summary of Current Dealer Positioning:
Dealers are selling $588 to $605 and higher strike Calls. Dealers are no longer selling Puts. This implies a likely peak on Thursday at $592. To the downside Dealers are buying $587 to $550 and lower strike Puts in a 2:1 ratio to the Calls they are selling, implying a neutral posture for Thursday. Dealer positioning is unchanged from neutral to neutral.
Looking Ahead to Friday:
Dealers are selling $588 to $610 and higher strike Calls while buying $590 and $591 Calls indicating the Dealers desire to participate in any breakout above $591 by Friday. Dealers are positioned for a balance market through the end of the week as Dealers are not heavily invested in these long Calls. Dealers see a top into Friday at $595. To the downside, Dealers are buying $587 to $500 and lower strike Puts in a 3:1 ratio to the Calls they’re buying/selling, reflecting a slightly bearish outlook for the rest of the week. Dealer positioning is unchanged from slightly bearish to slightly bearish. We advise reviewing Dealer positioning daily for directional clues. These positions evolve quickly and tracking them is essential for staying ahead of shifting market sentiment.
Recommendation for Traders
SPY is holding near key support after Wednesday’s mild pullback. Long setups remain favored above $585, targeting $592, $593.50, and $595. Short trades may be attempted on breaks below $585, targeting $582 and $580, but should be taken cautiously given the bullish trend. There may also be an opportunity for shorts above $593 on failed breakouts. The VIX rose slightly to 19.30, still signaling a supportive environment for long trades. Manage position sizes carefully heading into Thursday’s economic releases. Review the premarket analysis posted before 9 AM ET to account for any changes in the model’s outlook and in Dealer Positioning.
Good luck and good trading!
