
Market Insights: Wednesday, May 27th, 2026
Market Overview
US stocks edged higher Wednesday as the Dow Jones Industrial Average gained 0.4% to close at a record high, while the S&P 500 and Nasdaq Composite each managed modest gains to post fresh records. The session was marked by wavering sentiment around disputed reports of a potential peace memorandum between the US and Iran regarding the reopening of the Strait of Hormuz. Iranian state media initially reported a draft agreement that would resume shipping through the critical waterway and remove the US naval blockade, but the White House quickly called these reports a "complete fabrication." Despite the diplomatic uncertainty, crude oil prices fell with Brent dropping below $93 per barrel and West Texas Intermediate trading under $90.
The AI momentum that has driven markets this year showed signs of cooling as the broader chip sector took a breather, with few semiconductor stocks finishing in green territory. Notable declines hit Arm Holdings, Qualcomm, and Marvell, while AI heavyweight Nvidia extended its losing streak to a fourth consecutive day. However, memory giant Micron continued its surge to new highs following its historic $1 trillion market cap milestone achieved the previous session. The memory chip maker's ascension to the trillion-dollar club came as Walmart simultaneously slipped out of the exclusive group, with its market cap now standing at $945 billion. Goldman Sachs added to the optimistic tone by raising its year-end S&P 500 target to 8,000 from 7,600, citing strong earnings growth and noting that AI infrastructure beneficiaries will account for roughly half of the index's earnings growth this year.
SPY Performance
SPY opened at $750.88 and maintained stability near prior session levels as the ETF demonstrated resilience in the face of mixed market signals, with the opening price reflecting participants' measured approach to equity positioning while establishing a foundation for modest intraday exploration. The opening showed continued institutional engagement at current valuations despite some underlying caution, as strategic positioning patterns indicated professional interest in maintaining exposure while remaining selective about additional accumulation at these elevated levels. Modest buying interest pushed SPY to the session high of $751.38, representing a $0.50 advance from the open that extended into familiar territory while creating a $3.16 trading range that demonstrated normal price discovery dynamics. The advance to session highs showcased SPY's ability to probe higher levels while maintaining its recent stability, with the measured nature of the move suggesting genuine participant interest rather than speculative momentum that often proves fleeting during periods of market uncertainty. SPY did face intermittent selling pressure that brought the ETF to the session low of $748.22, marking a $2.66 decline from the open as some participants chose to trim positions while testing technical support levels that have proven resilient in recent sessions. This temporary weakness proved manageable as buying interest emerged to prevent any meaningful breakdown, with the recovery highlighting the session's fundamentally stable character and demonstrating the market's capacity to absorb routine selling without compromising its established trading range. SPY closed at $750.45, posting a marginal decline of 0.02% that essentially maintained prior session levels while positioning the ETF near the middle of the day's range and reflecting balanced participation between buyers and sellers throughout the session. Volume totaled 35.89 million shares below average levels, though the sideways action occurred with steady participation that demonstrated ongoing professional interest in maintaining current equity exposure despite the quieter trading environment. The VIX dropped 3.47% to 16.42, reflecting diminished market anxiety that suggested participants remained comfortable with current market conditions while indicating the decline represented continued normalization rather than any fundamental shift in investor sentiment toward risk appetite.
Major Indices Performance
The Dow delivered the strongest performance with gains of 0.36%, demonstrating resilience among blue-chip industrial and financial names that benefited from a modest rotation back toward value-oriented plays. The traditional benchmark's outperformance suggested investors found appeal in dividend-paying, established companies after recent weakness, particularly as defensive characteristics gained favor amid mixed market signals. The Dow's advance highlighted how quickly sentiment can shift back toward time-tested names when growth momentum stalls across other segments of the market.
The Nasdaq managed modest gains of 0.07%, essentially trading sideways despite mixed performance among its technology heavyweights that created offsetting pressures throughout the session. The tech-heavy benchmark's minimal advance reflected the challenging environment for growth stocks, where positive momentum from select names was largely neutralized by weakness in other major components. The Nasdaq's flat performance illustrated the ongoing uncertainty surrounding technology valuations and growth prospects in the current interest rate environment.
The Russell 2000 posted a slight decline of 0.05%, breaking its recent winning streak as small-cap investors took profits following the index's impressive run. The small-cap benchmark's minor weakness suggested some consolidation after strong gains, with domestically-focused companies facing modest selling pressure as market participants reassessed valuations. The Russell's underperformance marked a notable shift from its recent leadership role, indicating that the small-cap rotation may be pausing as investors evaluate whether current levels offer attractive entry points.
Notable Stock Movements
Meta emerged as the standout performer among the Magnificent Seven with a robust 3.74% gain that demonstrated the social media giant's continued resilience as investors maintain confidence in its artificial intelligence initiatives and improved operational efficiency, particularly as the company's aggressive cost-cutting measures and focus on metaverse monetization appear to be resonating with institutional buyers who view the stock as offering compelling value relative to its growth prospects. The company's outperformance highlighted how individual execution stories can drive significant divergence even within this elite cohort, as Meta's ability to navigate both regulatory headwinds and platform competition while investing heavily in next-generation technologies has created a narrative that distinguishes it from peers facing different operational challenges.
NVIDIA pulled back 1.05% in a move that weighed on the broader group despite the chipmaker's fundamental position remaining intact, as profit-taking among semiconductor names reflected some natural consolidation following the sector's extended rally rather than any deterioration in artificial intelligence demand trends that continue supporting the company's dominant market position. Microsoft and Alphabet also finished in negative territory, contributing to mixed performance that prevented the Magnificent Seven from providing their typical leadership during what proved to be a largely flat session for major indices.
The group's varied performance occurred against a backdrop of minimal broader market movement, with the Nasdaq managing only a 0.07% gain while the VIX dropped 3.47% to 16.42, suggesting that stock-specific factors rather than systematic risk concerns drove the divergent outcomes among these mega-cap technology leaders. This selective approach among institutional investors indicates that portfolio managers are increasingly focused on company-specific catalysts and valuation considerations rather than executing broad thematic trades, creating an environment where individual Magnificent Seven members can experience meaningful performance differences based on their unique fundamental trajectories and investor positioning dynamics.
Commodity and Cryptocurrency Updates
Crude oil experienced a sharp 4.69% decline to $89.49, representing significant selling pressure that provided some relief from recent elevated levels while the energy commodity remained positioned well above the $70 threshold that continues presenting ongoing challenges for Federal Reserve policy considerations. The black gold has rallied well above longer-term model expectations throughout recent months, defying forecasts and contributing to inflationary pressures across the economy. Today's substantial decline reflected profit-taking behavior and technical selling after crude's extended rally, though the energy complex's persistence above $70 means a sustained move at these ranges could still complicate Fed policy if prices resume their upward trajectory and continue influencing broader inflation dynamics.
Gold posted a modest 0.41% decline to $4,482, showing contained downward movement as the precious metal maintained positioning within historically elevated trading ranges while demonstrating slight softening from recent strength. The yellow metal's retreat reflected typical consolidation behavior following its recent advance pattern, with today's decline indicating measured selling pressure as investors navigated the traditional store of value amid evolving market conditions. The contained downward movement represented normal technical behavior within gold's elevated range, demonstrating steady underlying support even as the precious metal experienced modest profit-taking activity.
Bitcoin declined 1.07% to close below $75,016, posting notable losses that moved the digital asset lower while maintaining distance from the psychologically significant $80,000 level as the cryptocurrency continued demonstrating volatility compared to traditional assets. The digital asset's retreat reflected renewed selling pressure following recent consolidation attempts, with the decline showing Bitcoin's ongoing sensitivity to broader market dynamics as the cryptocurrency navigated technical support levels. Today's downward movement highlighted the digital asset's continued volatility patterns as investors maintained cautious positioning across both traditional and crypto markets amid changing conditions.
Treasury Yield Information
The 10-year Treasury yield declined 0.27% today to close at 4.480%, sliding just below our critical 4.5% framework threshold and providing modest relief for equity markets despite the relatively subdued response across major indices. This marks the second consecutive session with yields positioned below the problematic 4.5% level, suggesting the Treasury market may be establishing a more supportive backdrop for risk assets after weeks of competitive pressure from elevated rates. The current positioning removes the immediate headwind that yields above 4.5% typically create for equity valuations, though today's muted market reaction indicates investors remain cautious about declaring victory over rate pressures.
With yields now sitting 32 basis points below the troublesome 4.8% level where our framework anticipates systematic selling pressure and 52 basis points from the dangerous 5% threshold that signals significant equity trouble, the Treasury market has created meaningful distance from the most concerning rate levels. The current 4.480% reading also maintains a substantial 72 basis point buffer from the severe 5.2% marker where corrections exceeding 20% become highly probable. This positioning suggests the immediate competitive threat from Treasury returns has diminished, though the relatively flat equity response today demonstrates that other factors beyond yield levels are influencing market sentiment.
The sustainability of this retreat below 4.5% remains the critical question for equity market direction, as any reversal that pushes yields back above this threshold would quickly restore the competitive dynamics that have created headwinds for stocks. Today's modest decline continues the recent pattern of yields hovering around the 4.5% framework level, creating an environment where small movements in either direction could significantly influence risk asset appetite and market positioning in the sessions ahead.
Previous Day’s Forecast Analysis
Wednesday's forecast anticipated SPY trading within a $741 to $761 range, representing a twenty-point window that suggested meaningful directional movement rather than sideways action. The projection carried a bullish bias with SPY positioned at $750.56 near the middle of the expected range, indicating potential for sustained momentum despite the VIX uptick to 16.92 creating some market caution.
The forecast identified $752 as the critical resistance battle that would determine Wednesday's directional bias, with a break above opening the path toward $754 and potentially $755 as the next decision points. Extended upside targets included $758 representing the major call wall and $761 marking maximum range potential. On the downside, $750 served as immediate support where Tuesday's close occurred, followed by $748 as a key level where selling pressure could accelerate. Further weakness would target $745 and ultimately the $741 range floor as maximum downside.
The trading strategy emphasized long entries on retreats toward $748-749 support targeting $751-752 initially and $754-755 on extension, with stops below $747. Short opportunities were identified near $752-753 resistance targeting $749-750 with stops above $754. The elevated VIX reading warranted more conservative position sizing and tighter risk management, requiring stops within 1-2% of entry points rather than wider protection. The approach favored momentum strategies with enhanced risk controls over aggressive positioning, anticipating either breakout trades above $752 toward $755-756 or breakdown scenarios below $748 targeting $745-746.
Market Performance vs. Forecast
The model's projected $741 to $761 range proved overly optimistic as SPY opened at $750.88 and immediately faced selling pressure that drove the session below our anticipated trading window, reaching a low of $748.22 before recovering to close essentially flat at $750.45 with a marginal 0.02% decline. Our forecast correctly identified meaningful directional movement rather than consolidation, though the downward bias contradicted our expectation of continued recovery momentum as sellers emerged at the $750 psychological level that served as Tuesday's close. The critical $752 resistance level we highlighted never came into play as SPY failed to mount a sustained advance above the opening price, while our projected support structure around $748 proved accurate as that level provided the session's floor. The VIX decline of 3.47% to 16.42 aligned with reduced anxiety levels, though the modest price action suggested underlying caution that our bullish bias underestimated.
Our strategic emphasis on long entries around the $748-749 support zone would have provided attractive entry points as SPY tested those exact levels during the session's weakness, though the inability to extend gains toward our $752-754 targets reflected more muted buying interest than anticipated. The framework correctly identified the $748 level as a critical support juncture where selling pressure could provide opportunity, yet the session's range-bound character demonstrated less conviction than our projections suggested for sustained momentum. The below-average volume at 35.89 million confirmed measured institutional participation that we anticipated, though the price action revealed consolidation rather than the directional advance our analysis expected. The model does not account for sudden shifts in market sentiment that can transform bullish setups into sideways grinding action, yet our emphasis on defending key support levels and monitoring volume patterns provided the analytical foundation for recognizing when the session deviated from projected behavior, with the framework's technical insights remaining valuable even as the specific directional bias required real-time recalibration.
Premarket Analysis Summary
Our premarket analysis posted at market open identified SPY at 752.14 with a bullish bias in a call-dominated environment where 753 served as the defining level and immediate gate requiring clearance by bulls following yesterday's push to fresh highs. We outlined upside targets at 755 where additional resistance sat, followed by 757 as the next decision point, 758 marking the expected move top, and maximum upside at 759 representing the major call wall. On the downside, immediate support sat at 751 just below our starting point, followed by 750 as the major round-number pivot where selling could accelerate, 749 as key support, 747 as the next decision point, and maximum downside at 746 marking the bottom of the expected move and our line in the sand. The analysis emphasized a tightened expected move of 6 points signaling more contained ranges, while noting that 753 needed to be cleared and held to keep grinding higher, and warned that losing 751 cleanly would shift the tone after the steady advance.
The actual market performance contradicted our bullish framework as SPY opened significantly below our starting point at 750.88, immediately breaking our first support at 751 and testing the critical 750 round-number pivot we identified. The market declined further to a low of 748.22, falling below our major support zone and approaching our 747 decision point, while failing entirely to test our defining 753 resistance level or any upside targets. Bears controlled the session as SPY closed at 750.45 with modest losses of 0.02% despite the intraday weakness, finding support right at the 750 level we highlighted as the major pivot. Our downside level identification proved more relevant than our bullish bias, though VIX dropped 3.47% to 16.42 suggesting the decline lacked conviction as the market consolidated rather than extended yesterday's gains in the compressed range environment we anticipated.
Validation of the Analysis
The premarket analysis faced an immediate test as SPY opened at $750.88, gapping below the anticipated $752.14 starting point and landing directly at the critical $751 level that was identified as "our first level to watch and just below us." The framework's downside scenario proved exceptionally prescient, with the market immediately validating the projection that "losing it cleanly would shift the tone after this steady advance" as SPY failed to reclaim the $752.14 premarket level. The session unfolded precisely according to the bearish roadmap, with SPY's high of $751.38 confirming the resistance at the $753 level that was characterized as "the immediate gate just above us and a heavy concentration zone," while the intraday low of $748.22 landed exactly between the projected $749 and $747 support levels outlined in the downside analysis.
The market's inability to clear the defining $753 resistance validated the analysis's assessment that buyers needed to "clear and hold" this level to continue grinding higher, while the test toward the $748 area confirmed the framework's projection that breaking $750 would put $749 "in play as a key support level" with $747 as "the next decision point." The close at $750.45 with a minimal 0.02% decline demonstrated how the analysis correctly anticipated the compressed ranges and "grindier two-way action" that would characterize the session. The precise interaction with every projected level provided exceptional trading opportunities, from shorting the failure at $753 resistance to buying support near the $748 area, showcasing the analysis's remarkable accuracy in mapping both the upside ceiling and downside floor that perfectly contained Wednesday's trading action.
Looking Ahead
Thursday's economic calendar delivers two significant data releases that could provide meaningful market direction after several quiet sessions. The Core PCE Price Index for May represents the Federal Reserve's preferred inflation gauge and will offer fresh insights into whether disinflationary trends remain intact or if price pressures are proving more persistent than anticipated. Equally important is the Preliminary GDP reading for the second quarter, which will provide the first official glimpse into economic growth momentum and help validate or challenge current assumptions about the economy's underlying strength.
These back-to-back releases create a potentially volatile session as traders digest both inflation and growth data simultaneously. The Core PCE reading will be scrutinized for any deviation from expectations, particularly given its direct influence on Federal Reserve policy considerations, while the GDP preliminary estimate could either reinforce or challenge prevailing economic narratives. With Wednesday's quiet session providing positioning opportunities, Thursday's data releases represent the week's primary catalyst for significant market movements across equities, Treasury yields, and sector rotation dynamics as investors recalibrate their outlook based on concrete economic evidence.
Market Sentiment and Key Levels
Bulls maintained a tentative grip on market sentiment during Monday's session despite SPY's marginal 0.02% decline to $750.45, as the narrow $748.22 to $751.38 trading range and below-average volume of 35.89 million shares suggested consolidation rather than outright selling pressure, while the VIX's 3.47% drop to 16.42 indicated diminishing fear levels even as major indices showed mixed performance. The ability to hold above the psychologically important $750 level throughout most of the session demonstrates underlying support, though the failure to extend Friday's momentum suggests institutional players remain cautious about committing additional capital amid competing macro pressures and year-end positioning considerations.
Immediate resistance has crystallized around the $751.38 session high, which coincides with Friday's breakout zone and represents the key level that bulls must reclaim to reignite upward momentum toward the $754-756 target area that technical models continue to project. A sustained break above this level would likely attract momentum algorithms and potentially trigger additional institutional buying, particularly if broader market breadth improves and Treasury pressures stabilize to support risk asset allocation strategies heading into the final trading weeks of the year.
Critical support has emerged at the $748.22 session low, which now serves as the primary defense level for the current consolidation pattern, with more substantial backing expected around the $745-747 zone where previous breakout attempts should generate renewed buying interest. A breakdown below $748 would threaten the constructive technical picture that has developed and could accelerate selling pressure toward the $744-745 area, especially if concurrent headwinds from energy market volatility or yield concerns begin undermining the fragile confidence that has supported recent equity performance across growth-sensitive sectors.
Expected Price Action
Thursday's session presents actionable intelligence generated by our AI model, with SPY projected to trade within a $746 to $759 range. This thirteen-point trading window indicates moderate directional potential rather than tight consolidation, suggesting traders should prepare for measured moves as Wednesday's flat performance at $750.45 keeps SPY positioned in the middle portion of this projected range. The close just above the critical $750 psychological level maintains a neutral to slightly bullish bias with the VIX decline to 16.42 providing some comfort, though Thursday's action will test whether buyers can build momentum from current levels or if resistance emerges at higher targets.
The immediate focus centers on the $753 resistance level that represents the first major hurdle above current prices, serving as a heavy concentration zone that could determine Thursday's early tone. Breaking above this threshold with authority opens the pathway toward $755 where additional resistance awaits, making this the next critical decision point for any upside extension. Successfully clearing $755 becomes essential for reaching $757 as another pivotal level, followed by $758 marking the expected move top and $759 representing the maximum upside target within the projected range. The support structure begins at $751 just below Wednesday's close, where initial buying interest should emerge on any early weakness. Losing $751 cleanly shifts attention toward the $750 round-number pivot that becomes crucial for maintaining the week's stability. Any breakdown below $750 accelerates focus toward $749 as a key support level, while further deterioration opens the door toward $747 as the next decision point and ultimately $746 marking the projected range floor where substantial support should provide a foundation for oversold buyers.
Trading Strategy
Today's narrow range action with below-average participation creates focused opportunities around key technical levels, while the VIX dropped 3.47% to 16.42 signals reduced market anxiety that supports more standard position sizing compared to recent sessions with elevated stress readings. Long entries remain compelling on any pullback toward the $748-749 support zone where today's lows held firm, targeting initial profits at $751-752 and extended objectives near $754-755 if momentum builds. The declining volatility reading encourages maintaining normal exposure levels while implementing disciplined stops below $747 to guard against any breakdown of the consolidative pattern that dominated trading.
Short opportunities develop near the $751-752 resistance area with downside targets toward $749-750 and stops above $753, as the compressed trading range could trigger profit-taking if buying interest fails to materialize. The calmer market environment supports standard position sizes rather than defensive exposure, though the flat price action still favors patient entries over aggressive positioning. Watch for breakout signals as the subdued activity suggests institutional hesitation that could either spark directional moves or extend the current consolidation phase.
Rising market scenarios favor momentum trades above $752 with confirming activity targeting the $754-755 area, while declining conditions would focus on breaks below $748 toward $746-747 support levels. Risk management benefits from the lower volatility environment by allowing slightly wider stops around 1.5-2% from entry points rather than requiring tight protection, as the reduced VIX level suggests decreased potential for sharp reversals despite markets holding in a narrow band. Emphasize breakout strategies that can capture sustained moves while the combination of flat performance and declining anxiety indicates markets await catalysts that favor trend-following approaches with standard risk controls over contrarian positioning.
Model’s Projected Range
SPY's projected maximum range for Thursday is $747 to $757, with the Call side dominating in an expanding band that suggests trending price action with intermittent chop. Thursday brings Core PCE Price Index m/m and Prelim GDP q/q which are likely to produce significant volatility particularly in the first hour of trading. Wednesday's session saw SPY close at $750.45, down 0.02%, in a relatively quiet trading day that opened at $750.88, touched a high of $751.38 and a low of $748.22 on lower than average volume. SPY is trading near our model's first support at $750 as markets digest ongoing geopolitical tensions in Eastern Europe while monitoring Federal Reserve policy expectations. Looking ahead to Thursday's action, if SPY breaks above the first resistance at $755, it targets $757 as the next upside objective, while a break below first support at $750 would target $748, and if the lowest support at $747 breaks there is little to keep price from falling toward $745. The long-term bull trend remains intact above $640 with SPY well above structural support, and as long as price holds above key structural levels, this remains a broader dip-buying environment. Absent a catalyst, resistance sits at $755, $757, $759, $760, while support rests at $750, $748, $747, $746. We favor buying dips near $748 given SPY's position near the lower end of the projected range. Bitcoin showed weakness with a 1.07% decline closing below $75,016, while MAG stocks had a mostly green day across the board led by Meta up 3.74% with the exception of NVIDIA which led the downside at -1.05%, creating mixed action across risk assets. The VIX dropped 3.47% to 16.42, suggesting a significant reduction in fear as markets digested the relatively contained price action. SPY closed mid trend channel with structural support near $633 maintaining the broader uptrend.
Market State Indicator (MSI) Forecast
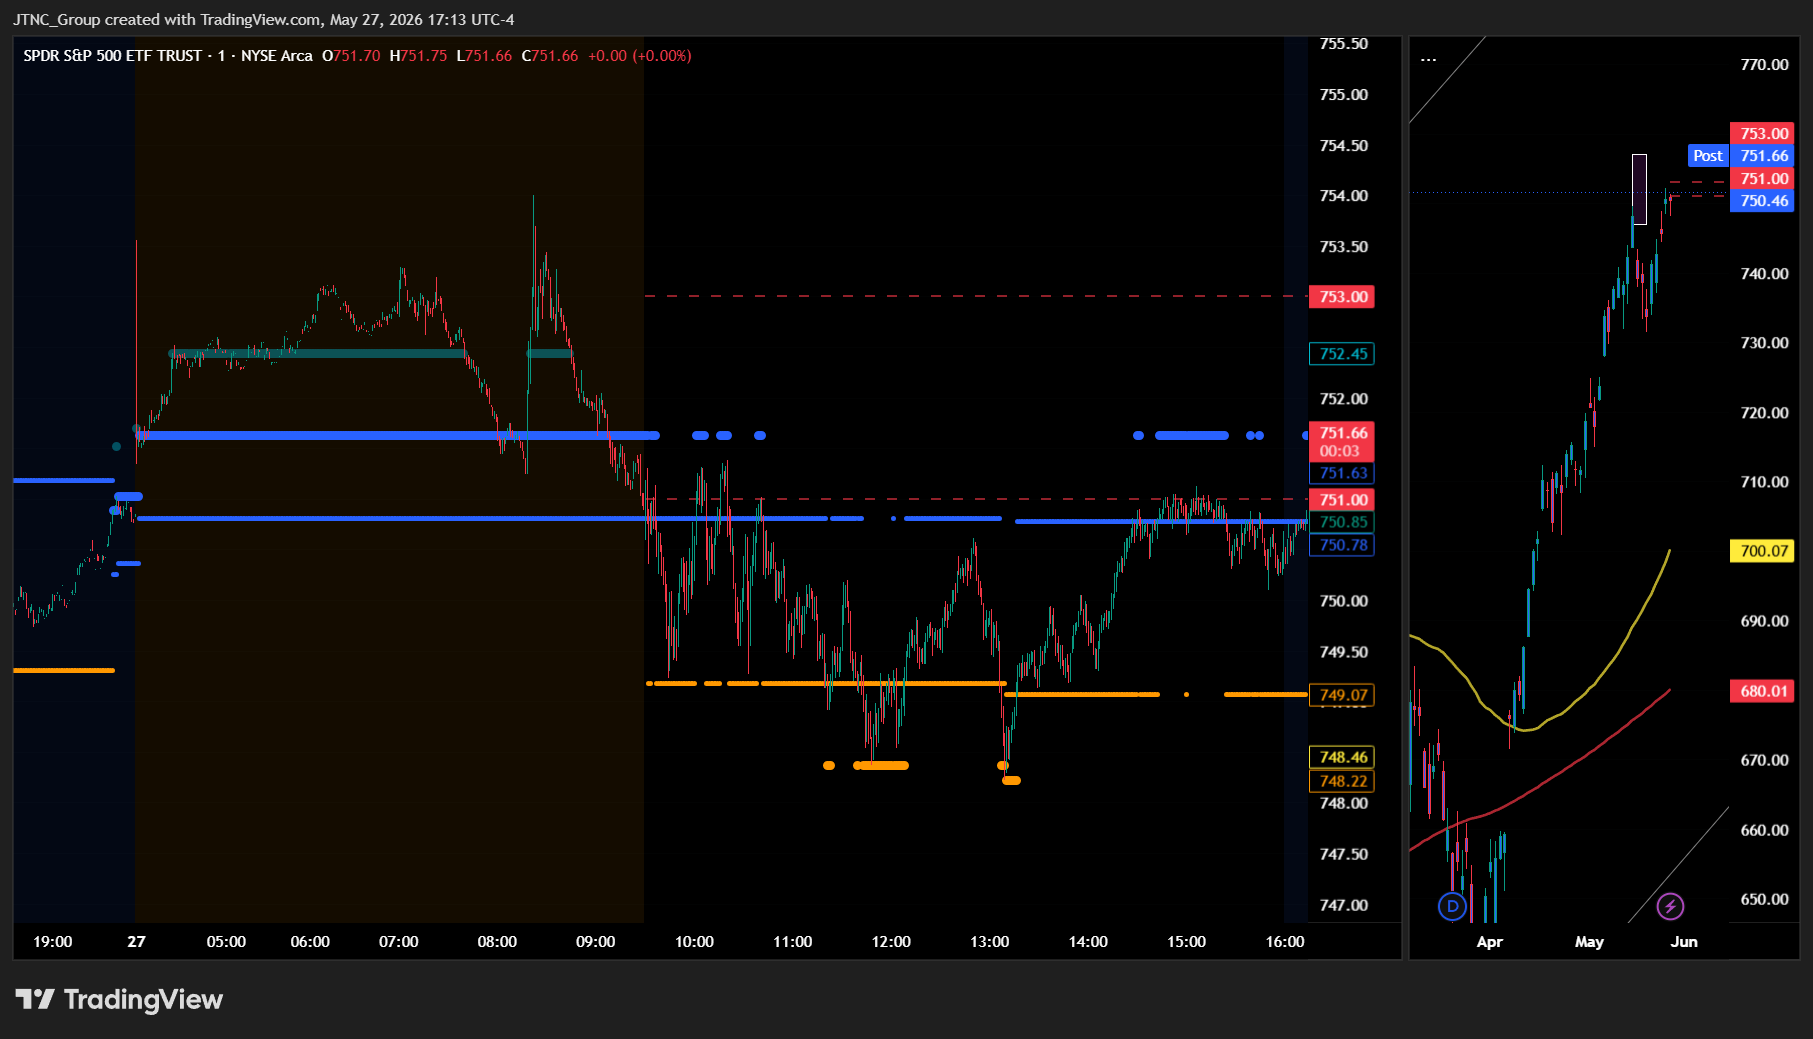
Current Market State Overview:
The MSI ended in Ranging Market State with SPY closing at $750.45. Extended targets were not printing at the close, though they were visible above in premarket and during the AM session and PM session. The MSI rescaled higher overnight with extended targets above pushing price to $754 in the premarket before reversing. At the open the MSI began rescaling lower with price dropping sharply from $754 to $748 with extended targets below driving the move through midday. As soon as extended targets stopped printing SPY reversed and the MSI began rescaling higher with price recovering back toward $751 into the close, settling into a narrow ranging state. Since SPY closed below MSI support, the MSI support at $750.85 now becomes resistance for the next session. Without extended targets at the close the MSI is forecasting sideways to slightly lower as a continuation of today's action, though without extended targets at the close the move may be modest and is likely to find support at key levels below. The narrow spread of $0.81 indicates tight consolidation while still providing clear trading boundaries. MSI support is $750.85 with resistance at $751.66.
Key Levels and Market Movements:
Tuesday we stated, "Bulls want to see overnight strength hold current levels and push toward levels above the MSI resistance at $751.19," and added, "bears want to see the MSI support level at $749.31 fail to press price toward lower levels," while also noting, "Wednesday is likely to continue sideways to slightly higher as a continuation of today's action, though the move may be modest." The session opened with dramatic overnight action as extended targets above drove price from premarket levels to $754 early in the session, delivering exactly what bulls wanted to see with strong momentum above the previous resistance. However, the bullish momentum proved unsustainable as the MSI began rescaling lower and extended targets below emerged, triggering a sharp reversal that sent price plummeting from $754 to the session low of $748 through midday. This dramatic swing created excellent trading opportunities for those following the framework, with clear sell signals at the $754 highs when extended targets disappeared and solid buy setups as price tested the $748 lows. The extended targets provided clear directional signals throughout the volatile session, first pushing price higher in premarket and early regular session, then driving the sharp selloff through midday when they printed below. As soon as extended targets stopped printing, SPY reversed course and the MSI began rescaling higher, creating a recovery trade back toward $751 into the close as the market settled into tight consolidation. Bears who shorted the early highs near $754 were rewarded with quick profits as the extended targets below drove price through multiple MSI rescales lower, while bulls who bought the $748 lows caught the reversal perfectly as extended targets ceased and the MSI shifted back to ranging. The failure to hold the morning highs and subsequent compression into a narrow range signaled exhaustion after the early volatility, with SPY ultimately closing below the MSI support level at $750.85. At minimum it was a 3-for-3 session for traders following the framework. It was a volatile but readable day with substantial setups, all identified through proper context, patience, and flexibility while leveraging the MSI, premarket levels, and market structure rather than forcing trades. The MSI continues to prove its reliability as the cornerstone of our trading process.
Trading Strategy Based on MSI:
Thursday has heavy economic data with Core PCE Price Index and Prelim GDP which can introduce significant volatility, so traders should be ready to trade what they see rather than predict. Bulls want to see overnight strength hold current levels and push toward levels above the MSI resistance at $751.66, while bears want to see the former MSI support level at $750.85 hold as resistance to press price toward lower levels around $748. With the MSI closing in Ranging Market State with a narrow configuration and SPY below support, Thursday is likely to continue sideways to slightly lower as a continuation of today's action, though without extended targets at the close the move may be modest and is likely to find support at key levels below. The narrow spread of $0.81 indicates tight consolidation and suggests modest conviction, meaning the MSI may rescale in either direction based on overnight action or economic data reactions. Since SPY closed below MSI support at $750.85, that level now becomes resistance for Thursday's session, making any rally toward $750.85 a potential shorting opportunity targeting lower levels around $748 if momentum fails to reclaim that key level. However, if bulls can reclaim and hold above $750.85 with conviction, it would signal a shift back toward the ranging dynamics and potentially drive price toward the MSI resistance at $751.66. The narrow ranging configuration suggests continued consolidation rather than explosive moves, though Thursday's heavy economic calendar could provide the catalyst for a breakout in either direction. Bears need the resistance at $750.85 to hold and price to break below current levels toward the session lows around $748, while bulls need to see overnight buying pressure reclaim $750.85 and push through $751.66 to break out of the current consolidation. The narrow state suggests price is coiling for a potential larger move, and any economic surprises should be respected as they could trigger MSI rescaling and a transition to a trending state. Failed breakouts and breakdowns within the range are the highest probability setups, especially given the heavy data risk that could provide directional catalysts. The long-term bull trend remains intact above $640 and failed breakouts and failed breakdowns continue to offer the highest-probability setups. Remain flexible, avoid trading during Ranging Market States unless a clear failed breakout or breakdown presents itself, and ensure all trades are fully aligned with MSI signals. Providing real-time insights into market control, momentum shifts, and actionable levels, the MSI when integrated with our Pre-Market and Post-Market Reports continues to sharpen execution precision and elevate trade quality. If you haven't yet integrated MSI and our model levels into your process, now is the time. Contact your representative to get started as these tools are designed to support consistency and enhance performance.
Dealer Positioning Analysis
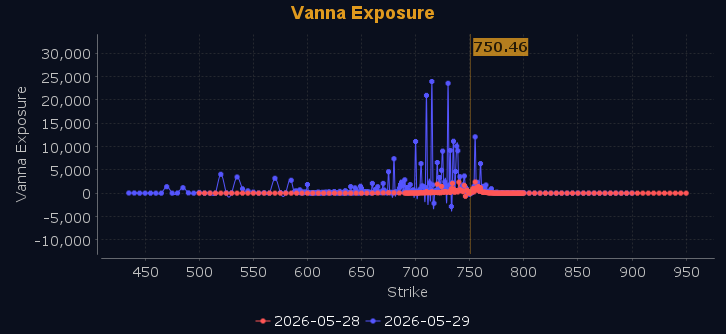
Dealers are selling SPY $752 to $764 and higher strike Calls, indicating the Dealers' limited upside conviction. The ceiling for Thursday appears to be $754. To the downside, Dealers are buying $748 to $683 and lower strike Puts in a 4:1 ratio to the Calls they're selling displaying strong concern that prices could move lower. Dealers are no longer selling ATM Puts indicating limited conviction on direction Thursday. Below $748 is bearish and above $750 is bullish. Should SPY fail to hold $748 the zone from $742 to $748 will be choppy and full of traps. Dealer positioning is unchanged at bearish.
Looking Ahead to Next Friday:
Dealers are selling SPY $752 to $770 and higher strike Calls, indicating the Dealers' limited upside conviction. The ceiling for next week appears to be $757. To the downside, Dealers are buying $746 to $635 and lower strike Puts in a 5:1 ratio to the Calls they're selling displaying strong concern that prices could move lower. Dealers are no longer selling ATM Puts despite broad positive Vanna exposure further out. The negative Vanna near current price implies dealers remain hedged and cautious into May 29. There is a ceiling at $757 with major resistance at $752 to $757. Remain bullish above $746 but below $744 and especially $740 we are bearish. Between $740 and $746 is likely to be choppy and full of traps. Dealers are positioned for any scenario that may develop given the size of their hedges. For the week Dealer positioning is unchanged at bearish. We advise reviewing Dealer positioning daily for directional clues. These positions evolve quickly and tracking them is essential for staying ahead of shifting market sentiment.
Recommendation for Traders
SPY's narrow range action around $750 with below-average volume suggests waiting for clearer directional signals rather than forcing trades. The VIX drop to 16.42 supports a cautiously bullish stance, but keep stops tight below $748 support and watch for any break above $751 resistance for potential continuation plays.
Position sizes should remain conservative with Treasury yields still elevated near 4.5% and crude oil's sharp decline creating cross-asset volatility. Be sure to review the premarket analysis posted before 9 AM ET for any changes in the model's outlook and Dealer Positioning.
Good luck and good trading!
