Market Insights: Tuesday, May 27th, 2025
Market Overview
Markets kicked off the week with a resounding rally Tuesday after President Trump backed off his proposed 50% tariffs on European Union imports, opting instead for fast-tracked trade talks. The move helped restore some investor confidence following last week’s turbulence and sparked a broad-based rally across equities. The Nasdaq led the charge with a 2.5% gain, bolstered by strength in tech, while the Dow added over 700 points, up 1.82%, and the S&P 500 climbed 2.08%. Sentiment was further buoyed by a rebound in consumer confidence, snapping a five-month losing streak, which aligned with the administration’s temporary softening on its harshest trade rhetoric.
Behind the scenes, a slip in global bond yields also contributed to the equity surge. Treasurys rallied after reports suggested Japan would scale back bond sales, calming recent turmoil in global fixed income markets. The 30-year U.S. yield dipped to around 4.94%, down from recent highs. On the geopolitical front, the EU’s willingness to accelerate tariff negotiations with the U.S. significantly reduced fears of a trade war escalation. President Trump’s decision to delay the tariff hike until July 9 gave markets room to breathe and recalibrate.
As focus shifts to economic data later in the week, investors are also eyeing Fed commentary and the Senate's response to Trump’s controversial tax bill. Meanwhile, Nvidia grabbed headlines after reports it would offer a lower-cost chip variant for the Chinese market. The AI giant reports earnings Wednesday, likely the most anticipated release of the season, with Okta, Macy’s, and Costco also on deck. The tone was decisively risk-on, with the Nasdaq leading a charge that reflected a return to bullish optimism.
SPY Performance
SPY soared 2.08% on Tuesday, closing at $591.15 after opening at $586.04. The ETF touched a high of $591.31 and dipped to an intraday low of $578.43 before powering higher in the afternoon. The rally marked a full recovery from Friday’s steep losses and confirmed a breakout above the critical $585 resistance level. Volume hit 69.24 million shares, slightly above average, reinforcing strong buyer participation and bullish conviction following the weekend’s geopolitical developments.
Major Indices Performance
The Nasdaq posted the biggest gain of the day, rising 2.47% as tech stocks stormed back amid easing trade tensions and a drop in yields. The Russell 2000 also surged 2.47%, signaling a broad-based risk appetite across small caps. The S&P 500 rose 2.08%, while the Dow trailed slightly with a 1.82% advance. Investors cheered the White House’s decision to delay EU tariffs, which was compounded by stronger consumer confidence data and a softening bond market. Sector-wise, growth-oriented areas such as technology and consumer discretionary led the way, while defensives lagged, reflecting a clear rotation back into risk assets.
Notable Stock Movements
The Magnificent Seven enjoyed a sweeping rally, led by Tesla’s 6.9% jump after bullish analyst commentary on its energy segment. Nvidia rallied more than 2% ahead of its highly anticipated earnings report, boosted further by reports of a new chip aimed at sidestepping export controls. All other names in the group, Apple, Amazon, Alphabet, Meta, and Microsoft, rose over 2% as confidence returned to high-growth tech. The group’s performance captured the market’s mood shift, with investors quickly returning to mega-cap names amid retreating trade and fiscal worries.
Commodity and Cryptocurrency Updates
Crude oil slipped 0.76% to settle at $61.06, resuming its longer-term downtrend despite a modest decline in the dollar. While short-term fluctuations remain possible, our model continues to forecast a drop toward $50, where we expect stronger buying interest to emerge. Gold dropped 1.90% to $3,330 as safe-haven flows reversed in favor of equities. Meanwhile, Bitcoin edged up 0.27% to close above $109,900. Our strategy remains unchanged: buy between $83,000 and $77,000 and avoid entries below $77,000 due to increased downside risk.
Treasury Yield Information
The 10-year Treasury yield fell to 4.455%, down 1.24% on the day, providing tailwinds for equities. Lower yields helped relieve recent pressure on valuations and contributed to the bounce in tech. The 30-year yield dipped to 4.94%, signaling a slight cooling of fiscal anxieties after Japan's plans to limit bond supply. Despite the decline, yields remain elevated and could reaccelerate later in the week depending on incoming data. Markets remain sensitive to any move back toward 4.8% or higher on the 10-year, which could rekindle selling pressure in equities.
Previous Day’s Forecast Analysis
The prior forecast projected a range of $575 to $585 with a slightly bearish bias while SPY remained under $585. Upside targets were marked at $587 and $592, while key support stood at $575 and $573. The strategy leaned toward short setups under resistance and called for caution on longs unless SPY reclaimed $583 and held above $585. A break below $575 was expected to trigger downside toward $570 and potentially the May 9 gap at $564. Traders were advised to react to SPY’s interaction with $575 and $585 as the decisive battle zone for direction.
Market Performance vs. Forecast
Tuesday’s action decisively outpaced the prior day’s forecast. SPY opened at $586.04, dipped early to $578.43, and then staged a sharp rally to close at $591.15, blasting through the $585 resistance zone. The move negated the slightly bearish bias and validated the alternate bullish scenario if $585 was reclaimed. While the initial drop to $578 aligned with the forecast’s support range, the powerful reversal exceeded expectations. The move above $585 triggered the upside toward the next targets of $587 and $592, in line with the model's upside levels. Traders who shifted to long positions after the reclaim of $585 likely captured significant gains, validating the forecast’s emphasis on reacting to SPY’s behavior around key resistance.
Premarket Analysis Summary
In Tuesday’s premarket analysis posted at 8:06 AM, SPY was trading at $587.39, and the bias level was identified at $587. The forecast favored long trades above this level, with targets at $590, $595, and a maximum at $598. On the downside, support was noted at $587, $581, and $575. The note advised that as long as $587 held, the market could drift higher. A loss of this bias level would likely result in consolidation. Short setups were expected to be difficult to execute due to an anticipated absorption of aggressive selling pressure, while dip buys were favored near support zones.
Validation of the Analysis
Tuesday’s session played out in near-perfect alignment with the premarket roadmap. SPY opened slightly below the premarket price, dipped to $578.43, just above the lower target of $575 before reclaiming $587 and rallying sharply. Once the bias level was regained, SPY marched past $590, closing just shy of the next upside target at $592. The analysis accurately flagged $587 as the critical pivot and suggested long trades on strength above that level, which produced strong gains. Traders who bought dips near support and held through the reclaim of $587 saw excellent results. The reliability of the levels and strategic guidance provided another high-confidence day for active traders.
Looking Ahead
Wednesday’s spotlight turns to the FOMC Minutes, but expectations for major surprises are low. Markets may drift until Thursday’s more impactful Preliminary GDP and Unemployment Claims. Given Tuesday’s bullish surge, traders will be closely watching whether momentum can carry through key resistance or whether a pause sets in ahead of economic catalysts. With the tariff pause calming nerves, attention will likely shift toward inflation and growth outlooks as traders brace for potential volatility later in the week.
Market Sentiment and Key Levels
SPY closed at $591.15 and remains within a steep bullish trend channel that’s been building since April. Sentiment is back to leaning bullish, with Tuesday’s broad rally signaling renewed confidence. Resistance now stands at $591, $594, $595, and $600. Support levels are found at $590, $588, $587, and $582. A sustained hold above $588 could fuel further gains and open the door to retesting the April high at $597. However, a drop below $587 would suggest weakening momentum and could bring $582 and $580 back into play. With markets in recovery mode, traders should monitor these levels closely for any signs of a shift in trend or renewed volatility.
Expected Price Action
Our AI model projects a trading range between $584.50 and $598.25 for Wednesday, implying a moderately wide range with potential for trending action. The bias has shifted bullish, supported by the strong close above $585 and dominant call activity. If SPY holds above $588, the market is likely to retest $594 and $595, with a shot at $598. A break above $600 could trigger new all-time highs. If price fails to hold $588, a drop back toward $582 and $580 is likely, and below that the momentum could unwind. This is actionable intelligence, and traders should stay alert for tests of $588 and $595 as key inflection points heading into the middle of the week.
Trading Strategy
Traders should favor long setups above $588 with upside targets at $594 and $595. If $595 breaks, look for an extension to $597. Tighten stops as SPY approaches upper resistance and take profits into strength. If SPY fails to hold $588, shorts may be attempted with downside targets at $585 and $582, though short setups carry a lower probability in this bullish environment. Volatility has eased, with the VIX dropping 7.78% to 18.97, well below the danger zone, signaling an improved risk backdrop. However, with the FOMC Minutes ahead, traders should remain nimble and reduce size near key data releases. Use wide stops only when justified by strong trend confirmation and avoid overexposure while the market seeks its next catalyst.
Model’s Projected Range
The model’s maximum projected range for Wednesday is $584.50 to $598.25, with the Call side dominating in a narrowing range suggesting choppy price action with periods of trending behavior for Wednesday. FOMC minutes will be released tomorrow, but they are unlikely to significantly move the market. No other major economic releases are expected, though there remains the ever-present risk of unexpected news from the White House. Today, markets rallied sharply following the administration’s decision to pause its proposed 50% tariffs on the EU. With this move, the SPY has fully recovered from Friday’s sell-off, climbing over 2% to $591, well above the $585 level where bears had previously entered the picture. Bulls are now back in the driver’s seat, and momentum suggests the market is poised to move higher. Our model has shifted accordingly and now reiterates that the odds favor SPY testing its April highs at $597 before any meaningful pullback. It’s increasingly plausible that the market could make a new all-time high from the launch pad established today. Key resistance levels now stand at $591, $594, $595, and $600. On the downside, support is seen at $590, $588, $587, and $582. With today’s rally breaching every major resistance level, a wall is forming above $595, but above $600, there’s little standing in the way of new highs. Below $587, support begins to fade, and beneath $580, it all but disappears. This suggests a trading range of $580 to $600 may persist before a breakout. Bears are currently hibernating, with the steep bullish trend channel firmly intact. Unless an external catalyst intervenes, bulls will aim to break through $595 and then $597 to set up a run at all-time highs. As long as $588 holds on Wednesday, a move to $595 looks likely. However, if $588 fails, and particularly if $585 breaks, SPY could retrace sharply, inviting bears back into the picture. The $565–$585 zone remains a battleground, where institutions have been paring positions and increasing downside protection. Today’s trading volume was slightly above average, lending credibility to the strength of the rally. Since early April, key market drivers have included macroeconomic developments, bond yields, inflation data, tariffs, and fiscal policy. These themes are expected to remain dominant unless there’s a notable policy shift. The VIX dropped sharply by 7.78% to 18.97, well below the critical 23 level that typically favors bullish momentum. SPY now sits near the midpoint of the bullish trend channel formed since April’s lows. Given lingering volatility and ongoing macro uncertainty, traders should stay nimble and responsive to evolving price action in the coming days.
Market State Indicator (MSI) Forecast

Current Market State Overview:
The MSI is currently in a wide Bullish Trending Market State, with SPY closing well above resistance turned support. Overnight the MSI rescaled higher to its current state and printed extended targets both in the overnight session and for most of the trading day today. SPY bounced off MSI support at the open which set up the day’s move to above $591. With the new EU tariffs on hold until July 9th, the market ripped yet the MSI did not rescale all day. This kept price relatively contained from moving any higher. Extended targets, however, printed virtually all day which led to the one-way rally into the close. A wide MSI with extended targets favors a continuation of the rally overnight. MSI support stands at $584.59, with resistance turned support at $588.25.
Key Levels and Market Movements:
On Friday, we noted: “A lot can happen over a long weekend, so take today’s guidance with a grain of salt.” We also stated: “Our models suggest $585 will attract sellers and is unlikely to be reclaimed easily without some supportive news from Washington.” Well supportive news did emerge out of Washington over the weekend. When that happens, our consistent advice is to trade what you see. And today, all we saw was the bulls taking full control from the bears, driving prices back toward the April highs. With this context, and following a massive premarket rally and gap up, we waited for SPY to test MSI support before entering long at 9:34 am. A less-than-perfect failed breakdown setup formed at MSI support, triggering our long entry at $585, with an initial target of $588.25. That target was hit by 10:30 am, so we shifted our focus to a second target at the premarket level of $590. As extended targets came into play, we reached $590 shortly after 12:30 pm. At that point, we moved our stop to breakeven and trailed the remaining 10% of the position to see how far the rally could run. By the close, price had reached $591, so we exited the final portion just before the close to avoid MOC orders starting the week with a fabulous long trade, in line with the trend, that paid handsomely. Once again, we followed our plan. Thanks to the MSI’s clarity in identifying market control, timing shifts, and actionable levels, we entered with precision and exited with discipline. When combined with a structured trading process and our model’s key levels, the MSI proves to be a powerful tool for consistent performance. We continue to strongly recommend incorporating the MSI into your approach, as it helps align you with dominant market forces, avoid traps, and execute with confidence.
Trading Strategy Based on MSI:
After a surprise pause on Euro tariffs, the market delivered a strong rally, with more gains likely ahead, barring any major developments out of Washington. Following a day like this, some follow-through can be expected as long as $588 holds. Wednesday’s potential peak is $595, though $597, the March highs, remains the short-term target for the bulls. If $588 fails, the bulls may allow a pullback to $585, a critical level that must hold for them to maintain full control. A breakdown below $585 likely sends price back into the $565–$585 zone, where institutional players have been hedging their long exposure. Absent that kind of sell-off, the path of least resistance appears higher, potentially breaking March’s highs. Should that happen this week, new all-time highs are very much on the table. We continue to favor longs on pullbacks to as low as $585 and see potential for tactical shorts above $595, but only on a failed breakout with a weakening MSI. Currently, the MSI is strong, in a wide bullish state with extended upside targets into the close. This is not an environment to fade. Above $585, traders should focus on long setups. Below that, bearish pressure may return, though modestly. While sideways action over the next day or two could favor two-way trading, we’re hesitant to recommend shorts unless the setup is clean. Failed breakdowns also offer excellent long opportunities. Don’t hesitate to join the uptrend when they appear. As always, align your strategy with the MSI and avoid trading during a Ranging Market State. Stay disciplined and responsive to market structure shifts. The MSI provides powerful, real-time insights into momentum and structure. When paired with our Pre-Market and Post-Market Reports, it helps identify high-probability setups and precise entries, keeping you in sync with the tape and helping avoid costly mistakes. If you haven’t yet incorporated the MSI and model levels into your trading, now is the time. Contact your representative to get started as these tools can make a real difference in both performance and consistency.
Dealer Positioning Analysis
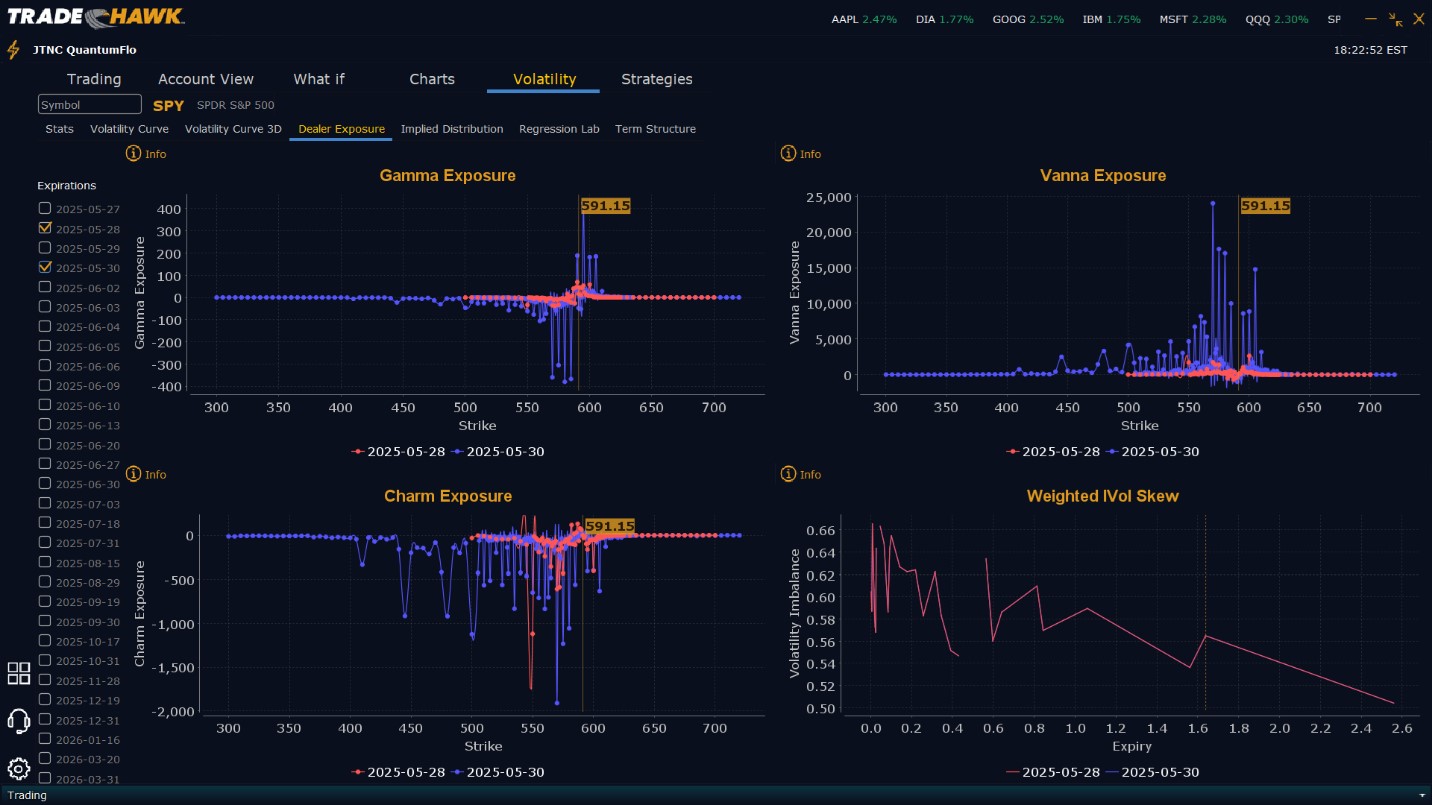
Summary of Current Dealer Positioning:
Dealers are selling $592 to $605 and higher strike Calls while selling $591 to $582 Puts. Dealers only sell close to the money Puts when they are convinced price will move higher. Dealers appear to project a ceiling for Wednesday at $595. To the downside Dealers are buying $581 to $550 and lower strike Puts in a 2:1 ratio to the Calls/Puts they are selling/buying, implying a neutral posture for Wednesday. Dealer positioning has changed from slightly bearish to neutral.
Looking Ahead to Friday:
Dealers are selling $591 to $610 and higher strike Calls while selling $590 and $586 Puts indicating the Dealers belief that prices will continue to rally into Friday, but not beyond $600. To the downside, Dealers are buying $585 to $500 and lower strike Puts in a 3:1 ratio to the Calls/Puts they’re buying/selling, reflecting a slightly bearish outlook for the rest of the week. Dealer positioning has changed from bearish to slightly bearish. We advise reviewing Dealer positioning daily for directional clues. These positions evolve quickly and tracking them is essential for staying ahead of shifting market sentiment.
Recommendation for Traders
SPY has cleared the $585 barrier and closed well above it, reclaiming bullish momentum and placing the burden back on the bears. Long trades are favored while SPY holds above $588, targeting $590, $593, and $595. Short trades may be attempted if SPY fails below $588, with quick exits advised due to lower odds. If price fails below $582, the market could reverse sharply. The VIX closed at 18.97, signaling lower volatility but traders should remain cautious ahead of Wednesday’s FOMC Minutes. Use tight stops on both sides of the market and reduce position sizes around key levels. Review the premarket analysis posted before 9 AM ET to account for any changes in the model’s outlook and in Dealer Positioning.
Good luck and good trading!
