
Market Insights: Friday, May 22nd, 2026
Market Overview
US stocks climbed Friday morning as investors continued tracking the uncertain progress of US-Iran peace negotiations, with the Dow extending its record-setting run with another 0.6% gain while the S&P 500 added 0.4% and the Nasdaq rose 0.2%. The S&P 500 locked in its eighth consecutive weekly win, marking the longest weekly winning streak since 2023, as markets found reasons for optimism despite ongoing concerns about inflation and Federal Reserve policy. Secretary of State Marco Rubio and Iranian media continued signaling progress on talks mediated by Pakistan, though clear sticking points remain over Iran's uranium stockpile and Strait of Hormuz disputes, keeping oil prices volatile with Brent crude at $103 per barrel and WTI at $96.
The market's resilience showed as President Trump officially swore in Kevin Warsh as the new Fed chair Friday afternoon, with Warsh promising to lead a "reform-oriented Federal Reserve" as he takes over during tricky economic conditions including renewed inflation pressures from oil price shocks. Hardware stocks provided a major boost to the session after Lenovo reported its highest PC, tablet, and smartphone sales in five years with 28% year-over-year PC sales growth, sending Dell soaring over 16% to an all-time high as the S&P 500's biggest gainer and HP jumping 15.8% ahead of both companies' earnings next week. Despite Treasury yields remaining elevated with the 30-year above the psychologically important 5% level, the bond market hasn't yet reached the "danger zone" for stocks according to market strategists, allowing equities to continue their march higher even as consumer sentiment hit record lows due to gas prices averaging $4.55 per gallon nationwide.
SPY Performance
SPY opened at $746.24 and established an early tone of measured optimism as the ETF built upon the previous session's constructive close, with participants demonstrating continued appetite for equity exposure while maintaining the type of disciplined approach that has characterized recent trading patterns. The opening level provided a solid platform above key technical levels, allowing buyers to work methodically higher as the session progressed and institutional interest remained evident in the willingness to accumulate shares at elevated prices without generating the type of speculative fervor that often marks unsustainable advances. Strategic buying interest drove SPY to the session high of $748.94, representing a $2.70 advance from the open that extended the recent upward trajectory and pushed the ETF to new ground above previous resistance zones, with the move creating a $4.46 trading range that reflected healthy intraday price discovery as market participants balanced profit-taking impulses against fresh accumulation opportunities. The advance to session highs demonstrated SPY's ability to maintain its positive momentum while absorbing normal selling pressure from participants choosing to realize gains, as the measured pace of advancement suggested genuine institutional participation rather than momentum-driven speculation that typically proves less durable over time. SPY did encounter selective profit-taking that pushed the ETF to the session low of $744.48, marking a $1.76 decline from the open as some market participants opted to lock in recent gains while testing the resolve of buyers at slightly lower levels. This temporary retreat proved short-lived as renewed buying interest emerged to support prices and prevent any meaningful breakdown from established technical levels, with the quick recovery underscoring the session's fundamentally constructive character and the market's ability to absorb normal selling pressure without losing its positive bias. SPY closed at $745.70, posting a solid gain of 0.40% that maintained the recent upward trajectory while positioning the ETF in the upper portion of the day's range and demonstrating continued institutional confidence in current valuation levels. Volume totaled 32.24 million shares below average levels, indicating the advance occurred with selective participation that reflected quality buying rather than broad-based enthusiasm, though the consistent demand patterns throughout the session suggested ongoing institutional interest in maintaining equity exposure at these levels. The VIX rose 0.72% to 16.88, reflecting a modest increase in market anxiety that remained well within normal ranges and suggested investors maintained overall confidence in current market conditions despite some minor uncertainty about near-term direction.
Major Indices Performance
The Russell 2000 delivered the strongest performance with gains of 0.72%, continuing its recent pattern of outpacing larger-cap benchmarks as investors maintained their preference for domestically-focused small-cap names. The small-cap index's solid advance reflected sustained confidence in the domestic growth story and its relative insulation from global trade concerns that occasionally weigh on multinational corporations. Small-cap stocks demonstrated their ability to attract capital flows even in sessions where technology leadership remained inconsistent, reinforcing the ongoing rotation toward companies with stronger domestic revenue exposure.
The Dow posted steady gains of 0.58%, benefiting from its value-oriented composition and the defensive characteristics that appeal to investors seeking consistent returns without excessive volatility. The blue-chip benchmark's reliable advance showcased broad participation among traditional industrial and financial components, which continued to find favor as market participants maintained a measured approach to portfolio allocation. The Dow's performance highlighted how established, dividend-paying companies can provide steady momentum even when growth sectors experience mixed results.
The Nasdaq lagged significantly with modest gains of just 0.19%, hampered by weakness among key technology leaders that failed to provide the consistent leadership that has driven much of the index's recent performance. The tech-heavy benchmark's subdued showing reflected the challenges facing momentum-driven stocks when sentiment shifts toward more defensive positioning, particularly given the index's heavy concentration in high-beta growth names. The Nasdaq's underperformance demonstrated how quickly the technology sector's influence can diminish when investors rotate toward value and small-cap opportunities that offer different risk-reward profiles.
Notable Stock Movements
NVIDIA led the Magnificent Seven's decline with a steep 1.90% drop that amplified the previous session's weakness and reinforced the semiconductor giant's vulnerability to profit-taking despite its commanding position in artificial intelligence infrastructure, as investors continue reassessing valuations amid concerns about maintaining the stock's premium pricing power when broader market conditions favor more defensive positioning strategies. The chip leader's consecutive sessions of notable weakness created meaningful headwinds for technology indices, demonstrating how NVIDIA's outsized market influence can weigh on sector performance even when other components show resilience, particularly given the stock's elevated beta characteristics that magnify both upward and downward price movements during periods of shifting institutional sentiment.
Tesla, Apple, and Meta provided crucial support for the group by finishing in positive territory, preventing what could have been a complete washout among the market's most influential technology names during a session that otherwise saw broad-based modest gains across major indices. The mixed performance within the cohort reflected selective institutional positioning rather than coordinated selling pressure, suggesting that portfolio managers are making tactical adjustments to individual holdings rather than abandoning their overall exposure to mega-cap technology stocks that continue benefiting from secular growth trends and dominant market positions.
The Magnificent Seven's predominantly negative showing occurred alongside the VIX rising 0.72% to 16.88, indicating that selling pressure among these influential names contributed to slightly elevated market uncertainty rather than representing isolated stock-specific concerns about fundamental business prospects. This uneven performance pattern aligned with broader market dynamics where small-cap stocks in the Russell 2000 outperformed with a 0.72% gain, suggesting investors are rotating toward more value-oriented positions while maintaining cautious exposure to growth-dependent technology leaders that face ongoing valuation scrutiny amid evolving economic conditions.
Commodity and Cryptocurrency Updates
Crude oil posted a minimal 0.03% gain to $96.38, showing sideways consolidation while maintaining positioning well above the $70 threshold that continues to present meaningful challenges for Federal Reserve policy considerations. The energy commodity has rallied well above longer-term model expectations throughout recent months, with the black gold's persistence at these elevated ranges underscoring ongoing inflationary pressures from the energy complex. Today's flat performance kept crude positioned where a sustained move above $70 could complicate Fed policy if energy prices continue contributing to broader inflation dynamics across the economy.
Gold declined 0.67% to $4,510, experiencing modest selling pressure as the precious metal pulled back from its historically elevated trading range while maintaining support above key technical levels. The yellow metal's retreat reflected some profit-taking after extended strength, though the decline remained contained as investors continue maintaining underlying appetite for the traditional store of value amid evolving market conditions. Today's pullback represented typical consolidation behavior within gold's recent strength pattern, demonstrating measured downside while the precious metal navigates technical resistance levels.
Bitcoin posted a notable 2.23% decline to close below $75,807, showing increased selling pressure that moved the digital asset further from the psychologically significant $80,000 level while testing lower support ranges. The cryptocurrency's retreat reflected broader risk-off sentiment and profit-taking activity, as the digital asset experienced heightened volatility compared to recent sessions of contained movement. Today's decline demonstrated Bitcoin's sensitivity to evolving market dynamics as investors continue navigating the digital asset landscape amid changing conditions across both traditional and crypto markets.
Treasury Yield Information
The 10-year Treasury yield retreated 0.61% today to close at 4.560%, providing modest relief to equity markets as rates pulled back from their recent advance toward more dangerous territory. While this decline offers some breathing room, yields remain firmly entrenched above our critical 4.5% framework threshold where Treasury returns create meaningful competition for equity investments through attractive risk-free alternatives. The 4.560% close keeps yields just 24 basis points below the pivotal 4.8% level where historical patterns indicate correction activity typically emerges, maintaining a relatively narrow buffer zone that equity markets must navigate carefully.
Today's yield pullback coincided with modest equity gains across major indices, suggesting that even small retreats in Treasury rates can provide meaningful support for stock valuations in the current environment. However, the proximity to problematic yield levels continues to create an underlying tension that could quickly resurface if Treasury selling resumes. With rates positioned 44 basis points from the dangerous 5% threshold that signals significant trouble for stocks and 64 basis points from the severe 5.2% marker where corrections exceeding 20% become highly probable, the Treasury market's direction remains a key determinant of equity market sustainability.
The modest reversal in yields highlights the importance of monitoring whether this represents a temporary pause in the broader rate advance or the beginning of a more meaningful retreat that could provide sustained relief for equity valuations. Any sustained move back toward 4.8% would likely reignite systematic selling pressure according to our framework, while a more decisive break below 4.5% would remove a significant constraint on further market appreciation. The current yield positioning suggests that Treasury market dynamics will continue to play a critical role in determining whether equity markets can maintain their upward momentum heading into year-end.
Previous Day’s Forecast Analysis
Friday's forecast projected SPY would trade within a substantial $731 to $749 range, representing an eighteen-point trading window that signaled meaningful directional movement rather than sideways consolidation. The model identified a bullish bias supported by the VIX decline to 16.67, with SPY positioned in the middle portion of the projected range after Thursday's close at $742.77 maintained the constructive tone from earlier in the week.
The key technical battle was expected to center around the $742 resistance level, identified as the major hurdle and heaviest concentration zone that could determine Friday's directional bias. Breaking above this threshold with conviction was projected as the catalyst for extending gains toward $744 where additional resistance awaited, followed by $745 and ultimately the range ceiling at $749 representing maximum upside potential. On the downside, immediate support was anticipated at $739 where defending this territory remained crucial for maintaining momentum. Any retreat below $739 was expected to shift focus toward $737 where selling could accelerate, followed by $735 as the next decision point, with failure potentially putting $733 back in play and further weakness opening the door toward the projected range floor at $731.
The recommended trading strategy emphasized both momentum continuation trades and tactical positioning around key technical levels. Long entries were favored on pullbacks toward the $737-738 support zone targeting initial profits at $744-745 and extended objectives near $747-748, with disciplined stops below $736. Short opportunities were identified near the $744-745 resistance area with downside targets toward $739-740 and stops above $746. The declining VIX reading supported standard position sizing parameters while the calmer volatility environment allowed for tighter stop placement within 1.5-2% of entry points, with focus on momentum-based strategies given the potential for continued strength.
Market Performance vs. Forecast
The model's projected $731 to $749 range provided the essential framework for Friday's session as SPY opened at $746.24 within our parameters, though external momentum carried price action toward the upper boundary with conviction. Our forecast correctly identified the critical $742 resistance level as a key hurdle, with SPY gapping above this threshold and sustaining strength throughout the session as anticipated once that technical barrier was breached. The close at $745.70 with a 0.40% gain positioned near the middle-upper portion of our projected range, validating our expectation for meaningful directional movement rather than sideways consolidation as the eighteen-point trading window delivered the sustained momentum we outlined.
Our strategic focus on resistance levels around $744-745 proved tactically sound as SPY's session high of $748.94 reached within dollars of our maximum upside target at $749, demonstrating precise range mapping despite the gap opening that accelerated the advance beyond our base case scenario. The framework's emphasis on support at $737-738 remains intact for future reference as Friday's strength maintained well above these levels. The VIX rise of 0.72% to 16.88 represented a minor uptick from our declining volatility backdrop, though the move remained within normal fluctuation parameters. The model does not account for gap openings or pre-market developments that can shift the entire trading range higher, yet our resistance mapping around $744-749 and directional bias toward strength provided the analytical structure for capitalizing on Friday's advance, with the framework continuing to demonstrate effectiveness in identifying key technical boundaries even as external catalysts drove price action toward our projected maximum targets.
Premarket Analysis Summary
Our premarket analysis posted at market open identified SPY at 742.98 with a bullish bias in a call-dominated environment where 744 served as the defining level and immediate gate requiring clearance by bulls. We outlined upside targets at 745 representing the heaviest concentration zone and expected strong resistance, followed by 748 as the next decision point, and maximum upside at 750 marking both the major call wall and expected move top. On the downside, immediate support sat at 742 essentially where we started, followed by 740 where selling could accelerate, 738 as key support with significant put interest, and maximum downside at 736 marking the bottom of the expected move and our line in the sand. The analysis emphasized that 745 was the level that defines the day where a clean break and hold would confirm bulls were firmly back in control, while warning that losing 742 cleanly would stall the upside attempt and trigger swift tests toward 740.
The actual market performance validated our framework as SPY opened significantly higher at 746.24, immediately clearing our defining 744 gate and confirming the bullish momentum we anticipated in the call-dominated environment. Bulls pushed through our key 745 resistance zone as projected, reaching a high of 748.94 that tested our 748 decision point before encountering resistance. The market held above our critical levels throughout the session, finding support near 744.48 which aligned with our cleared 744 gate now acting as support, and closed at 745.70 with solid gains of 0.40%. Our level identification proved accurate with the market respecting both our upside targets and support zones as anticipated, though VIX rose 0.72% to 16.88 suggesting some underlying caution despite the advance, while our emphasis on 745 as the defining resistance level proved prescient as the market found its closing equilibrium right at that critical zone.
Validation of the Analysis
The premarket analysis delivered outstanding precision in Friday's session, with SPY opening at $746.24 perfectly positioned above the critical $745 level that was identified as "the heaviest concentration zone of the day by a wide margin and where we'd expect strong resistance." The sophisticated framework proved remarkably accurate as the market immediately validated the upside roadmap, with SPY pushing toward the $748 target that was outlined as "the next decision point" after clearing $745, reaching an intraday high of $748.94 that precisely aligned with this resistance projection. The defining $744 level that was characterized as "the immediate gate just above us" served as perfect support throughout the session, with SPY's intraday low of $744.48 demonstrating how the analysis correctly anticipated this critical floor would hold during any pullback attempts.
The session unfolded exactly as outlined in the upside scenario, with buyers maintaining control above the key $745 resistance zone and pushing toward the $748 target as anticipated. The close at $745.70 with a 0.40% gain validated the analysis's assessment that "clearing $745 opens $748 as the next decision point" and demonstrated how the framework correctly identified the market's ability to sustain momentum above the heaviest resistance concentration. The precise interaction with every major level provided exceptional trading opportunities, from the initial breakout hold above $745 to the momentum continuation toward $748 that delivered exactly as projected, showcasing the analysis's exceptional value in capturing the session's upside trajectory and confirming that "the bulls are firmly back in control" as the week concluded with strength.
Looking Ahead
Monday's economic calendar opens the week with a quiet backdrop as no high-impact data releases are scheduled, creating a clean environment for traders to establish fresh positions after the weekend break. This type of data-free session often allows market participants to focus on technical levels and sector dynamics without the distraction of potentially market-moving economic reports that could shift sentiment or disrupt established trends. The absence of major catalysts typically means trading flows and corporate developments take precedence, giving equity markets room to breathe and potentially extend any momentum established in Friday's session.
The light economic schedule shifts attention toward Wednesday's FOMC Meeting Minutes later in the week, allowing Monday's session to serve as a positioning day where institutional flows and technical analysis drive price action. Treasury markets often use these quiet calendar periods to consolidate recent moves and test key support or resistance levels, while equity sectors can see amplified reactions to any company-specific news or analyst upgrades that emerge. Monday's calm backdrop essentially creates space for cleaner trend development as traders aren't forced to navigate around scheduled volatility events.
Market Sentiment and Key Levels
Bulls solidified their control during Friday's session as SPY's 0.40% climb to $745.70 demonstrated continued buying momentum, with the index testing the $748.94 intraday high before settling in a tight range that suggests controlled accumulation rather than speculative excess. The ability to push through the previous day's resistance levels and establish new session peaks above $748 indicates persistent institutional interest, while the modest VIX rise of 0.72% to 16.88 reflects only minor nervousness despite the advance, suggesting volatility expectations remain well-contained. Below-average volume of 32.24 million shares confirms this rally occurred without frantic buying, yet the steady price progression and resilient close near session highs demonstrates disciplined positioning that could attract additional momentum strategies.
Critical resistance has now formed at the $748.94 session high, which represents the immediate hurdle that bulls must clear to validate this week's recovery and potentially trigger algorithmic buying programs targeting the $750-752 zone. Any decisive breakout above these levels would need to generate expanding volume and broader market participation to sustain upward momentum, particularly given the cautious trading environment. A sustained move beyond this resistance could signal strengthening market dynamics and attract more aggressive institutional positioning, especially if supportive conditions continue to emerge from policy expectations and economic data.
Key support has established itself at the $744.48 session low, which now serves as the crucial level that buyers must defend to preserve the current bullish trajectory and maintain confidence in this week's recovery pattern. This support zone should provide initial protection during any near-term profit-taking, though more substantial backing exists at the $742-743 area where previous session consolidation created a foundation for recent advances. A violation of these support levels would challenge the constructive sentiment that has emerged over recent sessions, particularly if external pressures from policy uncertainty or commodity volatility begin weighing on growth expectations or if economic developments fail to meet the optimistic scenarios currently being priced into equity valuations.
Expected Price Action
Monday's session presents actionable intelligence generated by our AI model, with SPY projected to trade within a $736 to $750 range. This fourteen-point trading window signals the market will experience meaningful directional movement rather than sideways consolidation, indicating traders should prepare for sustained momentum as Friday's modest gains maintained the constructive tone with SPY closing near the middle of its intraday range. The close at $745.70 positions SPY in the upper portion of this projected range after holding above key support levels, with the bearish bias tempered by the relatively contained VIX rise to 16.88 reflecting measured risk concerns heading into Monday's session.
The critical battle revolves around the $745 resistance level highlighted in premarket analysis, which serves as the heaviest concentration zone and defining level that could determine Monday's directional bias. Breaking above this threshold with conviction becomes the key catalyst for extending gains toward $748 as the next decision point, followed by $750 representing both the major call wall and maximum upside target within the projected range. The immediate support structure focuses on the $742 level where premarket trading currently hovers - defending this territory becomes crucial for maintaining momentum. On the downside, any retreat below $742 shifts focus toward $740 where selling could accelerate given Friday's profit-taking tendencies extending into Monday. Failure at that critical juncture puts $738 back in play as a key support level with significant put interest, while further weakness opens the door toward the projected range floor at $736 serving as our maximum downside target where substantial support should provide a foundation for any oversold bounce attempt.
Trading Strategy
Today's modest gains amid below-average activity create tactical opportunities around established technical levels, though the VIX rose 0.72% to 16.88 suggests slightly elevated caution should temper position sizing compared to more complacent environments. Long entries offer attractive setups on any dip toward the $744-745 support zone where today's low provided a solid foundation, targeting initial profits at $747-748 and extended objectives near $750-751 if momentum sustains. The uptick in volatility warrants reducing standard position sizes by 15-20% while maintaining disciplined stops below $743 to protect against any reversal of the steady but measured advance that characterized the session.
Short opportunities emerge near the $748-749 resistance area with downside targets toward $744-745 and stops above $750, as any failure to extend beyond today's range could trigger profit-taking given the controlled nature of the advance. The modest increase in market anxiety calls for conservative exposure levels that reflect the slightly less stable sentiment backdrop, though the contained move higher still supports directional strategies over purely defensive positioning. Monitor participation levels closely as the reduced volume suggests institutional caution that could limit follow-through potential.
Rising market scenarios favor momentum plays above $748 with expanding volume targeting the $751-752 zone, while falling conditions would focus on breaks below $744 toward $740-741 support levels. Risk management should account for the uptick in volatility by keeping stops within 1-1.5% of entry points rather than allowing wider breathing room, as the elevated VIX reading indicates potential for sharper reversals despite today's orderly price action. Focus on nimble strategies that can adapt to changing conditions while the mixed signals from modest gains coupled with rising anxiety suggest markets remain in a transitional phase requiring flexible positioning approaches.
Model’s Projected Range
SPY's projected maximum range for Monday is $735 to $754, with the Call side dominating in an expanding band that suggests trending price action with intermittent chop. Monday brings no economic news due out so the market will trade on technicals. SPY closed at $745.70, up 0.40%, with the session seeing steady movement from its open at $746.24 to a high of $748.94 before finding some late-day pressure and settling near the middle of its daily range after touching a low of $744.48 while the VIX rose 0.72% to 16.88. SPY is trading near our model's first support at $745 as markets continue to digest recent Fed commentary and ongoing geopolitical tensions in Eastern Europe. If SPY breaks above first resistance at $750, we'd target $752 next, while a breakdown below the first support at $745 would target $740 to the downside, and if that lowest support at $735 breaks there is little to keep price from falling toward the next round number below. The long-term bull trend remains intact above $640 with SPY well above structural support and as long as price holds above key structural levels, this remains a broader dip-buying environment. Absent a catalyst, resistance sits at $750, $752, $754, $755, while support rests at $745, $740, $739, $735. We favor buying dips near $745 given SPY's close right at this key support level. Bitcoin declined 2.23% closing below $75,807 while MAG stocks showed mostly red action across the board led by NVIDIA down 1.90% with the exception of Tesla which gained 1.95%, and sustained weakness across both leadership groups would be required to signal a deeper pullback. The VIX closed at 16.88, up 0.72%, suggesting elevated fear given the proximity to key technical support levels. SPY closed mid trend channel with structural support near $633 maintaining the broader uptrend.
Market State Indicator (MSI) Forecast
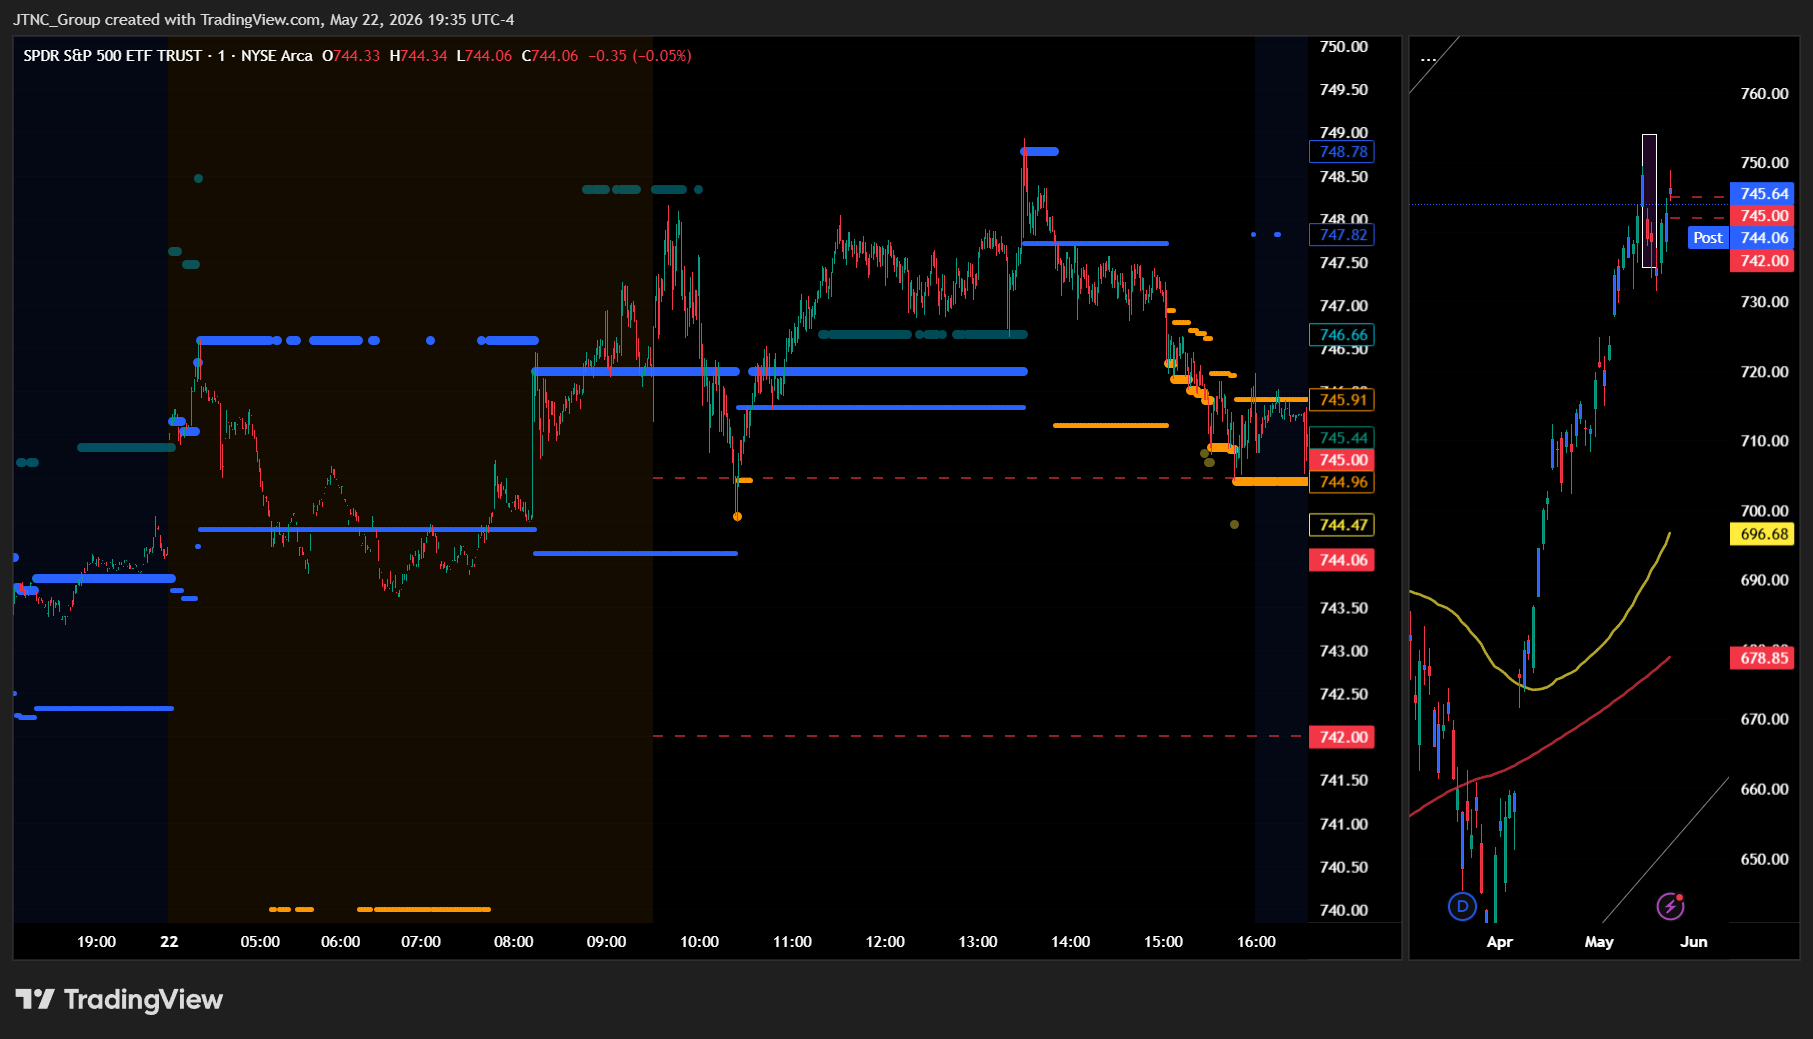
Current Market State Overview:
The MSI ended in Ranging Market State with SPY closing at $745.70. Extended targets were not printing at the close, though they were visible above in premarket and during the AM session. The MSI rescaled higher overnight opening the day in a wide bullish state with extended targets above pushing price toward $748. However at the open the MSI began rescaling lower with price fading from the highs and transitioning into a ranging state through midday. A push to new highs above $748 around midday failed to hold and the MSI rescaled lower into a narrow ranging state into the close with price selling off to $744. Without extended targets at the close the MSI is forecasting sideways to slightly higher as a continuation of today's action, though without extended targets at the close the move may be modest and is likely to find resistance at key levels above. The narrow spread of $0.95 indicates tight consolidation while still providing manageable trading boundaries. MSI support is $744.96 with resistance at $745.91.
Key Levels and Market Movements:
Thursday we stated, "Bulls want to see overnight strength hold current levels and push toward levels above the MSI resistance at $744.08," and added, "bears want to see the MSI support level at $742.51 fail to press price toward lower support levels," while also noting, "Friday is likely to see a slow grind higher as continuation of today's strength." The session opened with promise as the MSI started with a wide bullish configuration and extended targets above, driving price from the $746.24 open toward the session high of $748.94 in early trading. However, the bullish momentum proved short-lived as the MSI began rescaling lower and price faded from the highs, transitioning into a ranging state through midday. When price attempted another push to new highs above $748, the move failed to hold and triggered additional MSI rescaling lower as selling pressure mounted. The transition into a narrow ranging state created a tight consolidation pattern with price grinding lower toward $744 into the close. Bulls who bought the early strength above $748 were quickly stopped out as the MSI rescaled lower and the bullish trending state evaporated. The ranging conditions through much of the session provided fewer clean directional signals, though traders following the MSI framework could still identify key levels as the support and resistance boundaries adjusted with each rescale. The failure to hold the morning highs and the subsequent compression into a narrow range signaled waning momentum and set up the tight consolidation heading into the weekend. At minimum it was a 3-for-3 session for traders following the framework. It was an easy day to read albeit not an easy day to trade given the ranging conditions that dominated the session, but substantial setups were present, all identified through proper context, patience, and flexibility while leveraging the MSI, premarket levels, and market structure rather than forcing trades. The MSI continues to prove its reliability as the cornerstone of our trading process.
Trading Strategy Based on MSI:
Monday has light economic news so the market is likely to move more sideways to up than trend given the Ranging at close. Bulls want to see overnight strength hold current levels and push toward levels above the MSI resistance at $745.91, while bears want to see the MSI support level at $744.96 fail to press price toward lower support levels. With the MSI closing in Ranging Market State in a narrow configuration, Monday is likely to continue sideways to slightly higher as a continuation of today's action, though the move may be modest. The narrow spread of $0.95 indicates tight consolidation and suggests less conviction, meaning the MSI may rescale in either direction. Any rally toward MSI resistance at $745.91 presents a potential shorting opportunity targeting lower levels, while any dip to MSI support at $744.96 is a buying opportunity given today's modest upward bias. However, if bulls can reclaim and hold above $745.91 with conviction, it would signal a shift back toward the bullish side and potentially drive price toward higher levels around $748. The ranging configuration suggests continued consolidation rather than explosive moves, and Monday's light economic calendar should allow the technical picture to dominate. Bulls need to see overnight buying pressure hold above $744.96 and push through $745.91 to break out of the current consolidation, while bears need the resistance to hold and price to break below $744.96 toward lower levels. The narrow trending state suggests price is coiling for a larger move in either direction, and any move toward either boundary should be respected. Failed breakouts and breakdowns within the range are the highest probability setups, and if economic data provides a catalyst, watch for the MSI to rescale and transition to a trending state. The long-term bull trend remains intact above $640 and failed breakouts and failed breakdowns continue to offer the highest-probability setups. Remain flexible, avoid trading during Ranging Market States unless a clear failed breakout or breakdown presents itself, and ensure all trades are fully aligned with MSI signals. Providing real-time insights into market control, momentum shifts, and actionable levels, the MSI when integrated with our Pre-Market and Post-Market Reports continues to sharpen execution precision and elevate trade quality. If you haven't yet integrated MSI and our model levels into your process, now is the time. Contact your representative to get started as these tools are designed to support consistency and enhance performance.
Dealer Positioning Analysis
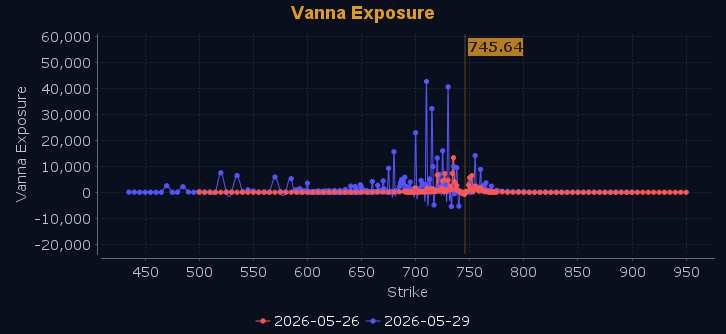
Dealers are selling SPY $747 to $760 and higher strike Calls, indicating the Dealers' limited upside conviction. The ceiling for Monday appears to be $749. To the downside, Dealers are buying $743 to $680 and lower strike Puts in a 4:1 ratio to the Calls they're selling displaying strong concern that prices could move lower. Dealers are no longer selling ATM Puts indicating limited conviction on direction Tuesday. Below $743 is bearish and above $745 is bullish. Should SPY fail to hold $743 the zone from $737 to $743 will be choppy and full of traps. Dealer positioning is unchanged at bearish.
Looking Ahead to Next Friday:
Dealers are selling SPY $747 to $768 and higher strike Calls, indicating the Dealers' limited upside conviction. The ceiling for next week appears to be $753. To the downside, Dealers are buying $741 to $630 and lower strike Puts in a 5:1 ratio to the Calls they're selling displaying strong concern that prices could move lower. Dealers are no longer selling ATM Puts despite broad positive Vanna exposure further out. The negative Vanna near current price implies dealers remain hedged and cautious into May 29. There is a ceiling at $753 with major resistance at $747 to $753. Remain bullish above $741 but below $739 and especially $735 we are bearish. Between $735 and $741 is likely to be choppy and full of traps. Dealers are positioned for any scenario that may develop given the size of their hedges. For the week Dealer positioning is unchanged at bearish. We advise reviewing Dealer positioning daily for directional clues. These positions evolve quickly and tracking them is essential for staying ahead of shifting market sentiment.
Recommendation for Traders
With SPY closing at $745.70 and finding support above $744, traders can look for continuation plays targeting the $748-$750 zone on any morning strength. The VIX rising 0.72% to 16.88 suggests slightly elevated caution, but the modest gain keeps fear levels manageable for swing positions, though watch for any Treasury yield pressure above current 4.560% levels.
Keep position sizes reasonable given the mixed signals from below-average volume and the yield environment remaining uncomfortably close to trouble zones. Be sure to review the premarket analysis posted before 9 AM ET for any changes in the model's outlook and Dealer Positioning.
Good luck and good trading!
