Market Insights: Wednesday, May 21st, 2025
Market Overview
Markets took a hard hit Wednesday as concerns over rising bond yields, surging debt, and political uncertainty rattled Wall Street. Stocks traded flat through the morning before a lackluster 20-year bond auction at 1 PM triggered a wave of selling, with the Dow plunging over 800 points and the S&P 500 and Nasdaq falling sharply. Treasury yields surged to their highest levels in over a year, with the 30-year hitting 5.09%, amplifying fears about rising borrowing costs and pressure on equities. Meanwhile, investors braced for a potential vote on President Trump’s massive tax bill, which House Speaker Mike Johnson pledged to bring to the floor despite pushback from within the GOP. The bill’s proposed expansion of SALT deductions and changes to Medicaid and green energy credits sparked intense debate, adding to market anxiety. Moody’s recent credit downgrade of the U.S. citing this very legislation underscored the stakes. Traders are increasingly uneasy about how the bill could deepen the deficit, with some estimates predicting trillions in added debt. Geopolitical tensions added to the worry as the U.S. and China clashed again over AI chip restrictions, casting doubt on the fragile trade truce. Target also missed earnings and offered cautious guidance, further dampening sentiment, while the dollar hit a two-week low ahead of the G7 summit. With Thursday’s PMI and jobless claims data looming, investors are staying cautious amid an increasingly volatile backdrop.
SPY Performance
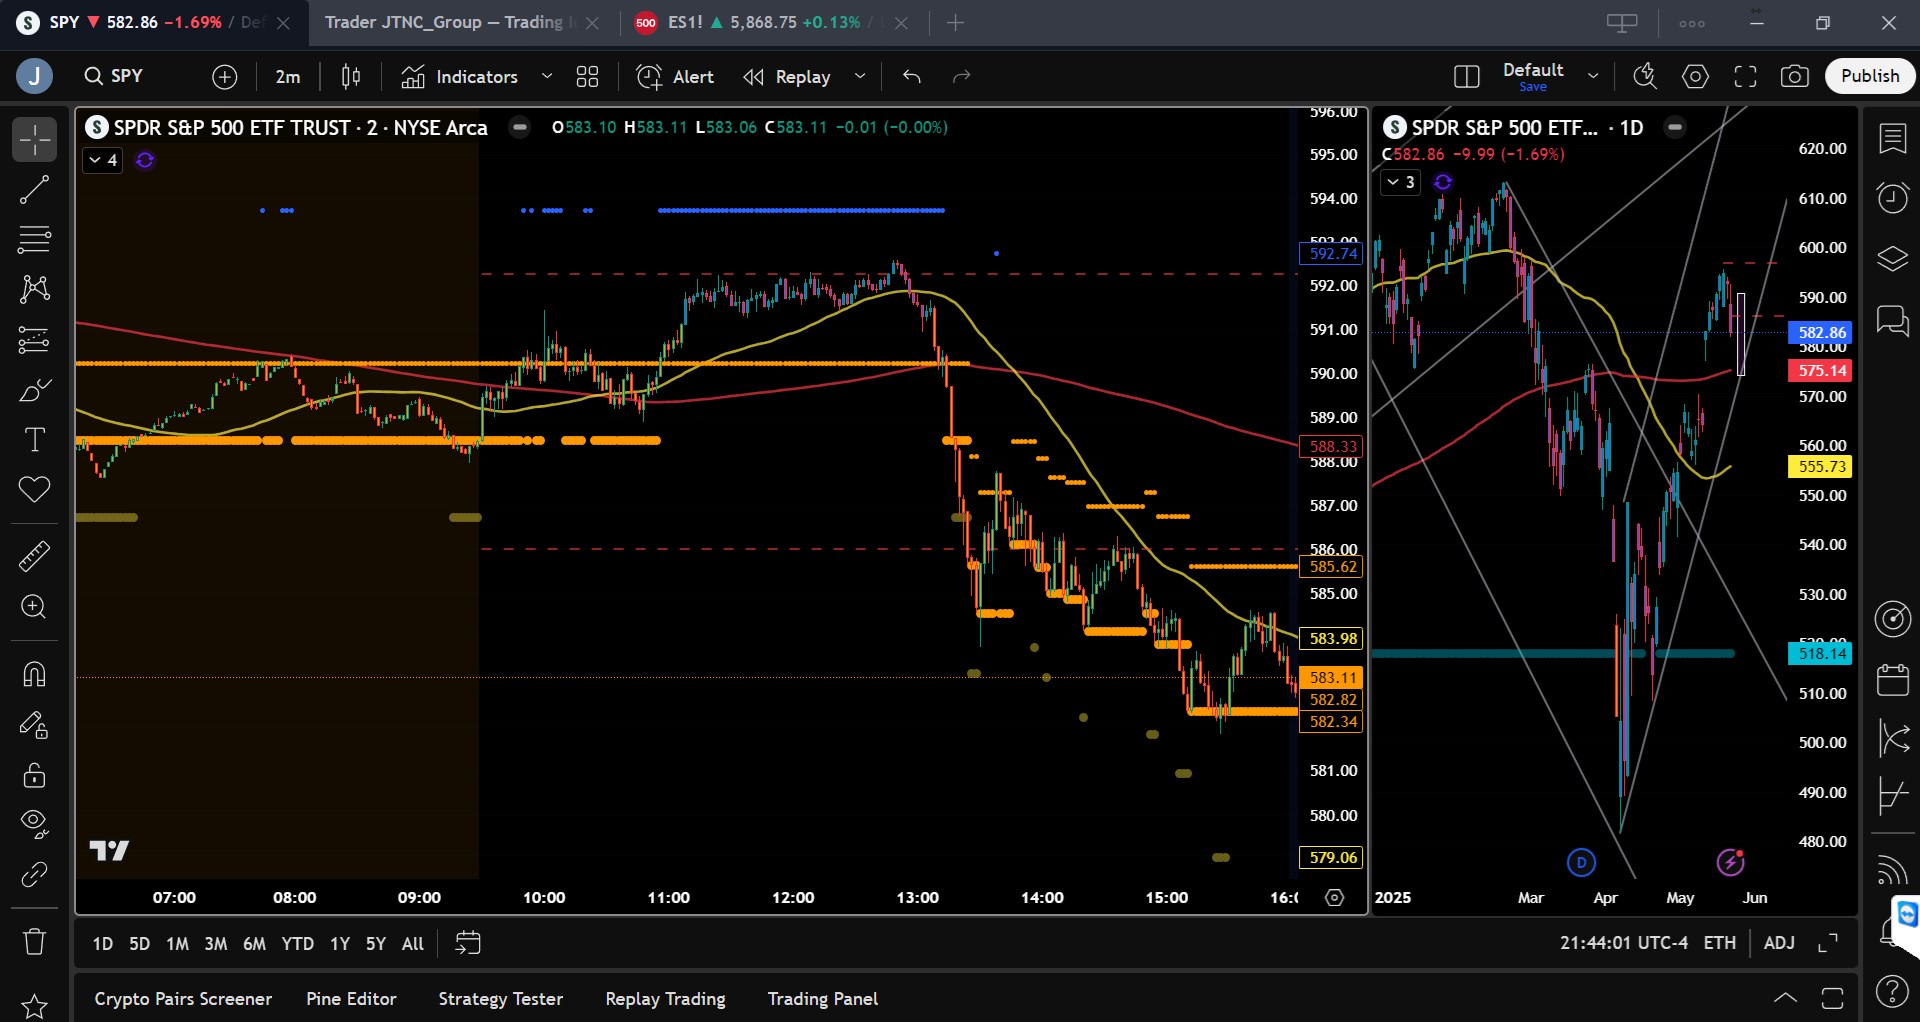
SPY fell 1.65% to close at $583.05 after opening at $588.44. The ETF rallied to $592.58 in the morning session before sharply reversing course following the weak bond auction results, plunging to a low of $581.82 before closing near session lows. Volume surged to 87.08 million shares, well above average confirming the intensity of selling pressure. With SPY finishing below key support at $585 for the first time in weeks, the bulls have lost control of near-term momentum. This close marks the second red day in a row and potentially signals the start of a deeper pullback unless support re-emerges near $580.
Major Indices Performance
The Nasdaq was the relative outperformer on Wednesday, slipping 1.41%, while the S&P 500 dropped 1.65% and the Dow was hit hardest, falling 1.91%. The Russell 2000 took a heavy blow, dropping 2.80% as rising rates pummeled small-cap stocks. The sharp selloff followed a dismal 20-year bond auction that pushed Treasury yields to their highest levels since 2023, reinforcing fears over U.S. debt levels and the pending tax legislation. Sector-wise, interest rate-sensitive groups like real estate led the declines, while defensive sectors failed to offer meaningful shelter. The swift rotation out of risk assets suggests growing anxiety around policy and inflation with no fresh catalysts to counterbalance the rising fear.
Notable Stock Movements
It was a sea of red for the Magnificent Seven, with only Netflix and Alphabet closing in positive territory. Tesla and Apple were the worst performers of the group, each sliding over 2.6%, reflecting sensitivity to both rising rates and macroeconomic stress. Microsoft, Amazon, Meta, and Nvidia all followed lower, dragged down by the broad tech selloff. Alphabet’s modest gain stood out amid the carnage, hinting at selective buying in names with more stable earnings profiles. Despite these declines, most of the group still remain significantly above their April lows, but sentiment is weakening as economic and political pressures mount.
Commodity and Cryptocurrency Updates
Crude oil slid 1.47% to $61.29, moving closer to our long-standing downside target of $60. We continue to expect oil to fall as low as $50 in the coming months, where we would become buyers. Any short-term rally may be capped by rising interest rates and a likely rebound in the dollar. Gold rose 0.81% to $3,316.79, holding firm as investors sought safe-haven assets in the face of macro turmoil. Meanwhile, Bitcoin rallied 2.65% to close just above $109,682, touching a fresh record earlier in the session. We remain buyers of Bitcoin between $83,000 and $77,000, but caution against initiating positions below $77,000.
Treasury Yield Information
Yields surged Wednesday, with the 10-year Treasury jumping 2.50% to close at 4.597% and the 30-year rising above the 5% mark. The weak bond auction intensified investor concern about rising debt levels and the ability of the U.S. to fund its fiscal agenda. As yields climb above key psychological thresholds, 4.5% for the 10-year and 5% for the 30-year, the pressure on equities is mounting. Should yields sustain a move above 4.8%, the risk of a broader correction in stocks becomes more likely, especially as high rates tighten financial conditions and strain risk appetite.
Previous Day’s Forecast Analysis
Tuesday’s forecast projected a trading range between $589 and $596, with a bullish bias above $590. Key resistance levels were outlined at $595 and $597, with a breakout toward $600 considered possible if momentum built. Support was expected at $590, $587, and $585, with caution urged if $585 failed. The strategy favored long setups on dips above $590 and suggested avoiding shorts unless signs of exhaustion emerged near resistance. The report emphasized watching for breakdowns below $590, which could open the door for a move toward $585.
Market Performance vs. Forecast
Wednesday’s market diverged significantly from the prior day’s forecast. SPY opened at $588.44, just under the $590 pivot, and briefly rallied to $592.58 before reversing course. The ETF dropped sharply to a low of $581.82 following the poor bond auction, breaking well below the projected range. The $590 support level failed decisively, leading to a test and eventual break of $585, a key downside inflection point noted in the prior report. Long trades near $590 would have been stopped out, while aggressive shorts on the breakdown below $585 likely paid off. The model’s expected bullish bias did not play out, highlighting how macro shocks, like the bond auction and tax policy concerns, can abruptly shift market direction.
Premarket Analysis Summary
In Wednesday’s premarket analysis posted at 7:23 AM, SPY was trading at $589.17, with the session expected to open under pressure due to macro headwinds. The bias level was set at $590, with downside targets at $588.25 and $586. The forecast favored short entries while SPY remained below $590, but also called for a potential rally if buyers stepped in at lower levels. If SPY could reclaim $590, the report projected a return to $592.25 and possibly $594.25. However, it noted that headwinds would increase significantly above $593, limiting the rally’s strength.
Validation of the Analysis
The premarket analysis proved remarkably accurate. SPY opened at $588.44, dipped to $582 after briefly touching $592.58, and closed at $583.05. The failure to hold above the $590 bias confirmed the bearish setup, and the market followed through on downside targets, with $586 and $588.25 both tested. As predicted, pressure increased dramatically above $593, and the market failed to sustain gains past this point. Traders who shorted near $590 or waited for tests of $586 likely found profitable setups. Once again, the analysis offered timely guidance that aligned well with the day’s pivotal movements.
Looking Ahead
Thursday brings two critical economic data releases: weekly Unemployment Claims and the PMI report. These could significantly influence market sentiment, especially as investors assess labor market strength and business activity amid the ongoing fiscal debate. With volatility rising, these reports could either confirm bearish momentum or provide a catalyst for a relief rally. Markets will be watching closely for signs of economic resilience or further weakness that might inform expectations around Fed policy and fiscal risk.
Market Sentiment and Key Levels
SPY closed at $583.05 and has re-entered the previously identified $565–$585 zone, an area associated with institutional selling. Support at $585 has now broken, shifting sentiment away from the bulls and ever so slightly bearish. The next major support lies at $580, with further downside risk toward $574 and the unfilled gap at $564 if that level fails. Resistance is now at $588 and $590, which previously served as key support. Bulls need to reclaim $588 to halt further deterioration, while bears appear to have seized short-term control. With macroeconomic forces intensifying, any test of $580 will be closely watched to gauge whether dip-buyers remain active.
Expected Price Action
Our AI model forecasts a wide trading range of $577 to $588 for Thursday, indicating potential for strong trending behavior. The model carries a bearish bias below $585, suggesting short setups are favored while SPY remains beneath this key level. Should SPY rebound and recapture $588 or $590, a test of $594 becomes possible, but upward moves will likely be sold into unless economic data provides a bullish jolt. If SPY breaks below $580, expect an acceleration toward $574 and possibly $564. Traders should be alert for rapid reversals around key levels and favor trading with the trend, especially in response to Thursday’s data.
Trading Strategy
Long trades are now higher risk unless SPY reclaims $585 and consolidates above it. If SPY can close above $588, long entries could target $590 and $594, but stop-losses should be tight due to increased volatility. On the short side, entries below $585 remain favored, targeting $580, then $574. Should $580 give way, look for a quick move to the May 9th gap at $564. With VIX rising to 20.87, its highest level in over a month, expect larger swings and prepare for sudden reversals. Smaller positions and disciplined risk management are essential in this environment, particularly as Thursday’s economic data looms.
Model’s Projected Range
The model’s maximum projected range for Thursday is $574.25 to $590.75, with the Put side dominating in an expanding range suggesting trending behavior tomorrow. Thursday’s economic calendar includes Unemployment Claims and PMI data, both of which have the potential to significantly impact markets. On Wednesday, attention centered on the bond auction, which was poorly subscribed. As a result, the 10-year Treasury yield spiked over 2%, triggering a sharp sell-off in equities. Overnight, SPY retested Monday’s lows and bounced. At the open, SPY was trading around $588.50, once again testing that key level. The support held initially and helped push the index to intraday highs of $592.58. However, when the bond auction results were released at 1 PM, markets sold off aggressively, breaking through Monday’s lows. As we mentioned previously, repeated tests of a support level tend to drain liquidity, making the level more vulnerable to failure. On the third test of the $589 area this week, that support finally gave way. With dip-buying notably absent, the bears pushed prices as low as $582 just before the close. This marks two consecutive down days and with SPY closing below $585, the bears have stepped into the picture and may do further technical damage. Looking ahead to Thursday, the market is awaiting key economic reports, and price action after their release will be critical. In the absence of a catalyst, the bulls must reclaim $588 to stem the current decline. If $580 holds, a backtest of higher levels could occur, but unless $588 is recaptured, upward moves are likely to be sold. If $580 fails, the market may head toward the gap from May 9th at $564, which also marks the lower boundary of the trend channel originating from the April lows. SPY is once again trading within the $565–$585 range, an area where we advised that institutional selling would be present. The elevated trading volume today reinforces the idea that the prior bullish trend has been damaged and that near-term direction is now less certain. It’s important to keep an eye on the bond market, as further weakness or strength there will have a direct effect on equities. If SPY continues to decline and fills the gap near $564, a retest of the April lows could come back into focus. Since early April, market behavior has been driven largely by macroeconomic forces, including bond yields, inflation concerns, tariffs, and fiscal policy. This influence is likely to persist unless there is a notable shift in direction from the White House. The VIX closed higher at 20.88, still below the critical 23 level but up more than 15% on the day. Historically, a VIX above 23 tends to pressure equities, while readings below that threshold tend to support bullish momentum. With SPY now below $585, the bulls no longer have the upper hand. While the bears are not in full control either, the market may be entering a more neutral or consolidative phase. SPY remains within a steep bullish trend channel off the April lows, but the current rate of ascent may not be sustainable. A period of sideways consolidation would be a natural and potentially constructive development. Given the elevated volatility and ongoing macroeconomic uncertainty, traders should remain flexible and responsive to price action in the days ahead.
Market State Indicator (MSI) Forecast
Current Market State Overview:
The MSI is currently in a Bearish Trending Market State, with SPY closing near the bottom of the range. Following the release of the bond auction results, extended targets began to print as the MSI shifted from a ranging state to a bearish state. Several subsequent rescalings lower occurred, with extended targets appearing intermittently throughout the afternoon session. Although the initial move lower was sharp, and the MSI indicated strong herd behavior driving the price down, the decline began to slow around the $585 level. By 1:30 PM, the pace of the descent had moderated, and it took the remainder of the trading day to reach the session low of $581.82. The MSI closed the day in an average range, bearish state, but without extended targets, suggesting a decelerating bearish trend. This could indicate that price action may move more sideways rather than sharply lower unless an external catalyst emerges to trigger a renewed directional move. As of now, MSI support stands at $582.34, with resistance at $585.62.
Key Levels and Market Movements:
On Tuesday, we noted: “A clear catalyst is needed to push prices decisively higher or lower.” We also emphasized: “We continue to respect the prevailing uptrend unless price closes below $585,” and observed: “The MSI is also beginning to reflect signs of a weakening bull trend.” With that actionable framework in mind, SPY held the $590 level overnight and at the open, appeared poised to deliver another session like yesterday. Given a failed breakdown just before the open and the absence of extended targets below, we entered long at $589.50, aiming for the premarket level of $592.25 as our first target. SPY reached this level before noon, and we exited 70% of our position. With the MSI in a ranging state and price action relatively flat throughout the morning, we opted to move our stop to breakeven earlier than usual. Our next target was $594, so we waited patiently for the market to break out of a tight range. At 12:50 PM, price inched higher, but the breakout was weak and unconvincing. With no extended targets printing above, we exited our long and reversed short as SPY broke down from the morning range. This type of trade is not easy to teach or recommend. After nearly three hours of trading in a range of less than $2, we anticipated a breakout, up or down. Some might label this a “squeeze,” but regardless of terminology, it’s a more advanced trade setup than we typically describe in this newsletter. Having booked gains on our first trade, we took minimal risk on the reversal, setting a stop just above the day’s highs. We entered short at $591, initially targeting the premarket level of $588.25. When the bond auction news hit the wire, prices began to fall rapidly, and the MSI began to rescale lower. In response, we adjusted our first target to MSI support at $585, a major level we’ve highlighted repeatedly over the past week. We exited both our first and second targets (90% of our position) at this level, expecting the possibility of a bounce. SPY did indeed rebound to $588. Although it formed a textbook failed breakdown, extended targets continued to print, so we refrained from reversing long. Instead, we waited for additional signals from the MSI to determine an appropriate third target for our remaining runner. The MSI began rescaling rapidly both higher and lower. In response, we moved our stop to breakeven and allowed the market action to play out. After another test of $585, the level finally broke, sending prices to the day’s lows. By 3:25 PM, SPY once again formed a textbook failed breakdown, but extended targets remained, reinforcing our decision to stay short. We chose $582 as our final exit for the runner, closing out a strong day. Two trades, two wins, and one of the most effective short setups we’ve seen in some time. Thanks to the MSI’s ability to highlight who controls the market, when control shifts, and where actionable levels lie, we were able to enter with precision and exit with discipline. When paired with a structured trading approach and the model’s key levels, the MSI proves to be a powerful tool for consistent performance. We continue to strongly recommend incorporating the MSI into your trading process. It helps align you with prevailing market forces, avoid common traps, and make confident, well-informed decisions.
Trading Strategy Based on MSI:
Today the market was shaken by a poorly received bond auction, and tomorrow the market will need to digest key economic data in the form of Unemployment Claims and PMI. These reports have the potential to push the market decisively in either direction. Currently, the MSI remains in an average-range bearish state and, notably, is not printing extended downside targets. This suggests that SPY may move sideways in the near term, likely holding above $580 and potentially back testing higher levels. If $580 holds, a rebound toward $588 is possible; however, in the absence of an external catalyst, such a move will likely be sold. If the bulls are able to reclaim $588, they may attempt to push for a close above that level on Thursday, which would put them back in control of the trend. On the other hand, a failure to hold $580 could quickly bring SPY down to $575. Should $575 break, it would likely lead to a gap fill at $564. While the bears have reentered the picture, the odds still modestly favor the bulls. That said, the bulls clearly don’t have the firm grip on the market they held earlier in the week. The next few sessions will likely determine which side takes the lead. Until then, traders should pay close attention to the $580 and $588 levels, as these are critical for the bulls to defend or reclaim in order to retake momentum. A breakdown below $580 would give the bears more control. The MSI indicates a weak bearish trending state, making it possible that the market enters a period of consolidation on Thursday. While a test of the March highs near $597 is off the table for now, today's action is likely just a pullback within a broader bullish trend that may simply need more time to consolidate. We recommend monitoring for failed breakdowns near $582 as potential long setups, and failed breakouts near $588 for possible short entries. Barring any macroeconomic surprises out of Washington, our bias has shifted to neutral. Two-way trading is now favored. As always, remain aligned with the MSI and avoid trading during Ranging States. Continue to act with discipline and stay responsive to evolving market structure. The MSI offers valuable real-time insight into momentum and structural changes. When used in conjunction with our Pre-Market and Post-Market Reports, it can help identify high-probability targets and precise entry points keeping traders in step with the tape and helping them avoid unnecessary mistakes. If you haven’t yet integrated the MSI and model levels into your trading process, now is the time to do so. Reach out to your representative to get started as these tools can make a meaningful difference in both your performance and consistency.
Dealer Positioning Analysis
Summary of Current Dealer Positioning:
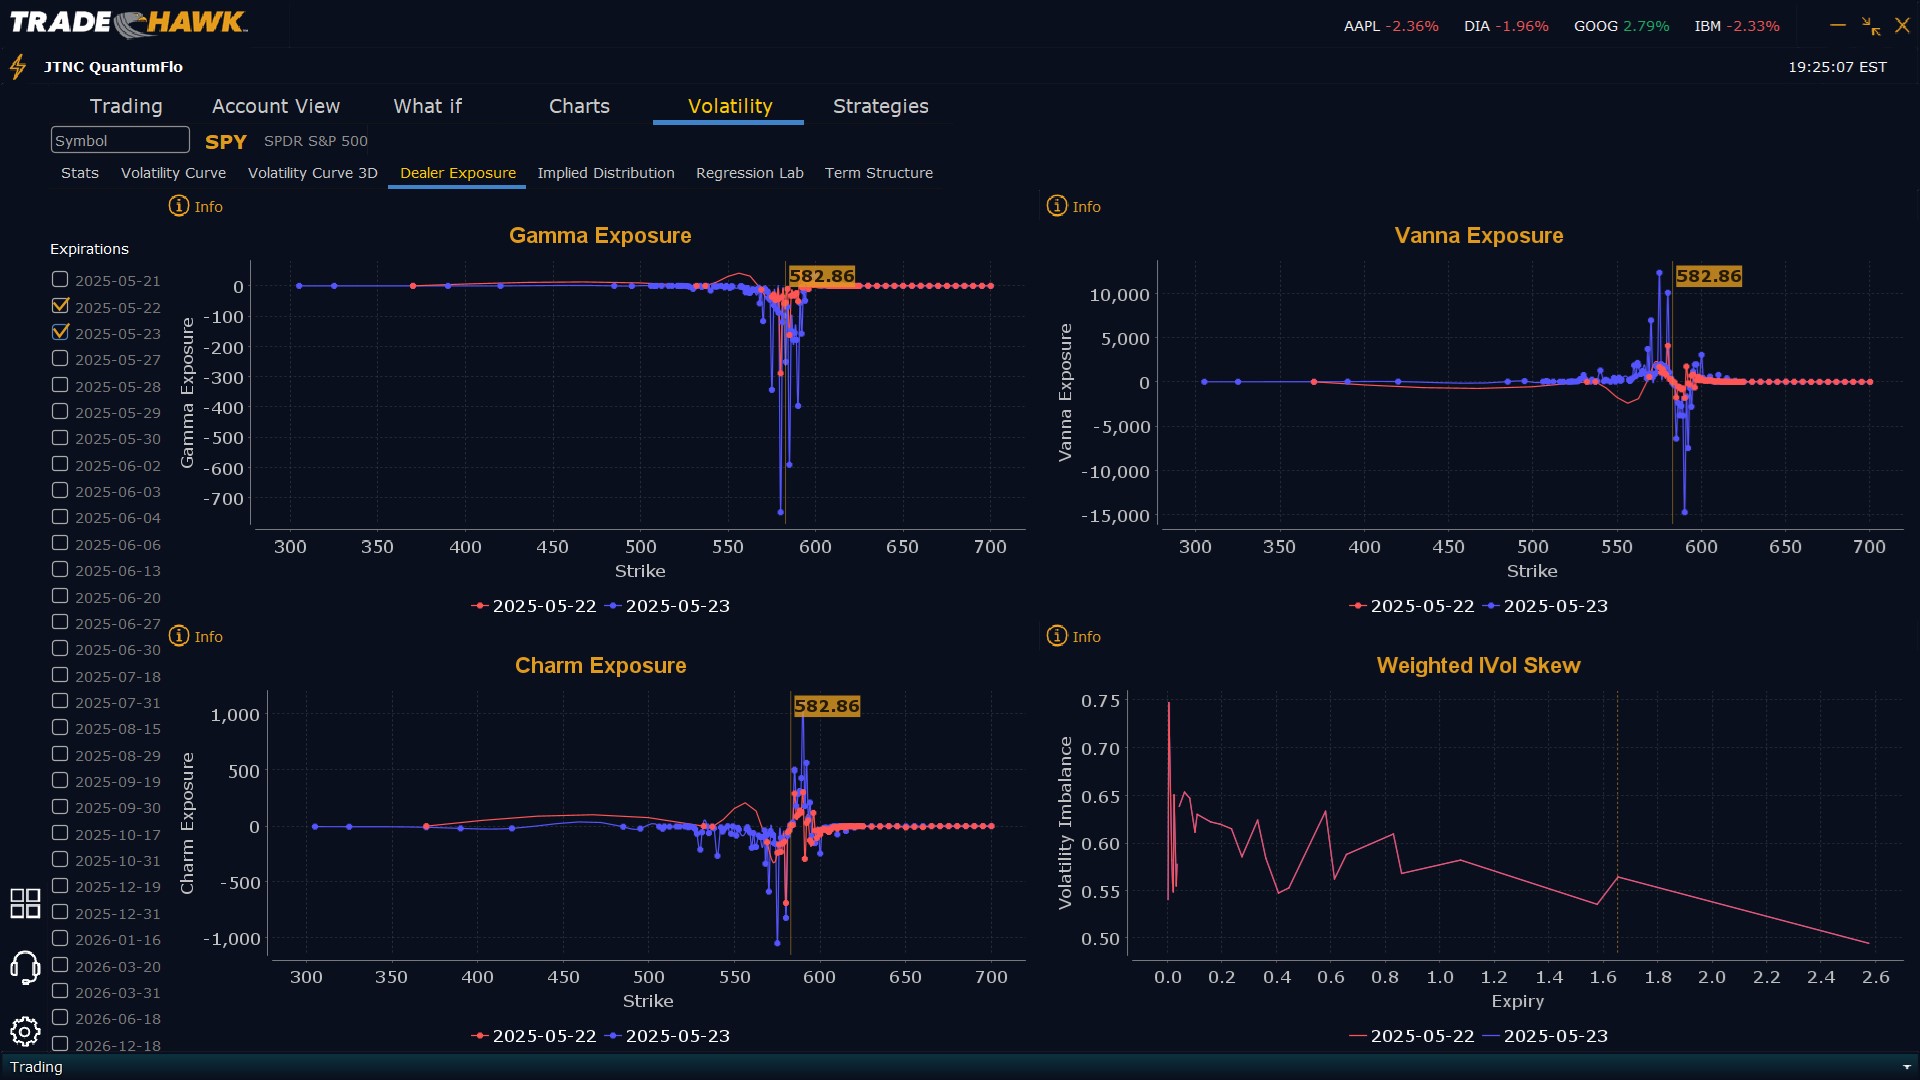
Dealers are selling $592 to $610 and higher strike Calls while buying $583 and $591 Calls indicating the Dealers belief that prices may move higher on Thursday. Dealers appear to project a ceiling for Thursday at $591. To the downside Dealers are buying $582 to $500 and lower strike Puts in a 3:1 ratio to the Calls they are selling/buying, implying a slightly bearish posture for Thursday. Dealer positioning has changed from neutral to slightly bearish.
Looking Ahead to Friday:
Dealers are selling $593 to $610 and higher strike Calls while buying $583 and $592 Calls implying the Dealers belief that prices may continue to rally this week but not beyond $595. To the downside, Dealers are buying $582 to $440 and lower strike Puts in a 3:1 ratio to the Calls they’re selling, reflecting a slightly bearish outlook for the week. Dealer positioning has changed from neutral to slightly bearish. We advise reviewing Dealer positioning daily for directional clues. These positions evolve quickly and tracking them is essential for staying ahead of shifting market sentiment.
Recommendation for Traders
With SPY now closing below $585, traders should shift to a more cautious approach. Short setups are preferred while SPY remains under $585, targeting $580 and $574. Long trades may be considered above $588 with targets at $590 and $594 and below $580. Be alert for failed breakdowns near $580, but don’t jump the gun without confirmation. With VIX closing at 20.87, volatility is rising fast. Use smaller position sizes, tighten stop-losses, and stay nimble. Key levels will define direction, and Thursday’s economic data could deliver powerful moves. Review the premarket analysis posted before 9 AM ET to account for any changes in the model’s outlook and in Dealer Positioning.
Good luck and good trading!
