Market Insights: Tuesday, May 20th, 2025
Market Overview
Stocks dipped on Tuesday, halting a six-day win streak as investor enthusiasm over easing trade tensions began to fade. Futures for the Dow, S&P 500, and Nasdaq all traded flat early in the session as lingering tariff concerns weighed on sentiment. While the temporary rollback in U.S.-China tariffs initially sparked last week's rally, skepticism is growing that the optimism may be overblown. One strategist called the current mood “unwarranted optimism,” and JPMorgan CEO Jamie Dimon warned that high tariff levels are still likely to drag on the economy.
Tariffs remain at their most elevated levels since 1939, and economic forecasts continue to reflect tepid growth ahead. More Fed officials echoed that concern, suggesting rate cuts may not arrive before September. Adding to the cautious tone, data shows a steep drop in shipments to the U.S., signaling potential supply chain stress. Home Depot’s earnings, a focal point for assessing tariff impacts, were mixed—while revenue beat forecasts, weaker same-store sales and a drop in profit sent its shares lower. Walmart last week signaled rising prices were ahead, while Home Depot pledged to keep prices steady, underscoring divergent retail strategies amid inflation.
Investors will turn to Wednesday's earnings from Target and Lowe’s for further insight into how consumers are responding to inflation and trade headwinds. Meanwhile, President Trump continues to push his sweeping tax bill through Congress, with skepticism from both fiscal hawks and blue-state Republicans complicating its path. The proposed legislation, coupled with massive spending and tariffs, is fueling concern over the swelling deficit and potential long-term consequences for the economy.
SPY Performance
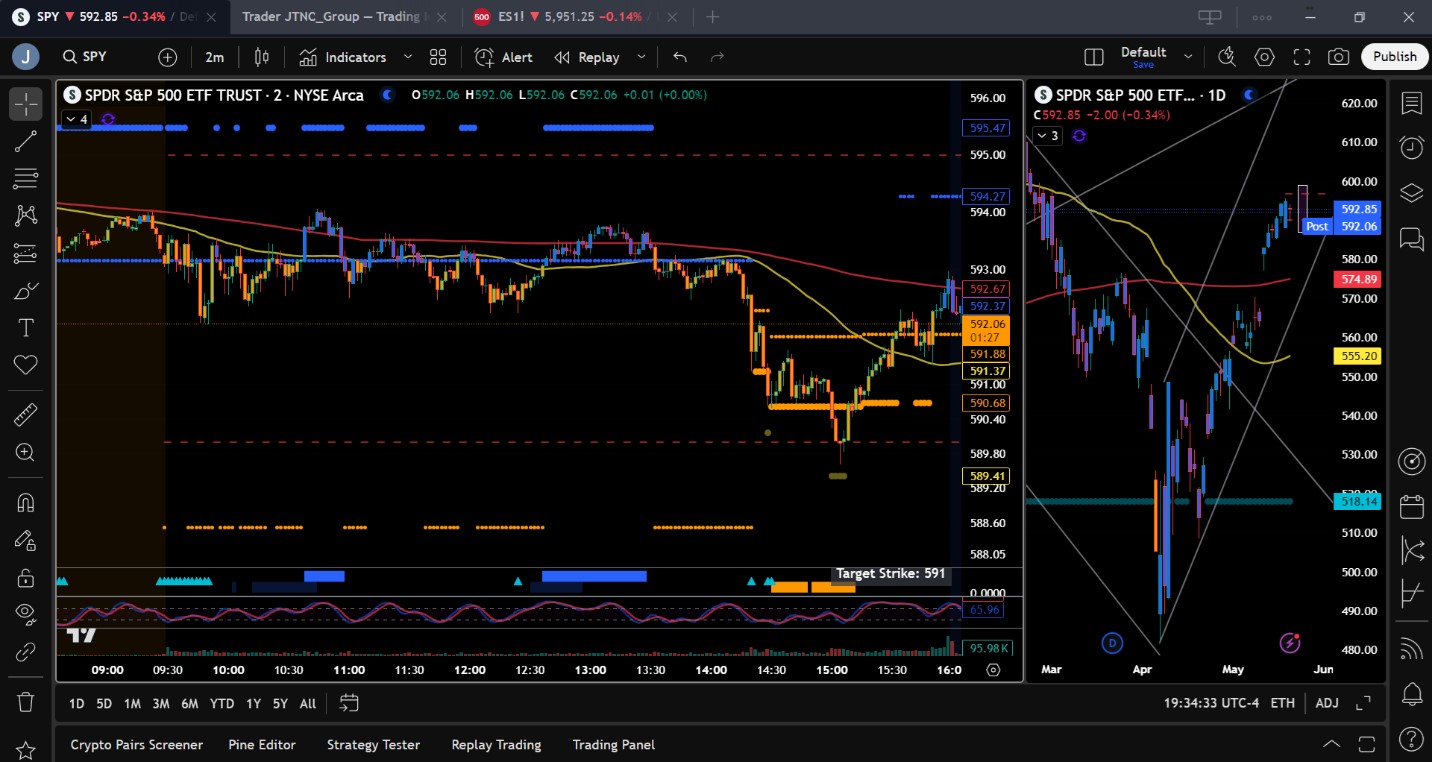
SPY pulled back 0.34% to close at $592.85 after opening at $593.09. The ETF dipped as low as $589.60 and struggled to reclaim earlier highs, reaching only $594.05 intraday. Volume came in below average at 54.78 million shares, reflecting a quieter session dominated by consolidation and profit-taking. Though the decline was modest, the failure to hold above $595 may indicate short-term fatigue. Still, SPY remains above key support levels, and the broader trend remains constructive so long as $590 holds.
Major Indices Performance
The Russell 2000 barely clung to gains, rising 0.04% to outperform the other major indices in an otherwise downbeat session. The Dow slipped 0.27%, followed closely by the S&P 500 and Nasdaq, which both fell 0.38%. Markets cooled after six straight days of advances, with traders reassessing the strength of the recent rally amid rising tariff and rate concerns. Industrial and tech names lost traction, while consumer discretionary names struggled to gain footing following Home Depot’s mixed results. Overall, market sentiment remains cautiously optimistic, but the lack of macro catalysts and growing economic headwinds could dampen near-term enthusiasm.
Notable Stock Movements
Among the Magnificent Seven, it was a mostly red day, with Tesla and Netflix eking out small gains while the rest of the group declined. Alphabet led the drop, sliding 1.53%, followed by losses of over 0.92% in both Amazon and Apple. The weakness in megacap tech reflects a broader rotation away from high-growth names as concerns about tariffs and consumer demand build. Despite the pullback, these stocks remain elevated from their April lows, and the group’s resilience may again be tested as earnings and macro data trickle in.
Commodity and Cryptocurrency Updates
Crude oil nudged up 0.19% to settle at $62.26, continuing its sluggish climb. Our model still sees oil dropping toward the $50 level in the months ahead as the dollar eventually finds a bottom and resumes its ascent. In the near term, currency weakness may allow oil to rally, but rising interest rates could cap gains. Gold surged 1.82% to close at $3,292, extending its climb as investors hedge against mounting macroeconomic risks. Bitcoin added 1.03% to close just above $106,500. We remain buyers between $83,000 and $77,000 for trading purposes but recommend caution below $77,000 due to downside vulnerability.
Treasury Yield Information
The 10-year Treasury yield rose 0.22% to finish at 4.485%, inching closer to the psychologically significant 4.5% mark. This level often sparks nervousness in equities, and a sustained move above 4.8% would likely prompt a more pronounced market correction. The bond market continues to be a key influencer of equity behavior, particularly as investors balance inflation concerns with policy uncertainty.
Previous Day’s Forecast Analysis
Monday’s forecast anticipated a bullish bias above $590 with a projected trading range between $590 and $598. The model favored long entries above the $590 level, with resistance outlined at $595 and higher targets at $598 and $600. Downside support was expected at $586, with a potential deeper move to $580 if that failed. The guidance suggested watching for consolidation or failed breakouts near resistance and recommended long setups on dips above $590 while exercising caution around the $600 level due to resistance.
Market Performance vs. Forecast
Tuesday’s action stayed largely within the projected range, with SPY opening at $593.09 and closing at $592.85. The intraday high reached $594.05, just under the $595 resistance, while the low touched $589.60, right above key support at $586. The modest decline aligned with expectations of consolidation as SPY failed to extend gains after testing resistance. Traders following the model’s guidance likely had chances for short trades near $594 and long entries around $590. The bias held, and the levels identified, particularly the $590 support, were well respected, reinforcing the value of the analysis.
Premarket Analysis Summary
In Tuesday’s premarket analysis posted at 7:36 AM, SPY was trading at $594.25 with a bullish bias above $595 and downside targets set at $591.50 and $590. The forecast emphasized upward momentum contingent on breaking and holding above $595, which would open a path toward $598.50 or $600. The analysis discouraged short trades, noting they would be challenging unless SPY strongly rejected $595. The report also highlighted that dips near $591.50 could offer long opportunities if buyers stepped in.
Validation of the Analysis
Tuesday’s market adhered closely to the premarket analysis. SPY never cleared the $595 threshold, signaling the lack of commitment needed to fuel further upside. After an early attempt to push higher, the ETF pulled back and found support just above $589.60, validating the expected support zone around $590 and $591.50. Traders who avoided shorts and focused on buying near the lower end of the range were rewarded as SPY bounced from intraday support. The precision of the analysis again demonstrated its value in identifying reliable entry zones and defining realistic expectations for intraday behavior.
Looking Ahead
Wednesday brings no scheduled economic news, setting up another potentially rangebound session. The market’s next directional cue may come Thursday with Unemployment Claims and PMI data, which could provide insight into labor strength and broader economic momentum. Until then, traders should continue watching key technical levels and remain alert for any unexpected news that could shift sentiment.
Market Sentiment and Key Levels
SPY closed at $592.85 and continues to hover above key support at $590, a critical battleground that has underpinned the market’s recent resilience. Resistance is now clearly defined at $595 and $597, with a breakout above these levels possibly propelling SPY toward $600. Support remains layered at $590, $587, and $585, though each test of these levels reduces their reliability. Bulls remain in control, but fading volume and lack of fresh catalysts could invite volatility. If $590 breaks decisively, a test of $585 becomes increasingly likely.
Expected Price Action
Our AI model projects a trading range of $589 to $596 for Wednesday, offering actionable intelligence for the day ahead. The model maintains a bullish bias above $590, suggesting long setups on dips that hold this level. If SPY clears resistance at $595, the market could target $597 and even $600, though conviction will be required to sustain the move. Conversely, failure to hold $590 could send prices back to $585, which remains a critical inflection point. As always, traders should be alert to failed breakouts or breakdowns and trade with the prevailing trend.
Trading Strategy
Long trades remain favored as long as SPY holds above $590, targeting $595, then $597. If momentum builds, a breakout toward $600 is possible. Tighten stops near resistance to protect gains. On the short side, trades can be considered between $595 and $600 only with signs of exhaustion or rejection. If SPY breaks below $590, expect a drop toward $586, then $585, both of which could offer bounce opportunities. The VIX dipped slightly to 18.09, indicating subdued volatility, but traders should remain cautious and adjust position sizing accordingly. Tight stop-losses are crucial near key resistance levels.
Model’s Projected Range
The model’s maximum projected range for Tuesday is $587 to $599, with the Call side dominating in a slightly expanding range suggesting consolidation with periods of trending behavior. There is little economic data scheduled for release until Thursday, and nothing imminent appears likely to act as a strong catalyst heading into Wednesday. Market attention has shifted to Congress and its efforts to pass a massive budget bill, projected to add at least $2.5 trillion to the federal deficit. SPY opened lower on profit-taking and concerns that the recent rally may have overshot. However, once again, “buy-the-dip” investors stepped in late in the day near $589, reversing much of the session’s losses. This ended the streak of consecutive green days, though the decline was modest with SPY closing down just 34 basis points. It was a minor win for the bears, but the bulls remain firmly in control as long as $590 holds. Should $590 give way, the bears could get another opportunity to push prices toward the $585 level, a key support area that has yet to be fully tested this week. As noted previously, repeated tests of a level tend to drain liquidity, increasing the odds of a breakdown. For now, $585 continues to represent the dividing line, above it, bulls dominate; below it, bears may gain the upper hand. Consolidation in the $590–$595 zone still seems the most likely scenario unless an external catalyst emerges. Probabilities continue to favor the bulls, with $597 (the March highs) in focus. A breakout above that level could trigger a broader rally toward new record highs. SPY is trading comfortably above the $565–$585 range, an area where institutional selling has been noted. Today’s below-average volume reinforces the view that the path of least resistance remains higher, making a return to the April lows increasingly unlikely. Looking ahead to Wednesday, key resistance levels are $595 and $600, where supply appears to be building. On the downside, watch for support at $590, $587, and $585. Notably, support between $585 and $590 appears to be weakening slightly, suggesting that a break below $585 could open the door to deeper downside. The coming week could be pivotal for June’s market direction. Since April 2, macroeconomic forces, tax policy, tariffs, bond yields, and inflation have been the dominant drivers, and that influence is expected to persist in the absence of a significant policy shift from the White House. Meanwhile, the VIX closed slightly lower at 18.09, remaining well below the critical 23 level. Historically, volatility above 23 tends to weigh on equities, while lower readings support bullish momentum. With SPY holding above $585, bulls remain in control and may attempt to extend gains on Wednesday. The index continues to climb within a steep bullish trend channel that began at the April lows. However, this rate of ascent may not be sustainable. A period of consolidation or a healthy pullback would be both natural and constructive. Momentum still favors the bulls, but with volatility elevated and macro risks still in play, maintaining flexibility and staying responsive to evolving price action will be key in the days ahead.
Market State Indicator (MSI) Forecast
Current Market State Overview:
The MSI is currently in a wide Ranging Market State, with SPY near the bottom of the range. Extended targets printed only briefly today when the MSI was in a bearish state. That pushed price do the day’s lows but very quickly, buyers stepped in, trapping shorts. The overnight session saw prices rally to MSI resistance at $595.47 which held. By the open, price had retreated to MSI support at $593 which eventually gave way leading to the MSI rescaling lower twice to a bearish state. But by the close, with price reversing, the MSI ended the day in a ranging state implying confusion and likely market consolidation heading into Wednesday. Current MSI support is $591.88 and resistance is at $594.27.
Key Levels and Market Movements:
On Monday, we noted: “The MSI is also beginning to show signs of a weakening bull trend.” We also stated: “As long as $590 holds, a push toward $597 is likely,” and “We recommend watching for failed breakdowns near $590.” With this actionable framework in hand, SPY delivered a textbook session. At the open, SPY held MSI support around $593 through most of the morning. While we were tempted to go long on a failed breakdown at 9:44 a.m., we ultimately passed. With no extended targets and the MSI in a ranging state, we chose to sit on our hands. Readers of this newsletter know we typically avoid trading when the MSI is in a ranging state as this marks a transitional phase with reduced odds of success. As the session progressed, price eventually broke down, but we didn’t chase the move lower. Our preference was to enter shorts closer to the edges, specifically near $595 and not at $592. So, we remained patient, waiting for a setup aligned with our framework. That opportunity came at 3:04 p.m. with a textbook failed breakdown right at $590, the key level we highlighted in yesterday’s report. We entered long and targeted MSI resistance at $591.85 as our first objective. By 3:35 p.m., that level was hit. Given the late hour, we chose to close the remaining 30% of the position into the close. SPY briefly popped just shy of $593, allowing us to exit fully and lock in a solid, disciplined gain. While the day was filled with chop and few clean setups, it was a great example of trading “from the edges.” It’s days like this that reinforce the importance of patience and precision. We aim to teach you to wait like a hunter stalking its prey; disciplined, focused, and ready. Knowing where to look, having a clear plan, and staying aligned with the MSI framework greatly improve your odds of success. The MSI continues to demonstrate its value helping identify who holds control, when control shifts, and where actionable levels exist. It enables sharp entries, well-timed exits, and, when paired with a structured trading approach, becomes a powerful tool for consistent performance. We continue to strongly recommend integrating the MSI into your trading process. It keeps you aligned with the dominant market forces, helps avoid common traps, and supports confident, informed decision-making.
Trading Strategy Based on MSI:
This week is light on major economic data until Thursday, allowing the market space to consolidate. Today’s dip was once again aggressively bought, underscoring the strength of the ongoing rally. SPY remains within striking distance of all-time highs. While the green streak of winning days ended today, the market finished essentially flat after a tight-range session. A clear catalyst is needed to push prices decisively higher or lower, and until one emerges, sideways action is likely to continue. Bulls remain in control, and we continue to respect the prevailing uptrend unless price closes below $585. As long as SPY holds above that level, the bears remain on the sidelines. That said, we’re now entering a seasonally weaker period where extended rallies are less frequent. The MSI is also beginning to reflect signs of a weakening bull trend. Our model suggests a period of consolidation is increasingly likely, though a test of the March highs near $597 remains possible before any meaningful pullback. A revisit to the $585 level also appears probable, but with the broader trend intact, we expect dips to continue being bought... at least for now. We continue to favor long setups but are increasingly open to tactical two-way trades, particularly near well-defined edges. Our model indicates SPY could either press toward $597 or dip toward $585, where buyers are again likely to step in. As long as $590 holds, a push toward $597 remains in play, with a potential breakout attempt toward $600. The $595–$600 zone is a logical area to begin considering tactical short setups. With $600 within reach, we believe there is a strong probability this level will be tested before any deeper correction sets in. We recommend monitoring for failed breakdowns near $590 and $585, while also remaining alert to failed breakouts between $595 and $597. With the MSI currently in a Ranging State, patience is warranted, so sit on your hands until conditions improve. Barring any macro surprises out of Washington, our bias remains to the upside, with short setups approached cautiously. Stay aligned with the MSI and the broader bullish narrative. Avoid trading during an MSI Ranging State, and continue to act with discipline and responsiveness to market structure. The MSI continues to offer real-time insight into momentum and structural shifts. When used alongside our Pre-Market and Post-Market Reports, it helps pinpoint high-probability targets and clean entry points, keeping traders in sync with the tape and away from avoidable missteps. If you haven’t yet integrated the MSI and model levels into your process, now is the time. Reach out to your representative to get started. These tools can materially enhance both performance and consistency.
Dealer Positioning Analysis
Summary of Current Dealer Positioning:
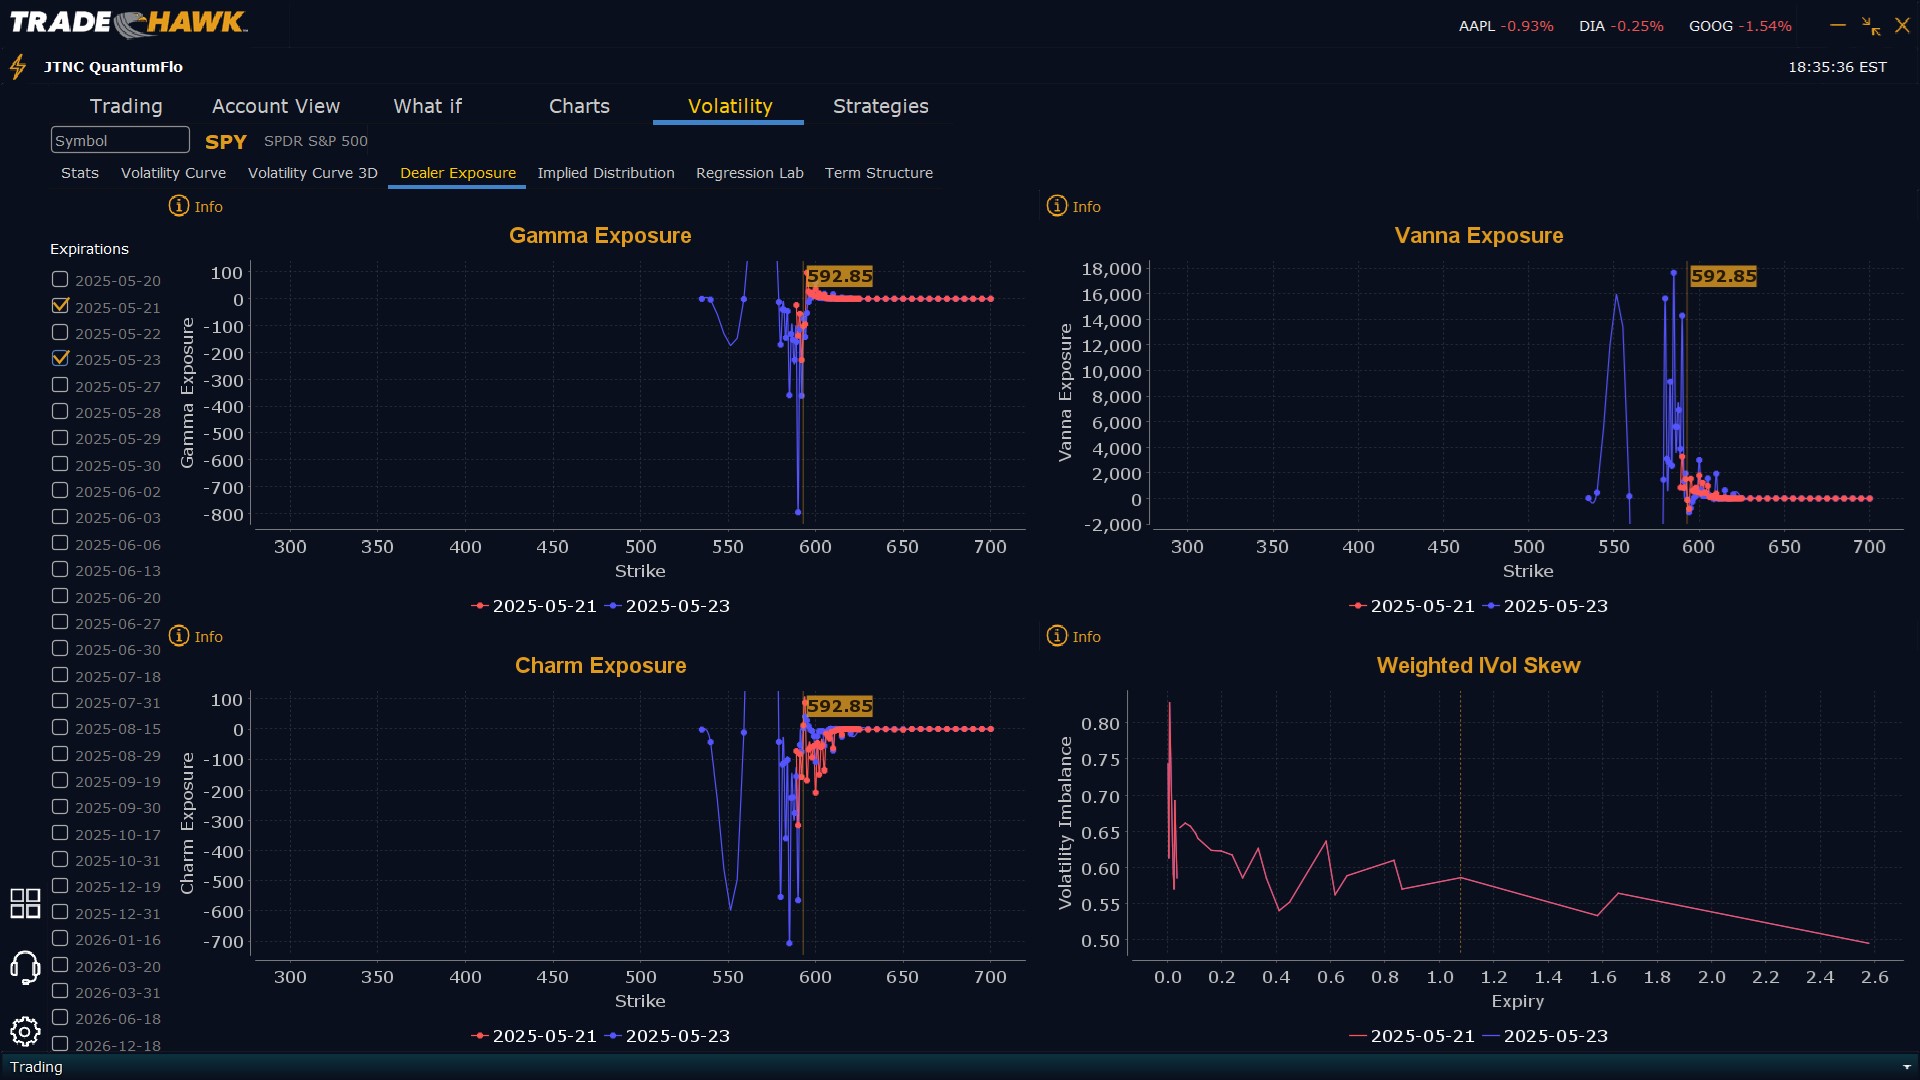
Dealers are selling $595 to $610 and higher strike Calls while buying $593 and $594 Calls indicating the Dealers belief that prices may move a bit higher on Wednesday. Dealers appear to project a ceiling for Wednesday at $600. To the downside Dealers are buying $592 to $500 and lower strike Puts in a 2:1 ratio to the Calls they are selling, implying a neutral posture for Wednesday. Dealer positioning is unchanged from neutral to neutral.
Looking Ahead to Friday:
Dealers are selling $595 to $610 and higher strike Calls while buying $593 and $594 Calls implying Dealers believe prices may continue to rally this week but not beyond $600. To the downside, Dealers are buying $592 to $440 and lower strike Puts in a 2:1 ratio to the Calls they’re selling, reflecting a neutral outlook for the week. Dealer positioning is unchanged from neutral to neutral. We advise reviewing Dealer positioning daily for directional clues. These positions evolve quickly and tracking them is essential for staying ahead of shifting market sentiment.
Recommendation for Traders
With SPY closing at $592.85, traders should continue to lean long while it remains above the $590 level. Look for long entries near $590 with targets at $595 and $597, tightening stops if SPY approaches $600. Short trades between $595 and $600 should be considered only with signs of rejection or failed breakouts. If SPY breaks below $590, look for potential bounces at $586 and $585. Should $585 fail, downside could accelerate quickly. The VIX at 18.09 reflects relatively low volatility, but markets are at a pivot point. Position sizing should remain conservative, and traders should remain flexible in response to price action. Review the premarket analysis posted before 9 AM ET to account for any shifts in the model or Dealer Positioning.
Good luck and good trading!
