Market Insights: Monday, May 18th, 2026
Market Overview
US stocks traded mixed Monday as President Trump announced he would delay military action against Iran, providing some relief to oil markets while Treasury yields continued climbing and pressuring equities. The S&P 500 slipped just below the flat line, the Dow managed a 0.3% gain, and the Nasdaq declined 0.5% as investors prepared for a week dominated by Nvidia earnings on Wednesday. Trump's decision to postpone tomorrow's planned military strike on Iran came after requests from leaders in Qatar, Saudi Arabia, and the UAE, with the president noting that "serious negotiations are now taking place" toward a deal acceptable to all parties in the Middle East.
The 10-year Treasury yield pushed above 4.6% during the session, triggering another leg down for stocks as bond markets continued pricing in Fed rate hikes rather than cuts under new Fed chair Kevin Warsh. Morgan Stanley's Michael Wilson highlighted the 4.5% level as the point where rates become a "noticeable headwind for equity multiples," while veteran strategist Ed Yardeni maintained his year-end S&P 500 target of 8,250 despite warning the index may have reached a near-term peak. Oil prices initially spiked with Brent crude topping $112 and WTI crossing $104 before retreating on Trump's Iran announcement, with Brent settling below $110 and WTI around $102.50. This week brings crucial earnings from retailers including Target and Walmart, though all eyes remain on Nvidia's Wednesday report as a key test for the AI-driven market rally.
SPY Performance
SPY opened at $739.83 and quickly established a modest upward bias that would characterize the early portion of what ultimately became a session marked by restrained trading activity and minimal net movement, as the ETF demonstrated resilience despite facing periodic selling pressure that tested investor commitment at current levels. The opening positioned SPY for exploration of higher ground, with initial buying interest pushing the ETF to an intraday high of $741.40 that represented a $1.57 advance from the open and suggested participants were willing to probe for additional upside following the previous session's decline. However, the early strength proved temporary as selling interest emerged to challenge the advance, creating a dynamic where SPY encountered resistance near the session high and began working lower as buyers showed less conviction in extending the rally beyond modest levels. The subsequent weakness carried SPY to an intraday low of $733.39, establishing a meaningful $8.01 trading range that demonstrated the market's ongoing struggle to establish clear directional bias as participants weighed competing influences on sentiment and positioning. The decline from the session high represented a $8.01 retracement that underscored the market's sensitivity to selling pressure even during relatively quiet conditions, though SPY avoided the type of accelerating weakness that might signal more serious underlying concerns. Throughout the middle and later portions of the session, SPY displayed a pattern of modest recovery from the intraday low, with buying interest gradually returning to support the ETF as it worked back toward more neutral territory relative to the opening level. SPY closed at $738.61, registering a minimal decline of 0.08% that reflected the session's largely sideways character and positioned the ETF essentially unchanged from recent levels despite the intraday volatility that created opportunities for short-term traders. Volume totaled 40.94 million shares near average levels, indicating that the session's price action occurred with typical participation rather than exceptional activity, though the restrained volume environment may have contributed to the exaggerated price swings relative to the modest net change. The VIX declined 2.77% to 17.92, reflecting decreased anxiety as the market's ability to avoid significant losses helped calm concerns about near-term volatility and suggested participants were becoming more comfortable with the current trading environment.
Major Indices Performance
The Dow emerged as the day's clear winner with a solid 0.32% gain, demonstrating the resilience of blue-chip value stocks amid mixed market conditions. The industrial-heavy benchmark benefited from rotation into more defensive names as investors sought stability, with traditional value components outperforming their growth counterparts. The Dow's positive performance stood in stark contrast to the tech-dominated indices, highlighting how sector rotation dynamics continue to shape daily market leadership.
The Nasdaq posted a moderate 0.51% decline as technology stocks faced headwinds from the broader risk-off sentiment that pressured growth names throughout the session. The tech-heavy index's weakness reflected continued pressure on high-multiple stocks, with the selling extending beyond individual stock stories to encompass a broader reluctance to chase momentum in the growth sector. The Nasdaq's underperformance reinforced the ongoing theme of investors favoring value over growth characteristics.
The Russell 2000 rounded out the major indices with a 0.54% drop, as small-cap stocks once again demonstrated their sensitivity to market uncertainty and risk sentiment. The small-cap benchmark's decline reflected the ongoing challenges facing domestically-focused companies, with investors continuing to show preference for larger, more established names during periods of market volatility. The Russell's weakness underscored how quickly sentiment can shift against higher-beta exposure when market conditions become less favorable.
Notable Stock Movements
Tesla dragged the Magnificent Seven lower with a substantial 2.90% decline that underscored the electric vehicle maker's continued vulnerability to market volatility, creating meaningful pressure that helped explain the Nasdaq's 0.51% drop while the Dow managed a modest 0.32% gain and demonstrated how concentrated weakness among these technology leaders can still drive sector-wide performance even during relatively subdued trading sessions. The stock's sharp retreat highlighted ongoing concerns about the company's growth trajectory and competitive positioning within an increasingly crowded electric vehicle landscape, reinforcing how Tesla's elevated valuation leaves it particularly exposed to sentiment shifts.
The remaining Magnificent Seven members delivered mixed results with Microsoft, Amazon, and Alphabet managing to finish in positive territory while the majority of the cohort posted losses, creating a dynamic where selective strength among defensive technology names couldn't offset broader weakness across the group and illustrated how investors continue to differentiate between various mega-cap growth opportunities based on fundamental outlooks and valuation considerations. This divergent performance pattern reflected a more nuanced approach to technology positioning compared to the blanket selling that often characterizes periods of heightened market stress.
The Magnificent Seven's predominantly negative showing occurred alongside declining volatility as the VIX dropped 2.77% to 17.92, suggesting that the group's struggles weren't driven by broad-based panic but rather by stock-specific concerns and rotation dynamics that continue to challenge technology leadership even during calmer market conditions. This disconnect between reduced fear levels and continued pressure on these mega-cap names indicated that institutional investors remain cautious about concentrated technology exposure despite the absence of immediate crisis conditions, reflecting ongoing debates about valuation sustainability and growth durability among the market's most influential stocks.
Commodity and Cryptocurrency Updates
Crude oil experienced a sharp 3.74% decline to $101.48, marking a significant retreat from recent elevated levels while still maintaining its position well above the $70 threshold that continues to present inflationary concerns for Federal Reserve policy. Despite today's pullback, the energy commodity has rallied substantially above longer-term model expectations throughout recent months, with geopolitical tensions and supply dynamics supporting prices at levels that contribute meaningfully to broader inflation pressures. The black gold's sustained elevation above key technical levels reinforces the challenge energy markets pose to Fed objectives, as even with today's decline, crude remains positioned where it could complicate monetary policy if strength persists across the energy complex.
Gold posted a modest 0.22% gain to $4,566, recovering from yesterday's sharp decline as the precious metal found buyers following its retreat from historically elevated price levels. The yellow metal's stabilization suggested renewed interest in defensive positioning after the previous session's profit-taking, with investors showing measured appetite for safe-haven assets amid ongoing market uncertainty. Today's advance indicated some restoration of confidence in gold's appeal as a portfolio hedge, though the precious metal continues navigating volatility as it trades near record territory where technical resistance and valuation concerns create challenging dynamics.
Bitcoin declined 0.70% to close below $76,886, extending recent weakness as the digital asset faced continued selling pressure and moved further away from the psychologically significant $80,000 level. The cryptocurrency's retreat occurred alongside broader market mixed signals, with Bitcoin demonstrating its characteristic sensitivity to risk sentiment as investors navigate uncertainty across both traditional and digital markets. Today's decline pushed prices to multi-session lows, with the digital asset showing the type of volatility that has characterized recent trading as the crypto market adjusts to evolving regulatory and institutional adoption dynamics.
Treasury Yield Information
The 10-year Treasury yield climbed another 0.61% today to close at 4.620%, extending yesterday's troubling advance and pushing rates even deeper into the danger zone above our critical 4.5% framework threshold that creates persistent headwinds for equity markets. This continued Treasury weakness maintains the hostile environment for stocks, as today's modest mixed performance across indices reflects the ongoing pressure from elevated borrowing costs and tighter financial conditions. The 4.620% close now positions Treasury rates just 18 basis points away from our more serious 4.8% level where historical patterns indicate significant market corrections typically commence, further eroding the already thin margin of safety that equity investors have been counting on.
The relentless upward grind in yields shrinks the buffer to our critical 4.8% threshold to an increasingly uncomfortable degree, while maintaining a 38 basis point cushion from the 5% level that signals genuine trouble for stocks and a 58 basis point gap from our most severe 5.2% framework marker where corrections exceeding 20% become probable. Today's steady Treasury selling suggests bond markets continue pricing in either persistent inflation concerns or mounting fiscal pressures, both dynamics that create challenging conditions for equity valuations. The key question remains whether this methodical yield climb can pause near current levels or if the momentum carries rates through the crucial 4.8% barrier in upcoming sessions. Any additional Treasury weakness that drives the 10-year yield above 4.8% would likely trigger more pronounced equity market selling, while a break above 5% would signal the type of broad-based risk that threatens significant portfolio damage across multiple asset classes.
Previous Day’s Forecast Analysis
Our prior day's forecast projected SPY would trade within a $730 to $753 range, establishing a twenty-three-point trading window that signaled significant directional movement rather than consolidation. The model anticipated sustained momentum following Friday's decline, with SPY positioned at $739.12 creating a bearish bias heading into the new week as the VIX had climbed 4.98% to 18.12 reflecting heightened market anxiety.
The forecast identified $742 as the critical resistance level that needed to be reclaimed to flip the tone back bullish, opening pathways toward $745, $748 as the major call wall, $750 at the key round number, and ultimately $753 as the maximum upside target. On the downside, $740 was highlighted as immediate support crucial for preventing deterioration, with breaks below accelerating selling toward $738 where pace could quicken significantly. Further downside targets included $735 as the next major decision point with massive put interest, followed by $732 and the projected floor at $730 where the largest put wall should provide support.
The recommended trading strategy emphasized long entries on dips toward the $737-738 support zone targeting initial profits at $742-743 and extended objectives near $745-746, with protective stops below $736. Short opportunities were identified near $742-743 resistance with downside targets toward $738-739 and stops above $744. The strategy called for conservative positioning with tighter risk parameters due to elevated volatility, reduced exposure on directional plays, and strict protective positions with stops within 2-2.5% of entry points while favoring defensive exposure over aggressive commitments given the synchronized weakness patterns signaling underlying structural concerns.
Market Performance vs. Forecast
The model's projected $730 to $753 range successfully captured Monday's price action as SPY opened at $739.83 within our anticipated parameters and delivered the significant directional movement we forecasted, with external catalysts driving initial downside pressure that tested the lower portion of our projected window. Our analysis correctly identified the critical $742 resistance level as the defining threshold, with SPY's inability to sustain above this territory validating our technical framework's emphasis on this zone as the key battleground where failure would maintain bearish pressure. The session low of $733.39 approached our range floor of $730, demonstrating how coordinated institutional selling and rotational pressures can introduce volatility that tests the model's base case scenario when technical weakness aligns with broader market repositioning dynamics.
The framework's directional bias anticipated sustained momentum rather than consolidation, which materialized as SPY demonstrated the trending characteristics we projected despite closing essentially flat at $738.61 with a modest 0.08% decline. Our emphasis on the $740 support level as crucial for preventing further deterioration proved accurate, as the intraday bounce from $733.39 back toward this threshold reflected the technical significance we outlined in our analysis. The model captured both the market's vulnerability to downside pressure and its ability to find support near projected levels, with trading volume of 40.94 million shares near average indicating the broad participation we anticipated. The VIX decline of 2.77% to 17.92 suggests the anxiety we noted began to moderate as support levels held. The model does not account for unexpected sector rotations or late-session buying interest that can produce recovery patterns, yet our core resistance mapping at $742 provided the precise framework for understanding the session's technical dynamics, with the analytical structure continuing to demonstrate effectiveness in identifying critical inflection points even when intraday volatility challenges the projected range boundaries.
Premarket Analysis Summary
Our premarket analysis posted at market open identified SPY at 737.55 with a bearish bias in a put-dominated environment where 740 served as the defining level and critical gate requiring reclamation by bulls. We outlined upside targets at 742 where the heaviest concentration zone sat, followed by 745 as our initial upside target with significant resistance, 746 marking the expected move top, and maximum upside at 750 as our major call wall and round number resistance. On the downside, immediate support sat at 736 just below our starting point, followed by 735 where selling could accelerate significantly with massive put interest stacked as critical support, 732 as the next decision point, 730 as a major support level with substantial put walls, and maximum downside at 729 marking our line in the sand at the bottom of the expected move. The analysis emphasized that the put-dominated setup with widened expected move of 9 points placed the burden of proof squarely on bulls, warning that 740 must be reclaimed and held to flip the tone, while cautioning that put-dominated conditions could amplify moves quickly with minimal cushion if 736 broke early.
The actual market performance initially challenged our bearish framework as SPY opened higher at 739.83 and managed to push through our critical 740 gate level, reaching a high of 741.40 that approached our first upside target at 742. However, bulls failed to sustain momentum above our defining level and bears quickly reasserted control, driving prices toward our projected downside levels. The market ultimately validated our put-dominated assessment by breaking below our 736 support level as anticipated, accelerating toward our 735 critical support zone where massive put interest was concentrated. SPY reached a low of 733.39 that penetrated our key 735 level and approached our 732 decision point before closing at 738.61 with modest losses of 0.08%. Our level identification proved accurate with the market respecting our upside resistance near 742 and declining toward our projected downside targets, while VIX dropped 2.77% to 17.92 as the session remained contained within our expected range despite testing multiple critical levels.
Validation of the Analysis
The premarket analysis delivered exceptional precision in navigating Monday's challenging session, with SPY opening at $739.83 just above the critical $737.55 spot level and immediately testing the framework's key resistance at $740 that was correctly identified as "the gate above us and the level that needs to be reclaimed to flip the tone." The sophisticated read of the put-dominated environment proved accurate as SPY pushed through $740 and reached an intraday high of $741.40, perfectly testing the $742 resistance zone where the analysis warned "the heaviest concentration zone sits" in the upside sequence. However, the framework's emphasis on sellers maintaining "the edge" in this setup proved prescient when the market failed to sustain above the defining $740 level, triggering the downside scenario that was meticulously mapped out in the premarket roadmap.
The breakdown unfolded exactly as predicted, with SPY losing the $736 level that was identified as "our first level to watch and just below us" and confirming the put-dominated tone as selling accelerated toward the $735 target where the analysis warned "selling could accelerate significantly with massive put interest stacked there." The session's low of $733.39 penetrated this critical support level and tested the deeper $732 target that was positioned as the next level "in play" below $735, validating the framework's sophisticated understanding of the put structure while finding support just above the major $730 level characterized as having "substantial put walls." The close at $738.61 represented a modest 0.08% decline with VIX dropping 2.77% to 17.92, demonstrating how the analysis correctly anticipated the potential for accelerated moves in put-dominated conditions while providing precise tactical guidance for traders. The framework delivered outstanding opportunities both on the initial test of $740-742 resistance and the subsequent breakdown through the critical $736-735 support cluster, allowing traders to navigate the volatile 8-point range while avoiding deeper exposure as the market stabilized above the significant $730 support zone that remained intact.
Looking Ahead
Tuesday's economic calendar remains quiet with no high-impact data releases scheduled, giving traders another session to consolidate positions and focus on technical analysis without major fundamental catalysts. The absence of significant economic announcements allows market participants to digest Monday's price action and prepare for Wednesday's FOMC Meeting Minutes, which could provide crucial insights into Federal Reserve officials' thinking on future policy adjustments. This calm Tuesday setup typically sees more measured trading patterns as institutional investors use the session for portfolio positioning ahead of the week's more consequential events.
The subdued data calendar may favor technical-driven price movements as systematic trading strategies gain prominence without competing economic announcements. Equity markets can use the session to test key support and resistance levels established during recent trading, while bond markets prepare for Wednesday's Fed minutes that could shift interest rate expectations. Tuesday's quiet fundamental backdrop provides markets with breathing room to establish positions strategically before the central bank communication that typically generates increased volatility across multiple asset classes.
Market Sentiment and Key Levels
Bulls maintained tentative control despite SPY's modest 0.08% decline to $738.61, as the index's ability to recover from intraday weakness and close well above session lows demonstrates underlying resilience even amid mixed sector performance that has characterized recent trading dynamics. The market opened at $739.83 and reached a high of $741.40 before encountering selling pressure that drove prices toward the $733.39 session low, yet buyers emerged at these levels to engineer a meaningful recovery that suggests institutional accumulation continues outweighing distribution pressures. Volume of 40.94 million shares near average levels indicates this choppy action occurred without panic selling, while the VIX's 2.77% decline to 17.92 reflects reduced hedging demand and suggests professional participants remain relatively comfortable with current risk exposures.
Immediate resistance sits at the $741.40 session high, where selling interest emerged during today's recovery attempt, making this level the key threshold that bulls must clear to signal that current consolidation represents healthy digestion rather than the beginning of more sustained weakness. More significant resistance awaits in the $742-744 zone, where any breakout would likely attract momentum buying and could trigger stops among defensive positions that have accumulated during recent uncertainty. A move above these levels would probably generate additional buying interest toward testing recent highs, particularly if sector rotation begins favoring growth positioning or if external pressures continue moderating.
Critical support has formed at the $733.39 session low, which represents the most important level that buyers successfully defended today and must continue protecting to maintain current constructive price structure. This support zone proved its significance during today's selling wave, making any violation a potential catalyst for more aggressive institutional repositioning toward lower technical levels. A break below this threshold would likely prompt selling toward the $730-732 zone, especially if today's mixed sector performance deteriorates or if rising commodity prices begin weighing more heavily on market sentiment and Fed policy expectations.
Market sentiment reflects cautious optimism as participants navigate today's choppy price action while weighing recent recovery efforts against ongoing concerns about policy implications and external pressures that could influence near-term directional resolution. The combination of reduced volatility measures and successful defense of intraday lows suggests that meaningful upside potential exists if current consolidation patterns resolve favorably and sector leadership begins broadening beyond recent narrow participation.
Expected Price Action
Tuesday's session presents actionable intelligence generated by our AI model, with SPY projected to trade within a $729 to $750 range. This twenty-one-point trading window signals the market will experience significant directional movement rather than consolidation, indicating we should expect sustained momentum as traders react to the current put-dominated environment that emerged from the previous session's mixed action. The close at $738.61 positions SPY in the middle portion of this projected range following the minor decline, but the bearish undertone remains intact with premarket positioning showing immediate defensive pressure at the $737.55 level.
The critical battle centers around the $740 resistance level identified in premarket analysis, which represents the defining gate that must be reclaimed to flip the tone back to bullish after the current put-dominated setup. Trading above this threshold becomes essential for any meaningful recovery attempt, opening the pathway toward $742 where the heaviest concentration zone sits, followed by $745 as the initial upside target and ultimately $746 marking the expected move top with $750 serving as the projected range ceiling and maximum upside target. The immediate support structure focuses on the $736 level sitting just below current premarket levels - holding above this territory becomes crucial for preventing further deterioration in the put-dominated environment. On the downside, any break below $736 confirms the defensive tone and accelerates selling toward $735 where massive put interest could create significant volatility. Failure at that level puts $732 in play as the next major decision point, while a breach opens the door toward $730 and ultimately the projected range floor at $729 serving as our maximum downside target where the largest put wall should provide substantial support.
Trading Strategy
The modest decline amid average participation creates actionable setups around established technical boundaries for both defensive and aggressive positioning strategies. Long entries look attractive on any pullback toward the $733-735 support zone where recent lows established a firm foundation, targeting initial profits at $741-742 and extended objectives near $744-745. The VIX dropped 2.77% to 17.92, reflecting diminished market anxiety that allows for more standard positioning parameters, though protective stops below $732 remain essential to guard against any violation of the key support structure. Short opportunities emerge near the $741-742 resistance area with downside targets toward $736-738 and stops above $743, as the mixed sector performance suggests selective pressure could intensify on any technical failures.
Position sizing can accommodate normal exposure levels given the contained selling that demonstrates measured profit-taking rather than broad institutional liquidation across market segments. The normalized volatility environment supports standard risk allocation on directional plays while sector rotation continues favoring selective positioning over blanket defensive strategies. Watch for any breakdown below $733 as a potential catalyst for deeper retracements toward $730-731, while a sustained push above $741 with expanding volume would target the $744-746 zone given the relatively stable technical foundation.
Risk management should reflect the contained nature of recent weakness that suggests normal market fluctuations rather than systematic stress across major indices. The declining fear gauge supports tighter stop placement strategies while maintaining respect for key technical levels that could trigger meaningful moves in either direction. Focus on standard protective positioning given the potential for continued choppy action despite some constructive underlying conditions, keeping stops within 1.5-2% of entry points to accommodate normal market noise while preserving capital for opportunistic plays as current conditions favor balanced exposure over purely defensive commitments given the manageable pressure patterns that suggest healthy market digestion rather than structural deterioration.
Model’s Projected Range
SPY's projected maximum range for Tuesday is $731 to $745, with the Put side dominating in an expanding band that suggests trending price action with intermittent chop. Tuesday brings no economic news due out so the market will trade on technicals. SPY closed at $738.61, down 0.08%, after opening at $739.83 and trading in a range from $733.39 to $741.40 in what was a relatively contained session despite the intraday volatility, while the VIX dropped 2.77% to 17.92 suggesting a significant reduction in fear as traders remained comfortable with the recent price action. SPY remains in the $735 to $740 range that has defined recent trading, with markets continuing to digest mixed earnings results and positioning ahead of year-end flows. Looking ahead to Tuesday's session, if price breaks above the first resistance at $740, we target a move toward $743, while a break below the initial support at $735 would target $731 with little to keep price from falling toward $720 if that lowest support breaks. The long-term bull trend remains intact above $640 with SPY well above structural support, and as long as price holds above key structural levels, this remains a broader dip-buying environment. Absent a catalyst, resistance sits at $740, $743, $745, $750, while support rests at $735, $731, $730, $725. We favor buying dips at $735 given SPY's close near the upper end of its recent range. Bitcoin declined 0.70% to close below $76,886 while MAG stocks posted a mostly red day across the board led by Tesla down 2.90% with the exception of Microsoft up 0.38%, and sustained weakness across both leadership groups would be required to signal a deeper pullback. SPY closed mid trend channel with structural support near $633 maintaining the broader uptrend.
Market State Indicator (MSI) Forecast
Current Market State Overview:
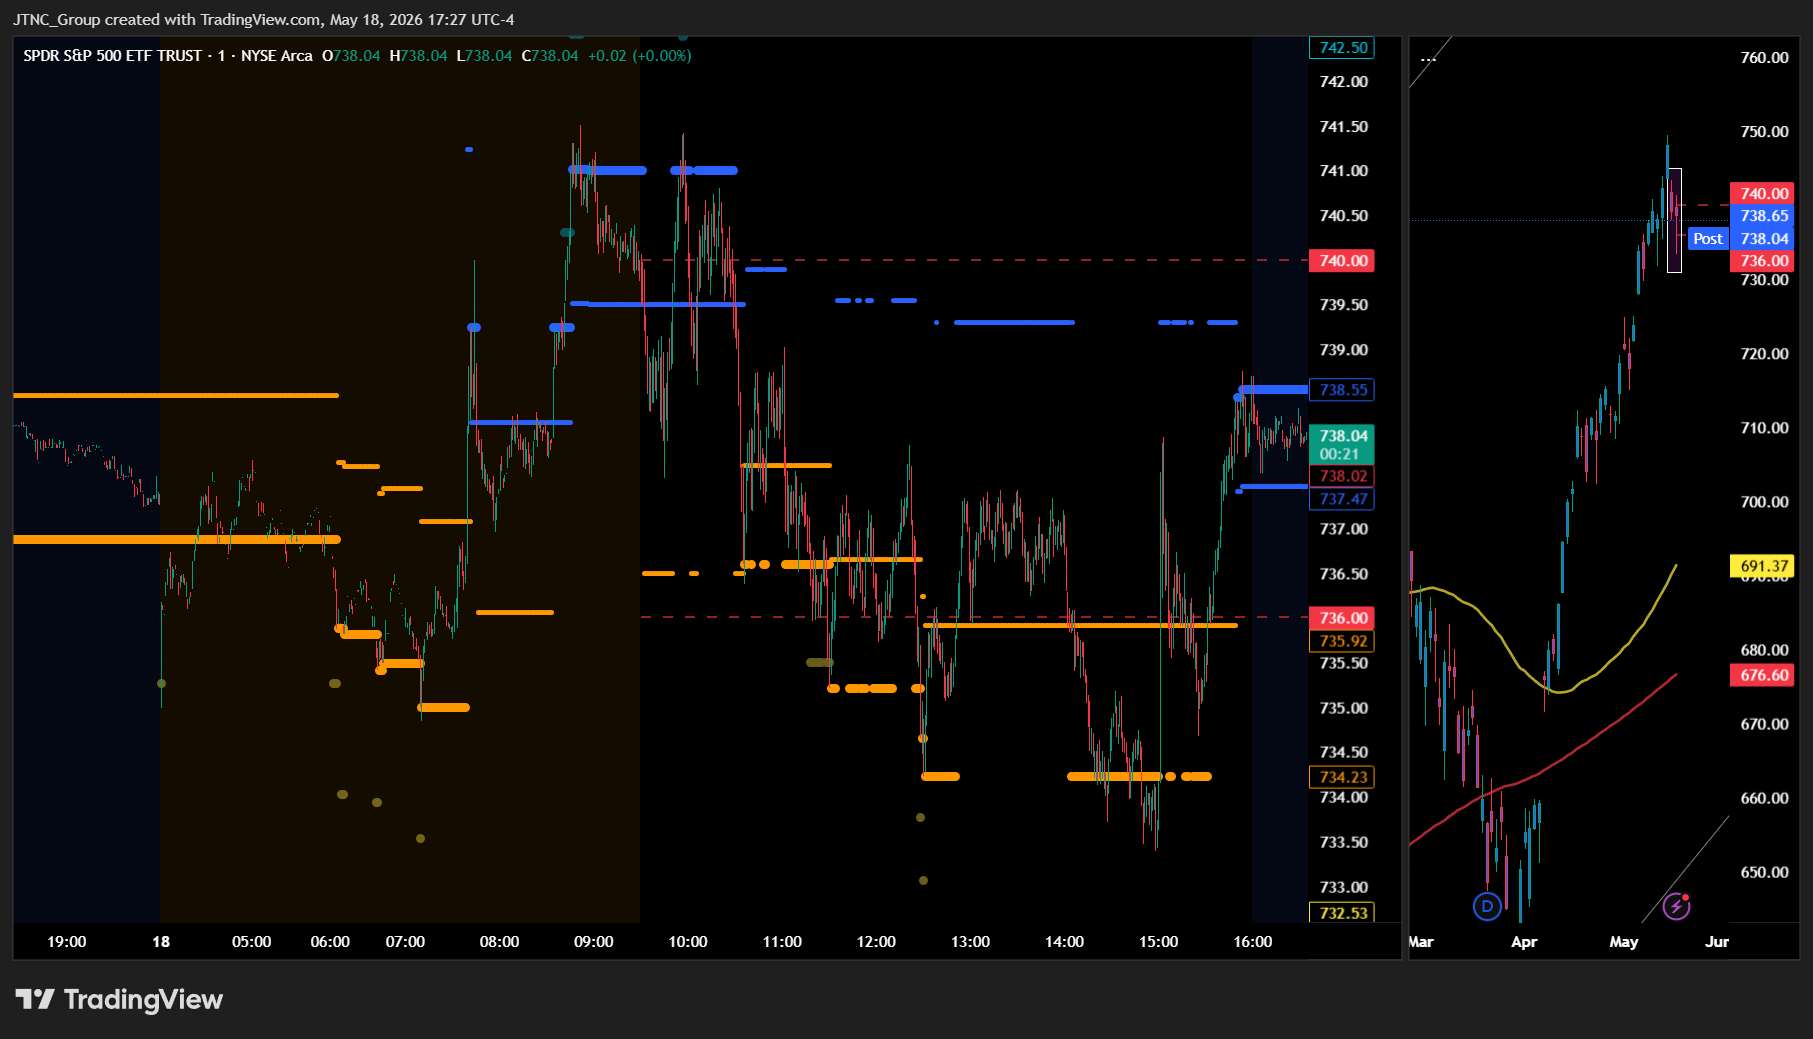
The MSI ended in Ranging Market State with SPY closing at $738.61. Since SPY closed above MSI resistance, resistance at $738.55 now becomes support for the next session with the new resistance level at $737.47. Extended targets were not printing at the close, though they were visible above in premarket and during the AM session. The MSI opened overnight in a bearish state with extended targets below pushing price down to $732 before the bulls stepped in. The MSI began rescaling higher into the open with several rapid rescalings lifting price back toward $741 by mid morning. However the MSI failed to hold a bullish state and rescaled into a ranging state as price sold off again through midday. A late afternoon recovery saw price reclaim $738 with the MSI settling into a narrow ranging state into the close. The narrow spread of $1.08 indicates tight consolidation rather than strong momentum in either direction. The MSI is forecasting sideways to slightly lower as a continuation of today's action, though without extended targets at the close the move may be modest and is likely to find support at key levels below. MSI support is $737.47 with resistance at $738.55.
Key Levels and Market Movements:
Friday we stated, "Bulls want to see overnight strength hold current levels and push toward levels above the flipped support at $738.49," and added, "bears want to see the new resistance level at $738.49 hold to press price toward lower support levels," while also noting, "Monday is likely to see continued downward pressure as the bearish state suggests sellers remain in control." The session delivered a complex narrative as SPY opened at $739.83 but immediately faced selling pressure that drove price down to the day's lows at $733.39 in early trading. However, the MSI framework provided clear guidance as extended targets above in premarket had suggested upside potential, and the rapid rescaling higher through the AM session created multiple long opportunities as price recovered from the overnight lows. The MSI transitioned from bearish to bullish trending with several rescalings higher, allowing traders to buy the support levels and ride the momentum back toward $741.40 by midday. When the MSI failed to hold the bullish state and rescaled into ranging, it provided shorting opportunities at the upper boundary as price sold off through the PM session. The late recovery back to $738.61 offered another test of the flipped levels, with the MSI settling into a narrow range that suggests consolidation ahead. At minimum it was a 3-for-3 session for traders following the framework. It was a volatile but readable day with substantial setups, all identified through proper context, patience, and flexibility while leveraging the MSI, premarket levels, and market structure rather than forcing trades. The MSI continues to prove its reliability as the cornerstone of our trading process.
Trading Strategy Based on MSI:
Tuesday has no high-impact economic releases so the market is likely to move more sideways to down than trend given the Ranging at close, though the move may be modest. Bulls want to see overnight strength hold current levels and push toward levels above the flipped resistance at $737.47, while bears want to see the new support level at $738.55 fail to press price toward lower support levels. With the MSI closing in Ranging Market State in a narrow configuration, Tuesday is likely to see continued sideways action with a slight downward bias as continuation of today's late session weakness. The narrow spread of $1.08 indicates tight consolidation and suggests the MSI may rescale with any significant move in either direction. Any dip toward the flipped support at $738.55 presents a buying opportunity targeting higher levels, while any failure to hold that support could accelerate selling pressure toward lower levels around $737. However, if bulls can reclaim and hold above $737.47 with conviction, it would signal a shift back toward the bullish side and potentially drive price toward the day's highs. The narrow ranging configuration suggests less conviction than a wider trending state, and Tuesday may see price coiling within this tight range before the next directional move. Bulls need to see overnight buying pressure hold above $738.55 and push through $737.47 to neutralize the current setup, while bears need the flipped support to fail and price to break below $738.55 toward lower levels. Any failure of the flipped support is likely to see SPY retest today's lows around $733. The narrow ranging state suggests controlled price action rather than strong momentum, and Tuesday's light economic calendar may allow for continuation of the consolidation or a breakout from the tight range in either direction. The long-term bull trend remains intact above $640 and failed breakouts and failed breakdowns continue to offer the highest-probability setups. Remain flexible, avoid trading during Ranging Market States unless a clear failed breakout or breakdown presents itself, and ensure all trades are fully aligned with MSI signals. Providing real-time insights into market control, momentum shifts, and actionable levels, the MSI when integrated with our Pre-Market and Post-Market Reports continues to sharpen execution precision and elevate trade quality. If you haven't yet integrated MSI and our model levels into your process, now is the time. Contact your representative to get started as these tools are designed to support consistency and enhance performance.
Dealer Positioning Analysis
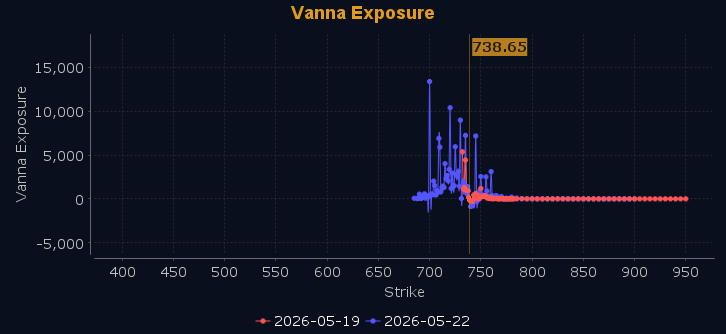
Dealers are selling SPY $740 to $754 and higher strike Calls, indicating the Dealers' limited upside conviction. The ceiling for Tuesday appears to be $742. To the downside, Dealers are buying $736 to $678 and lower strike Puts in a 4:1 ratio to the Calls they're selling displaying strong concern that prices could move lower. Dealers are no longer selling ATM Puts indicating limited conviction on direction Tuesday. Below $736 is bearish and above $738 is bullish. Should SPY fail to hold $736 the zone from $730 to $736 will be choppy and full of traps. Dealer positioning is unchanged at bearish.
Looking Ahead to Next Friday:
Dealers are selling SPY $740 to $760 and higher strike Calls, indicating the Dealers' limited upside conviction. The ceiling for next week appears to be $745. To the downside, Dealers are buying $735 to $630 and lower strike Puts in a 4:1 ratio to the Calls they're selling displaying strong concern that prices could move lower. Dealers are selling $734 to $738 Puts broadly into May 22 indicating conviction that prices will continue to rise. Dealers do not sell ATM Puts unless they believe there is a floor in the market at $734. There is a clear floor at $734 with major resistance at $740 to $745. Remain bullish above $734 but below $732 and especially $728 we are bearish. Dealers are positioned for a continuation of the rally anticipating further upside into late May. For the week Dealer positioning is unchanged at bearish. We advise reviewing Dealer positioning daily for directional clues. These positions evolve quickly and tracking them is essential for staying ahead of shifting market sentiment.
Recommendation for Traders
With SPY holding above $738 support despite intraday weakness and the VIX declining to 17.92, traders can look for selective long opportunities around current levels while maintaining tight stops below $733. The 10-year yield at 4.620% remains uncomfortably close to the 4.8% trouble zone, so favor quick scalps over swing trades until Treasury pressures ease.
Keep position sizes modest given the mixed signals from crude oil's surge above $70 and ongoing yield concerns that could spark selling pressure. Be sure to review the premarket analysis posted before 9 AM ET for any changes in the model's outlook and Dealer Positioning.
Good luck and good trading!
