Market Insights: Monday, May 19th, 2025
Market Overview
Stocks wavered on Monday as investors began the week digesting mixed signals on trade and interest rates. Wall Street opened to uncertainty after the U.S. was stripped of its last AAA credit rating late Friday, casting a shadow over early bullish sentiment. Still, optimism persisted following last week’s temporary U.S.-China tariff rollback, which has helped fuel a robust rebound across equities. However, concerns are mounting that this relief could be fleeting. JPMorgan CEO Jamie Dimon warned that investor confidence in trade progress may be premature, citing elevated tariff levels and limited follow-through from policymakers. Meanwhile, the Fed has hinted at delaying any potential rate cuts until at least September, adding further weight to the market’s cautious tone. Tariffs remain a major topic this earnings season, with Walmart highlighting rising consumer prices. All eyes now turn to Home Depot’s earnings on Tuesday for more clues about consumer strength amid an inflationary environment.
SPY Performance
SPY edged up 0.11% to close at $594.88 after opening at $588.10 and climbing to an intraday high of $595.54. Volume came in slightly below average at 62.85 million shares, indicating a steady but unhurried session. Despite a tepid open, buyers stepped in early, defending the morning low and guiding the ETF to a close just under resistance. Another close above $590 reinforces the broader bullish trend and positions SPY within reach of the March highs. Bulls remain in control so long as price stays above $589.
Major Indices Performance
The Dow led the major indices Monday with a 0.32% gain, supported by renewed interest in industrials and financials. The S&P 500 followed with a modest rise of 0.11%, while the Nasdaq barely budged, gaining just 0.02% as tech momentum cooled. The Russell 2000 lagged significantly, falling 0.46%, suggesting small-cap stocks may be entering a period of relative underperformance amid macro uncertainty. Broader sentiment remains constructive but cautious, especially as attention turns to whether the market can sustain its recent run without immediate economic catalysts.
Notable Stock Movements
It was a solid session for most of the Magnificent Seven, though Tesla and Apple both ended the day in the red. Microsoft stood out with a 1.01% gain, helping to offset broader tech softness. The remaining giants posted slight advances, indicating resilience in megacap tech even as broader indices cooled. Tesla's decline breaks its recent winning streak and may reflect short-term profit-taking. Despite that, the group's general strength signals continued confidence among investors, though selectivity appears to be increasing.
Commodity and Cryptocurrency Updates
Crude oil crept up 0.31% to $62.16, extending its sideways grind as traders continue to assess currency moves and the longer-term path of interest rates. While a softening dollar has supported near-term oil prices, our model still anticipates a drop to the $50 level, where we plan to accumulate. Gold surged 1.40% to close at $3,232, reflecting a flight to safety following the U.S. credit downgrade. Meanwhile, Bitcoin gained 1.19% to end just above $105,400, continuing its steady climb. We remain buyers between $83,000 and $77,000 but do not advise new entries below $77,000 due to downside risk.
Treasury Yield Information
The 10-year Treasury yield nudged higher by 0.23% to close at 4.449%, inching closer to the 4.5% level that often sparks equity jitters. With rates approaching a key inflection point, equity traders are growing more sensitive to moves in yields. If the 10-year pushes above 4.5%, we could see stocks falter. More notably, a breach of 4.8% would likely trigger a broader market correction, and anything north of 5% would mark a serious challenge for risk assets.
Previous Day’s Forecast Analysis
Friday’s outlook projected a bullish bias above $589, with a trading range between $587.50 and $599.75. Upside targets were set at $595, $598, and potentially $600, while downside levels included $585 and $580. The strategy favored long trades above $589 with dips providing entry points, and warned that a drop below $585 could shift momentum in favor of the bears. This analysis came after eight consecutive sessions of higher lows, forming a strong micro channel pointing to continued upward pressure unless support failed.
Market Performance vs. Forecast
Monday’s price action was largely in line with Friday’s forecast. SPY opened at $588.10, right at the lower edge of the model’s projected range, before buyers stepped in above the key $585 level. The ETF held above the $589 bias level for most of the session and climbed to a high of $595.54, just under the $595 resistance target. It then settled at $594.88, nearly matching the projected upside level. The intraday low exactly matched the opening price of $588.10, highlighting how critical support was respected. Traders who bought the early dip and followed the model’s bullish guidance had strong opportunities for clean entries and profitable exits into strength.
Premarket Analysis Summary
In Monday’s premarket analysis posted at 7:41 AM, SPY was trading at $587.59 with a bearish bias below the $591 level. The forecast anticipated downside pressure early in the day, especially if rallies were sold beneath the bias level. Downside targets were set at $585 and $580, while upside resistance was marked at $591, $596.50, and a ceiling at $598. Traders were advised to favor short entries until lower levels stabilized and a potential afternoon rally could develop off intraday support.
Validation of the Analysis
Monday’s trading validated the premarket forecast with precision. SPY opened at $588.10 and quickly dipped, but solid buying interest emerged just above the $585 support zone, pushing the market higher throughout the session. While SPY never broke above the $591 bias level in the morning, the recovery was enough to lift it to a high of $595.54 before fading slightly into the close. The bounce off the lower targets and failure to push through the top of the range matched the premarket script, reinforcing the value of the forecast. Traders who waited for consolidation near $585 and entered on signs of strength had a textbook long opportunity, just as outlined.
Looking Ahead
Tuesday’s session is likely to be quiet from a macro standpoint with no major economic data scheduled. Attention will shift to Thursday’s unemployment claims and PMI numbers, which could inject fresh direction into the market. In the meantime, traders should prepare for more consolidation or slow drift as markets digest the U.S. credit downgrade and recent policy signals from the Fed. Market reaction to Home Depot’s earnings could also shed light on consumer health and spending resilience.
Market Sentiment and Key Levels
SPY closed at $594.88, extending its hold above key support at $589 and positioning itself just below a critical resistance zone between $595 and $597. Bulls remain in control for now, especially with support building in the $586 to $590 range. If SPY breaks and holds above $595, a move toward $600 and even $605 is possible. However, a break below $590 could see prices test $586 or lower. Sentiment leans bullish, but the market is perched near major resistance, and failure to clear this area may prompt a tactical pullback. Volatility remains low, but creeping higher at the margins, so staying nimble is essential.
Expected Price Action
Our AI model projects a trading range of $590 to $598 for Tuesday, offering actionable intelligence for the day ahead. With a bullish bias above $590, the model favors long trades if SPY clears resistance at $595 and sustains momentum. In that scenario, targets at $598 and $600 come into play. On the downside, a break below $590 could send SPY toward $586, where a bounce may present another buying opportunity. If $586 fails, the next downside target is $580. The path of least resistance remains higher, but this week’s lack of catalysts and creeping volatility could create sharp reversals. Traders should watch for failed breakouts or breakdowns and trade accordingly.
Trading Strategy
Traders should prioritize long setups while SPY holds above $590, targeting $595 and $598, and potentially $600 if momentum continues. Tighten stops as SPY approaches resistance levels. Short setups can be considered near $595 to $600, but only with signs of exhaustion or failed breakouts. A break below $590 would open up a move to $586, where long trades may reemerge. A drop below $586 would shift momentum to the downside with $580 as the next target. The VIX rose to 18.14, still under the key pivot at 23, but elevated enough to warrant caution. Trade smaller in size and protect capital with disciplined stop-losses in place.
Model’s Projected Range
The model’s maximum projected range for Tuesday is $589 to $600.50, with the Call side dominating in a narrowing range suggesting consolidation with minor periods of trending behavior. There is little economic data scheduled for release until Thursday, and nothing on the immediate horizon appears poised to serve as a strong catalyst heading into Tuesday. Market attention has shifted toward Congress and its efforts to pass a massive tax cut, which is projected to add at least $2.5 trillion to the federal budget deficit. SPY opened lower following a credit rating downgrade for the U.S. by Moody’s on Friday. However, “buy-the-dip” investors stepped in just above the pivotal $585 level, reversing overnight losses and pushing the market to close the day slightly higher. While a consolidation phase still seems likely, another close above $585 reinforces that bulls remain in firm control. Buyers continue to target the March highs at $597. A breakout above that level could spark a broader rally toward new record highs. Overnight, $586 held firm, and intraday support at $588 helped keep prices moving higher, with SPY closing just below $595. If bulls can continue defending this area, upward momentum is likely to persist. However, a break below $590 could pave the way for a dip back to $585, potentially offering another buying opportunity. That said, repeated tests of the $585 level increase the risk of it eventually failing, as liquidity there is gradually absorbed. Should that level break, it could finally usher in the long-anticipated red day. The question remains: from where will that red day emerge? SPY is trading well above the $565–$585 range, a zone where institutional investors have been reducing exposure. Despite this, volume trends continue to support the strength of the bullish move. Overall, the path of least resistance remains higher, making a return to the April lows increasingly unlikely. Looking ahead to Tuesday, key resistance levels to watch are $600 and $605, with little overhead supply above $600 to impede further gains. On the downside, support levels include $593, $590, and $586. The range between $586 and $595 is showing signs of building support, adding to the strength of the current uptrend. Since April 2, market direction has been shaped primarily by macroeconomic forces; tax policy, tariffs, bond yields, and inflation and that influence is expected to continue absent a significant policy shift from the White House. Meanwhile, the VIX closed at 18.14, rising slightly but remaining well below its critical pivot at 23. Volatility above 23 typically weighs on equities, while lower levels tend to may attempt to push the market higher on Tuesday. The index is climbing within a steep bullish trend channel that began at the April lows, though this pace of ascent may not be sustainable. A period of consolidation or a healthy pullback would be a natural and constructive development. Momentum still favors the bulls, but with volatility elevated and macro risks in play, staying flexible and responsive to evolving price action will be critical in the days ahead.
Market State Indicator (MSI) Forecast
Current Market State Overview:
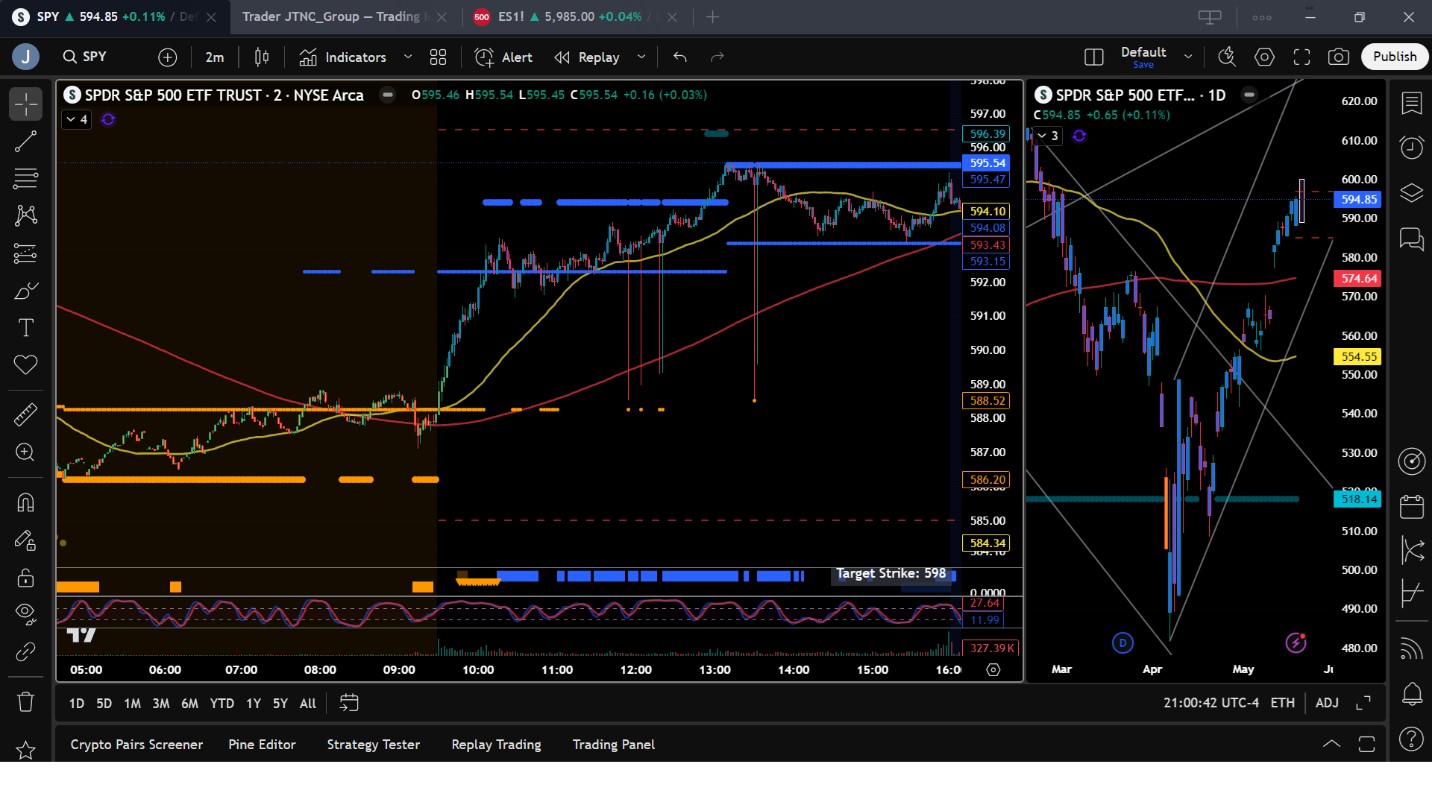
The MSI is currently in a Bullish Trending Market State, with SPY closing mid-range. Extended targets printed only briefly today and were absent into the close. The MSI range has narrowed and is implying a continuing bull trend but one which is clearly weakening. Overnight SPY sold off on a credit rating downgrade by Moody’s which saw the MSI rescale to a bearish state. Just before the open however, the MSI rescaled to a very wide ranging state and then continued to rescale to a bullish state. SPY remained in this state until just before 1 pm when the MSI once again rescaled higher with extended targets above. SPY reached the day’s highs at MSI resistance at $595.47 before pulling back slightly into the close. Current MSI support is $592.15 and resistance is at $595.47.
Key Levels and Market Movements:
On Friday, we noted: “Our model suggests consolidation is likely next week, though it’s possible SPY tests the March highs near $597 before any meaningful pullback occurs.” We also highlighted: “Our model suggests SPY could retest $590 and potentially dip toward $585, where we anticipate buyers will step in.” Finally, we stated: “Momentum still favors the bulls, but the $595–$597 zone is a logical area to consider tactical shorts.” With this actionable framework in hand, SPY came close to testing the $585 level overnight and, as anticipated, buyers stepped in. By the open, the MSI had rescaled to a wide-ranging state, with SPY trading just above MSI support at $589. While we typically avoid initiating trades during a ranging MSI, the fact that $585 held and dip buyers were active along with $590 being a likely area of bullish support presented a compelling case. We entered long on a breakout at the open, targeting MSI resistance at $592.25 for our first target. By 10:04 am, that level was achieved, and with the MSI shifting to a bullish state, we set our second target at MSI resistance at $594.35. Upon reaching that level, extended targets began to print. We tightened risk by moving our stop to breakeven and held the remaining 10% of our position, setting our final target at MSI resistance at $595.50. While we considered aiming for the premarket level of $596.50, extended targets stopped printing quickly, and price hovered around $595.35 for nearly an hour. Given the stall and time of day, we chose to lock in gains and reverse short, aiming to secure a scalp into the close. We set our first short target at MSI support at $593.15, but the uptrend proved resilient. The bears lacked follow-through, and SPY formed a double bottom and a weak failed breakdown around 3:22 PM. With limited downside and time running out, we exited the short with a scalp profit and closed the day. Two for two: one trend trade, one counter-trend scalp, executed with discipline, a clear plan, and the precision of our model and the MSI. The MSI continues to prove its value identifying who holds control, when control shifts, and where actionable levels reside. It enables sharp entries, timely exits, and when combined with a structured trading framework, becomes a powerful engine for consistent performance. We continue to strongly recommend integrating the MSI into your trading process. With a clear plan, it offers alignment with dominant market forces, helps avoid traps, and supports confident, informed decision-making.
Trading Strategy Based on MSI:
This week is light on material economic data until Thursday, giving the market room to consolidate. Today’s dip was bought aggressively, highlighting the strength of the ongoing rally. SPY is now approaching the March highs and sits within striking distance of all-time highs. While the eight-day micro channel broke today, the market closed higher after a $10 intraday selloff, clearly showing who remains in control. As we've consistently noted, reclaiming $585 sidelined the bears and opened the door to higher prices with minimal resistance above. Despite the strong momentum, we’re entering a seasonally weaker period where extended rallies are less common. The MSI is also beginning to show signs of a weakening bull trend. Our model suggests a period of consolidation is likely, though a test of the March highs near $597 could still occur before any meaningful pullback. Today, the MSI rescaled higher after transitioning out of a weak bearish and wide-ranging state. Volume came in near average, another supportive data point for the rally. While another pullback toward $585 remains probable, the broader uptrend remains intact. We continue to favor long setups, but like today, are increasingly open to tactical two-way trades, especially near well-defined edges. Our model suggests SPY could press toward $597, and potentially dip to retest $585, where buyers are likely to step in again. As long as $590 holds, a push toward $597 is likely, with a potential breakout attempt toward $600. The $595–$600 zone is a logical area to consider tactical short setups. With $600 in reach, there’s a strong probability that level is tested before any deeper correction sets in. We recommend watching for failed breakdowns near $590 and remaining alert to failed breakouts near $597. The MSI remains in a bullish state, signaling continued trend strength, barring any macro surprises out of Washington. Until we see a confirmed red day, our bias remains to the upside, with short setups approached cautiously. Stay aligned with the MSI and the prevailing bullish narrative. Avoid trading during Ranging States, and as always, remain disciplined and responsive to what the market offers. The MSI continues to provide real-time insight into momentum and structural shifts. When paired with our Premarket and Postmarket Reports, it helps pinpoint high-probability targets and clean entry points, keeping traders in sync with the tape and away from costly missteps. If you're not yet incorporating the MSI and model levels into your trading process, now is the time. Contact your representative to get started as these tools can significantly enhance your performance and consistency.
Dealer Positioning Analysis

Summary of Current Dealer Positioning:
Dealers are selling $595 to $610 and higher strike Calls indicating the Dealers belief that prices may move sideways on Tuesday. Dealers appear to project a ceiling for Tuesday at $599. To the downside Dealers are buying $594 to $500 and lower strike Puts in a 2:1 ratio to the Calls they are selling, implying a neutral posture for Tuesday. Dealer positioning is unchanged from neutral to neutral.
Looking Ahead to Friday:
Dealers are selling $595 to $610 and higher strike Calls implying the Dealers believe prices may continue to rally this week but not beyond $600. To the downside, Dealers are buying $594 to $440 and lower strike Puts in a 2:1 ratio to the Calls they’re selling, reflecting a neutral outlook for the week. Dealer positioning is unchanged from neutral to neutral. We advise reviewing Dealer positioning daily for directional clues. These positions evolve quickly and tracking them is essential for staying ahead of shifting market sentiment.
Recommendation for Traders
With SPY closing at $594.88 and bulls defending key support, traders should continue to lean long while the ETF remains above $590. Watch for long entries near $590 with profit targets at $595 and $598, and consider tightening stops near $600. Short trades may be considered between $595 and $600 only with signs of weakness or failed breakouts. A break below $590 could lead to a retest of $586 or even $580, both potential buy zones if buyers step back in. The VIX at 18.14 signals low-to-moderate volatility, but traders should be cautious with position sizing and be prepared for sudden moves. Review the premarket analysis posted before 9 AM ET to stay aligned with model updates and Dealer Positioning shifts.
Good luck and good trading!
