Market Insights: Friday, May 16th, 2025
Market Overview
Wall Street ended the week on a quietly positive note as the S&P 500 notched its fifth straight daily gain and investors shrugged off growing concerns over trade tensions and weakening consumer sentiment. The market continued its rebound following Monday’s surprise U.S.-China tariff rollback, which fueled early-week optimism. Despite that, sentiment cooled Friday after President Trump’s sweeping tax and spending bill failed to clear a key vote. The S&P 500 rose nearly 0.7%, the Dow climbed 0.8%, and the Nasdaq added 0.5%, capping a week of strong gains with the tech-heavy index up roughly 7% over the past five sessions.
Momentum was further bolstered by outsized weekly gains in names like Nvidia and Tesla, while investors showed renewed appetite for risk. That enthusiasm was tempered slightly as the University of Michigan consumer sentiment survey revealed a sharp drop in confidence, with the index falling to 50.8—its second-lowest reading on record. Inflation expectations jumped to 7.8%, the highest in over four decades, stirring unease even as equities continued their grind higher. President Trump, meanwhile, hinted that letters would soon be sent to countries detailing new tariff rates, keeping geopolitical risk simmering beneath the surface. For now, the bulls are firmly in charge, but Friday’s soft sentiment data and legislative roadblocks around tax reform are reminders of the risks still lurking in the background.
SPY Performance
SPY climbed 0.67% to close at $594.44 on Friday, notching its fifth straight daily gain and building on the week’s bullish momentum. After opening at $585.56, the ETF dipped to a session low of $589.28 before rallying sharply into the afternoon and peaking at $594.40. Volume was slightly below average at 62.78 million shares, consistent with a calm options expiration session. The strong close above $590 marks continued upward progress for the bulls, with SPY now within striking distance of its March highs and potentially setting up for a breakout toward new records.
Major Indices Performance
The Russell 2000 outperformed Friday with a 0.92% gain, signaling fresh interest in small-cap stocks as market breadth improved. The Dow followed with a 0.73% rise, driven by strength in consumer and industrial names, while the S&P 500 climbed 0.67%, its fifth gain in a row. The Nasdaq trailed slightly, adding 0.52%, though the tech-heavy index still posted an impressive 7% gain for the week. The bullish tone was supported by ongoing optimism around easing trade tensions, although Friday’s sharp decline in consumer sentiment introduced some caution into an otherwise upbeat environment.
Notable Stock Movements
It was a broadly positive session for the Magnificent Seven, with Tesla, Alphabet, and Netflix leading the charge higher. Tesla extended its winning streak to four weeks, while Nvidia also stood out with strong weekly gains, returning to positive territory for the year. Meta and Apple were the only laggards on the day, both slipping slightly. The group’s resilience amid mixed macro data highlights ongoing investor confidence in megacap tech, though Friday’s dip in sentiment may prompt more selective buying going forward.
Commodity and Cryptocurrency Updates
Crude oil rebounded 1.15% to settle at $62.34, continuing its volatile stretch as traders weigh the impact of shifting currency dynamics and interest rate expectations. While the dollar's recent pullback could spark a near-term oil rally, our model continues to forecast a move toward the $50 level, where we plan to accumulate. Gold slid 0.87% to $3,198, giving back part of Thursday’s gains as investor demand cooled slightly. Bitcoin inched up 0.48% to close just below $104,000, maintaining its tight trading range. We remain buyers between $83,000 and $77,000 and do not recommend initiating positions below $77,000 due to elevated downside risk.
Treasury Yield Information
The 10-year Treasury yield dipped slightly by 0.25% to close at 4.444%, offering further support to equities as yields hover safely below the critical 4.5% threshold. The modest decline reflects lingering investor uncertainty over inflation and the Fed’s next steps. As long as yields remain under 4.5%, equities are likely to stay supported. However, should they rise toward 4.8% or higher, the risk of broad market correction intensifies considerably.
Previous Day’s Forecast Analysis
Thursday’s outlook projected a bullish bias above $585, forecasting a potential move toward $593 with a model range of $583 to $595. Long trades were favored above $585, especially on dips, while short setups were only to be considered if SPY broke below $580. The analysis stressed early profit-taking and warned of potential chop unless momentum pushed firmly through resistance levels. Key support levels included $585 and $580, with resistance noted at $590 and $593, aligning with a scenario favoring continued upside unless key supports were broken.
Market Performance vs. Forecast
Friday’s session closely mirrored Thursday’s forecast, with SPY opening at $585.56 and quickly building momentum off support at $589.28. It climbed to a session high of $594.40, comfortably inside the model’s projected range of $583 to $595. The bullish bias above $585 proved once again to be an effective pivot, as long trades initiated near support delivered clean entries and solid returns. The model’s upside target of $593 was hit by early afternoon, and a close just above that level signals growing momentum toward testing March highs. Overall, Friday’s price action confirmed the accuracy and effectiveness of the previous day’s forecast.
Premarket Analysis Summary
In Friday’s premarket analysis posted at 7:39 AM, SPY was trading at $591.84 with a bias level set at $589. The outlook favored long trades above that mark, while caution was advised on the short side unless a clear entry presented itself from a high level in the range. The analysis projected potential resistance at $593.50 and $595, with downside targets at $589, $586, and $583.50. It emphasized the likelihood of consolidation and a gentle drift into the weekend, warning that any upside follow-through would likely stall or reverse back toward support.
Validation of the Analysis
Friday’s market behavior validated the premarket analysis nearly point-for-point. SPY held above the $589 bias level throughout the day, bouncing cleanly off support near $589.28 and advancing steadily toward the $593.50 and $595 resistance zones identified in the morning forecast. The move followed the script of a late-week drift higher, with bulls pressing the advantage without triggering an overbought reversal. The session high of $594.40 fell just short of the upper target, but the close above $594 solidified bullish momentum. Traders who followed the premarket roadmap were rewarded with well-structured long opportunities and clear exits.
Looking Ahead
Next week begins with a quiet calendar as Monday through Wednesday feature no major economic data releases. The first significant reports arrive Thursday with unemployment claims and PMI data, which could provide the next directional cue for markets. With few immediate catalysts on the horizon, traders should expect consolidation or modest drift early in the week unless an external event jolts sentiment.
Market Sentiment and Key Levels
SPY ended the session at $594.44, keeping bullish sentiment intact and positioning the ETF just beneath its March highs. Bulls continue to hold control above the key $589 level, with upward pressure likely to persist so long as that support holds. Key resistance levels to watch are now $595, $598, and $600, while important support zones lie at $593, $590, and $585. A breakout above $595 could trigger a fast move toward $600, but a failure at current levels may spark a test of $590 or $585. With the VIX at 17.24, volatility remains muted, which generally favors bullish continuation unless a macro shock emerges.
Expected Price Action
Our AI model projects a trading range of $587.50 to $599.75 for Monday, offering actionable intelligence for the upcoming session. With a bullish bias above $589, the model favors long trades on dips or clean breakouts. A push through $595 could lead to acceleration toward $598 and potentially $600. On the flip side, a sustained move below $589 would likely invite a test of $585, and if that level fails, SPY may revisit $580. Though bulls remain in control, the pace of the recent ascent suggests a possible pause or brief pullback before another leg higher. Traders should remain flexible and responsive to shifts in momentum.
Trading Strategy
Traders should continue to prioritize long setups while SPY trades above $589, with upside targets at $595 and $598. A breakout above $595 could offer a run toward $600, especially if volume picks up. Short trades remain lower probability but can be considered near $595 or higher with tight stops. If SPY breaks below $589, look for a quick dip toward $585 as a potential buying opportunity. A move below $585 would favor tactical short trades with downside targets at $580 and $577. Risk should be managed carefully, particularly with the VIX at 17.24, signaling low volatility and an environment conducive to fast directional moves if sentiment shifts.
Model’s Projected Range
The model’s maximum projected range for Monday is $587.50 to $599.75, with the Call side dominating in an expanding range suggesting consolidation with periods of trending behavior. There is little economic data scheduled for release until next Thursday, and nothing on the immediate horizon appears poised to serve as a strong catalyst heading into Monday. Market focus has shifted toward Congress and its efforts to pass a massive tax cut, projected to add at least $2.5 trillion to the federal budget deficit. SPY opened the session higher following an overnight rally and experienced a modest mid-morning pullback, which set the stage for a move to the day’s highs. Today was monthly options expiration, so much of this month’s positioning rolled off at the close. It’s likely the market enters a consolidation phase as Market Makers reset their books for the coming month. Still, another close above $585 confirms that bulls remain firmly in control. As previously discussed, they appear to be setting up to challenge the March highs near $597. A breakout above that level could trigger a broader rally toward new record highs. Throughout the day, support at $589 held firm, keeping prices elevated. If bulls can continue to defend that level, upward momentum may persist. However, a break below $590 could open the door to a dip toward $585, potentially a buying opportunity if the move turns out to be a failed breakdown. Should $585 give way, it may finally bring about the long-anticipated red day. The key question isn’t if a red day will come, but from where. Currently, SPY is trading above the $565–$585 zone, an area where institutional investors have been reducing exposure. Despite that, today’s strong volume lends credibility to the continuation of the bullish trend. Broadly, the path of least resistance remains higher, making a revisit of the April lows less likely. Looking ahead to Monday, key resistance levels to watch are $595, $598, and $600. On the downside, support levels to monitor include $593, $590, and $585. A supply zone is developing between $595 and $600, while support is building between $580 and $585 suggesting a potentially balanced trading range early next week. Since April 2, market direction has been largely shaped by macroeconomic forces like tariffs, bond yields, and inflation. This trend is likely to continue barring a significant policy shift from the White House. Meanwhile, the VIX closed at 17.24, continuing its decline and remaining well below its pivot level of 23. Volatility above 23 tends to weigh on equities, while lower readings support bullish behavior. With SPY closing above $595, bulls remain in clear control and may attempt to push the market higher on Monday. However, the index is climbing within a steep bullish trend channel that began at the April lows, and this pace of ascent may not be sustainable. A period of consolidation or a healthy pullback would be a natural development. Momentum still favors the bulls, but the environment remains volatile. Staying flexible and responsive to evolving price action will be critical in the days ahead.
Market State Indicator (MSI) Forecast
Current Market State Overview:
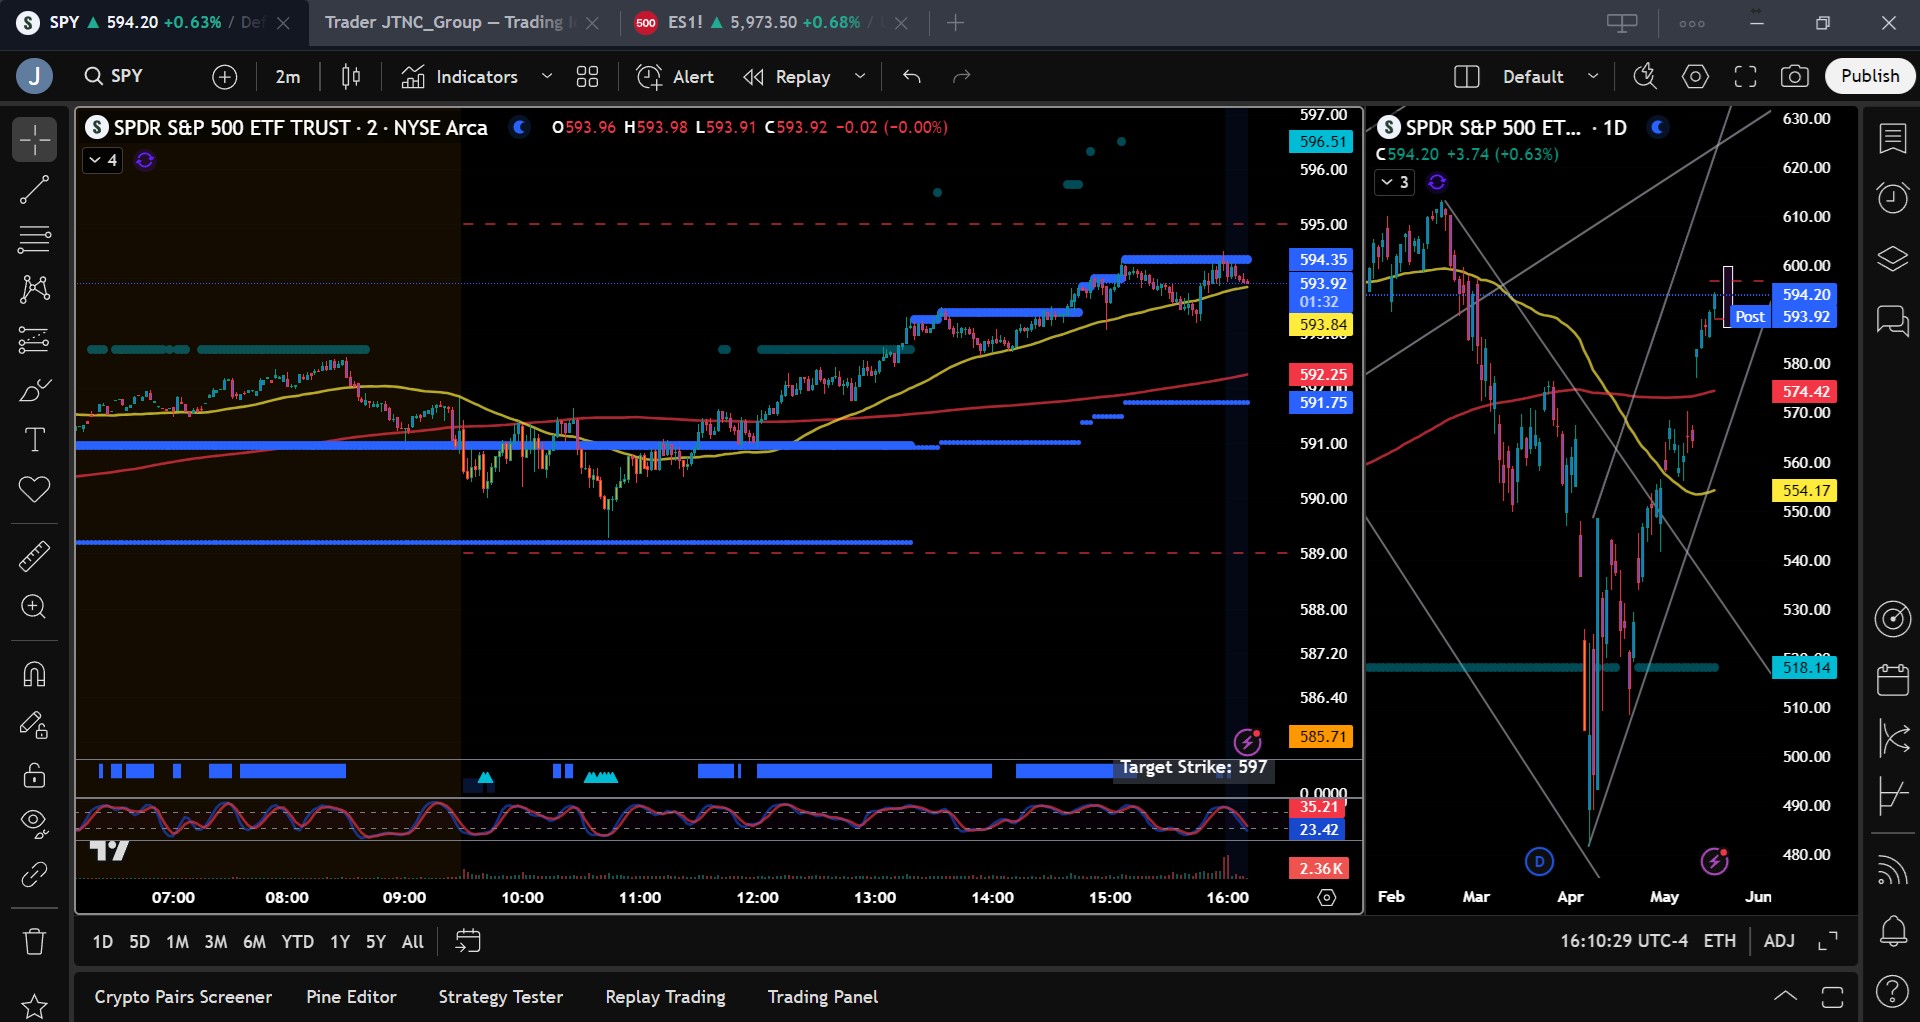
The MSI is currently in a wide Bullish Trending Market State, with SPY closing just below MSI resistance. Extended targets printed for several hours during the midday as well as sporadically in the afternoon session. Into the close there were no extended targets printing. The range of the MSI however implies a continuing bull trend into next week. Overnight SPY moved higher with the MSI printing extended targets from 4 am until 8:40 am. The MSI remained in the wide bullish state from yesterday’s close which contained price until the late morning. Extended targets started printing again and the MSI rescaled higher four times, leading to the day’s highs. But once extended targets ceased printing, SPY came off its highs and settled just below MSI resistance. Current MSI support is $591.75 and resistance is at $594.35.
Key Levels and Market Movements:
On Thursday, we noted: “the trend remains higher and we continue to defer to that strength.” We also stated: “buyers remain firmly in control and are pressing toward the April highs near $597,” and “We recommend focusing on failed breakdowns near key support zones at $588.” With this actionable insight in hand, SPY opened just above $591 and above MSI resistance turned support without extended targets printing. We stayed patient, waiting for price to reach a level conducive to a long entry. At 10:42 AM, that opportunity came. SPY set up a textbook failed breakdown at MSI support at $589.25. We entered long, targeting MSI resistance at $591. This level was reached by 11:10 AM, at which point we took off 70% of our position. Our next target was the premarket level of $593.50. As the MSI began printing extended targets, it confirmed that the broader market was participating in the rally. We hit our second target just after 1:30 PM and moved our stop to breakeven to let the remaining 10% of the position ride. With the premarket suggesting an upper target of $595, we eyed that zone for a potential final exit. By 3 PM, the MSI had rescaled higher three more times but failed to print meaningful extended targets. We exited our trade at $594.25 shortly after 3 PM and called it a day. One and done and a monster trade it was, thanks to disciplined execution, a clear plan, and the precision of both our model and the MSI. The MSI continues to demonstrate its value by identifying who holds control, when control shifts, and where actionable levels lie. It enables sharp entries and timely exits. When combined with a structured trading framework, the MSI aligns you with dominant market forces, helps avoid traps, and supports confident profit-taking. We continue to strongly recommend integrating the MSI into your trading process. With a clear plan, it becomes a powerful engine for long-term consistency and performance.
Trading Strategy Based on MSI:
Next week is light on material economic data until Thursday, so the market is likely to take some time to consolidate. The strength of this rally has been impressive, with SPY now approaching the March highs after pushing beyond the "liberation day" levels. While the University of Michigan Consumer Sentiment report indicated elevated consumer fear, also reflected in weaker-than-expected Retail Sales earlier this week, that data was gathered prior to the Administration’s decision to ease China tariffs. As we anticipated, it had little impact on the market today. Instead, with options expiration and positioning aligned with further upside, SPY delivered another strong green day, marking eight consecutive sessions of higher lows. This pattern has formed what our model identifies as a micro channel, a clear signal of trend strength and herd behavior driving price action in a single direction. We’ve consistently noted that reclaiming $585 would put the bears on the sidelines, and from there, price would have little resistance to the upside. While a pullback is inevitable given micro channels eventually resolve, these structures can persist for 10 to 15 sessions or more. We're not forecasting that duration here, but it's important context for understanding current market dynamics. Despite the impressive momentum, we’re entering a seasonally weaker time of year where sustained rallies are less common. Our model suggests consolidation is likely next week, though it’s possible SPY tests the March highs near $597 before any meaningful pullback occurs. The trend remains higher, and we continue to defer to that strength. Today, the MSI rescaled higher multiple times and printed extended targets for part of the session, confirming the underlying bullish momentum. Volume also came in above average, another point in favor of the rally. While a pullback toward $585 or even $580 is probable, the broader uptrend remains intact. We continue to favor long setups, though we are increasingly open to tactical two-way trades, especially at well-defined edges. Our model suggests SPY could retest $590 and potentially dip toward $585, where we anticipate buyers will step in. If $590 holds, a move toward $597 is likely, with a potential breakout attempt toward $600. Momentum still favors the bulls, but the $595–$597 zone is a logical area to consider tactical shorts. With $600 within reach, there is a strong probability the market touches that level before undergoing a deeper correction. We recommend focusing on failed breakdowns near $590 and staying alert for failed breakouts near $595. The MSI remains in a wide bullish state, signaling robust trend strength, assuming no macro surprises out of Washington. Until we see a confirmed red day, our bias remains to the upside, with caution on the short side. Continue to stay aligned with the MSI and the prevailing bullish narrative. Avoid trading when the MSI enters a Ranging State, and as always, stay disciplined and responsive to what the market offers. The MSI continues to deliver real-time insight into momentum and structural shifts. When paired with the Premarket and Postmarket Reports, it helps identify high-probability targets and clean entry points keeping traders in sync with the tape and away from costly missteps. If you're not yet using the MSI and model levels in your process, now is the time. Contact your representative to get started as these tools can significantly enhance your trading performance.
Dealer Positioning Analysis
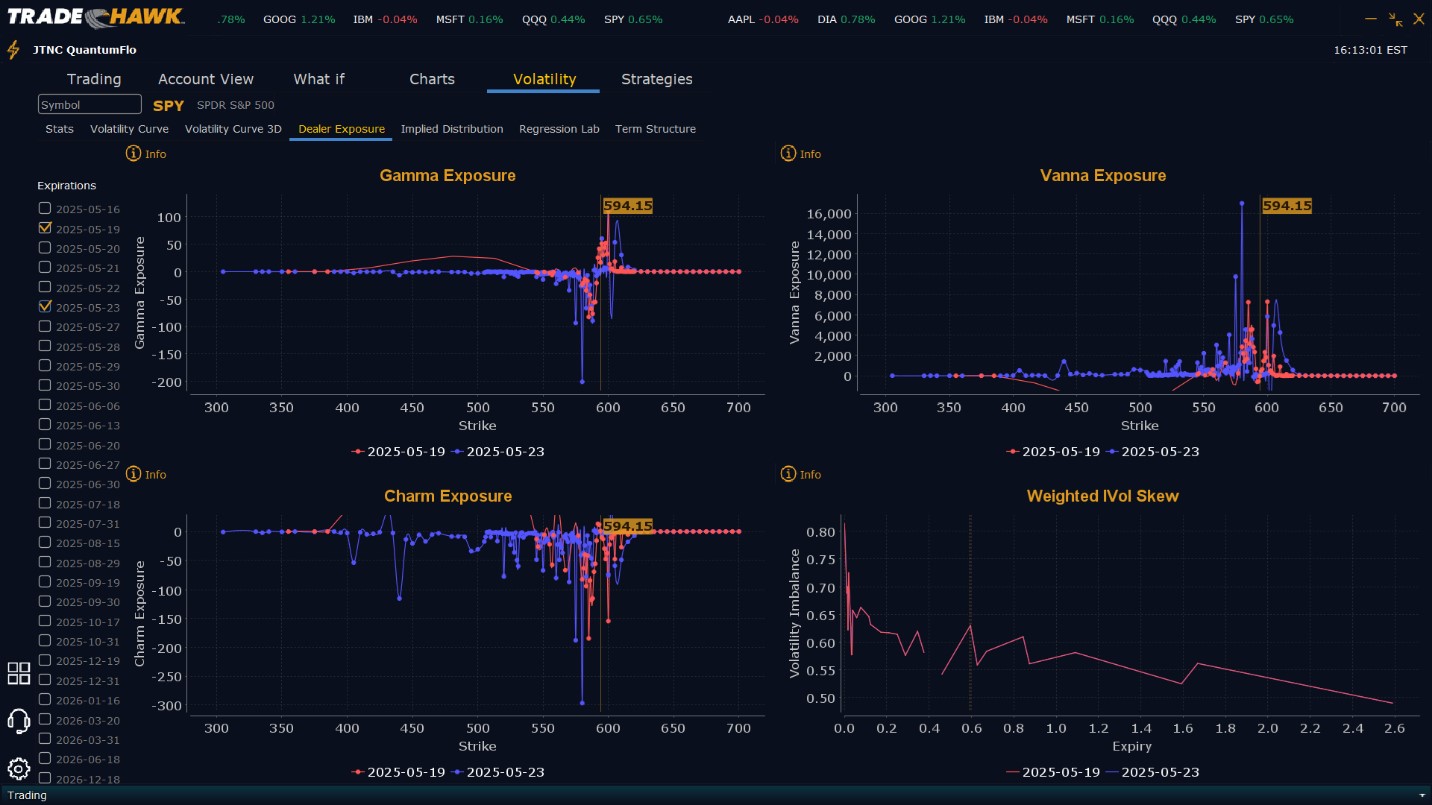
Summary of Current Dealer Positioning:
Dealers are selling $595 to $610 and higher strike Calls while selling $592 to $594 Puts indicating the Dealers belief that prices may continue to rally on Monday. Dealers appear to project a ceiling for Monday at $598. To the downside Dealers are buying $591 to $500 and lower strike Puts in a 2:1 ratio to the Calls/Puts they are selling, implying a neutral posture for Monday. Dealer positioning has changed from slightly bearish to neutral.
Looking Ahead to Next Friday:
Dealers are selling $595 to $610 and higher strike Calls implying the Dealers believe prices may continue to rally next week but not beyond $600. To the downside, Dealers are buying $594 to $440 and lower strike Puts in a 2:1 ratio to the Calls they’re selling, reflecting a neutral outlook for next week. Dealer positioning has changed from slightly bearish to neutral. We advise reviewing Dealer positioning daily for directional clues. These positions evolve quickly and tracking them is essential for staying ahead of shifting market sentiment.
Recommendation for Traders
With SPY closing at $594.44 and bulls holding the upper hand, traders should continue to lean long while the ETF trades above $589. Look for long entries near $590 with targets at $595 and $598, and consider trailing stops if SPY surges toward $600. Short trades may be attempted from $595 or higher, but only with confirmation of weakness. A drop below $589 could lead to a pullback toward $585, which may offer another long opportunity on a failed breakdown. Volatility remains low with the VIX at 17.24, so maintain tighter stops and watch for any macro headlines to shift sentiment. As always, review the premarket analysis posted before 9 AM ET to refine your plan based on the latest model levels and Dealer Positioning.
Good luck and good trading!
