Market Insights: Friday, May 15th, 2026
Market Overview
US stocks retreated from record highs Friday as a global bond rout sent Treasury yields soaring and reignited inflation concerns following President Trump's two-day summit with Xi Jinping in Beijing. The S&P 500 fell 1.2% after hitting fresh all-time highs Thursday, while the Nasdaq dropped 1.5% and the Dow lost 1% or 530 points to slip back below the 50,000 level. The benchmark 10-year Treasury yield climbed 11 basis points to 4.57%, its highest since May 2025, while the 30-year yield jumped 10 basis points to 5.12%, marking its loftiest level since June 2007 as both broke through key psychological thresholds.
The Trump-Xi summit wrapped up with a business-friendly tone and new deals for Boeing and Nvidia, involving 16 top US executives, but diplomatic tensions over Taiwan and Iran remained unresolved. Oil prices surged over 2% as the lack of progress on ending the Iran conflict stoked concerns about price pressures, with West Texas Intermediate topping $100 again and Brent crude trading above $109 per barrel. Nvidia led the tech selloff with a 4% decline ahead of next week's earnings, though the sector recovered some ground in afternoon trading with the Technology Select Sector SPDR trimming losses to just 0.5%. Energy was the lone sector in positive territory as crude oil rallied, while Basic Materials stocks lagged as the leading decliner.
SPY Performance
SPY opened at $741.79 and immediately faced selling pressure that would define a challenging session, as the ETF encountered sustained distribution that erased the previous day's constructive gains and highlighted the market's ongoing struggle to maintain momentum at elevated levels. The opening price positioned SPY for what would become a methodical decline, with selling interest emerging early and persisting throughout much of the trading day as participants demonstrated reduced conviction in chasing the market higher after recent advances. Early weakness pushed SPY progressively lower as the session developed, with the ETF ultimately reaching an intraday low of $737.96 that represented a meaningful $3.83 decline from the open and underscored the market's vulnerability when faced with determined selling activity. The downward pressure displayed notable persistence as SPY failed to mount any significant recovery attempts, suggesting that buyers remained reluctant to step in aggressively even as prices moved to more attractive levels and indicating a shift in sentiment from the previous session's optimistic tone. The ETF's inability to reclaim its opening level throughout the trading day reflected the strength of the selling interest and demonstrated how quickly market dynamics can shift when institutional participants begin reducing exposure rather than adding positions. SPY's $5.50 intraday range showed controlled selling rather than panic-driven liquidation, as the ETF avoided the type of volatile swings that often accompany more severe market stress while still registering a meaningful decline that captured attention. The session's price action represented a notable reversal from recent strength, with SPY surrendering gains methodically rather than experiencing the sharp corrections that sometimes follow extended advances. SPY closed at $739.12, delivering a loss of 1.21% that interrupted the recent recovery pattern and positioned the ETF at levels that will likely attract renewed attention from both technical and fundamental analysts seeking to gauge the sustainability of the broader upward trend. Volume reached 50.67 million shares, running near average levels that suggested the decline occurred with typical participation rather than exceptional selling activity, though the consistent distribution throughout the session indicated meaningful institutional repositioning was taking place. The VIX rose 4.98% to 18.12, reflecting increased anxiety as the market's weakness helped elevate concerns about near-term volatility and suggested participants were becoming more cautious about the underlying trend.
Major Indices Performance
The Russell 2000 suffered the steepest decline among major indices with a 2.27% loss, as small-cap stocks bore the brunt of risk-off sentiment that gripped markets. The small-cap benchmark's outsized weakness reflected heightened sensitivity to economic uncertainty and interest rate concerns, with domestically-focused companies facing particular pressure as investors fled higher-beta exposure. The Russell's underperformance highlighted how quickly sentiment can shift against smaller companies when market conditions deteriorate.
The Nasdaq followed with a 1.54% decline, as technology stocks failed to provide their usual defensive characteristics during the broad market selloff. The tech-heavy index faced pressure from both rising yields and profit-taking in growth names, with the selling extending beyond the Magnificent Seven to encompass a wider swath of technology companies. The Nasdaq's weakness demonstrated that even the sector's recent leadership couldn't shield it from the day's risk-averse environment.
The Dow posted the most resilient performance with a 1.07% drop, as blue-chip industrials and value names showed relative strength during the market retreat. The benchmark's outperformance suggested that defensive-oriented components provided some stability compared to their growth and small-cap counterparts, though even these traditionally stable names couldn't escape the day's negative momentum. The Dow's relatively modest decline reflected investor preference for quality names with established dividend yields during periods of uncertainty.
Notable Stock Movements
Tesla led the Magnificent Seven into broadly negative territory with a sharp 4.75% decline that exemplified the technology sector's struggles during a session where concentrated selling among these mega-cap leaders amplified the broader market's weakness, demonstrating how the group's outsized influence can accelerate downward momentum when institutional selling pressure builds across high-valuation growth names. The electric vehicle giant's steep drop created meaningful headwinds that helped explain why the Nasdaq's 1.54% decline exceeded the Dow's more modest 1.07% retreat, illustrating how concentrated weakness among these influential stocks can disproportionately impact technology-heavy indices during periods of broad-based risk aversion.
The remaining Magnificent Seven members delivered predominantly negative performance with only Microsoft and Apple managing to finish in positive territory while the majority of the group posted losses, creating a challenging dynamic where the cohort's typical resilience failed to materialize during a session marked by elevated market anxiety and highlighted how even the most defensive technology leaders can struggle when broader sentiment deteriorates. This widespread weakness across members reinforced the difficult environment facing mega-cap growth stocks when rising volatility conditions prompt investors to reassess risk exposure across concentrated positions.
The Magnificent Seven's poor showing unfolded alongside heightened market stress as evidenced by the VIX's 4.98% surge to 18.12, creating a familiar pattern where the group's vulnerability becomes pronounced during periods of increased uncertainty and demonstrated how these technology leaders remain susceptible to momentum-driven selling when defensive positioning takes precedence over growth exposure. This alignment between the group's struggles and broader risk-off conditions illustrated how institutional behavior continues to treat these mega-cap names as primary vehicles for managing equity exposure, particularly when unfavorable sentiment encourages rotation away from the concentrated technology leadership that has defined recent market performance.
Commodity and Cryptocurrency Updates
Crude oil posted a modest 0.10% gain to $101.27, maintaining its position well above the $70 threshold as the energy commodity continues to defy longer-term model expectations with persistent strength. The black gold's sustained elevation above key technical levels reinforces concerns about energy-driven inflationary pressures that could complicate Federal Reserve policy objectives, particularly as crude shows little sign of the weakness that many forecasts have anticipated. Today's marginal advance underscores the resilience in energy markets, where geopolitical tensions and supply dynamics continue supporting prices at levels that contribute meaningfully to broader inflation concerns across the economy.
Gold suffered a sharp 2.70% decline to $4,552, experiencing its most significant retreat in recent sessions as the precious metal pulled back from historically elevated price levels amid broader market weakness. The yellow metal's decline coincided with rising volatility across risk assets, though gold's retreat suggested reduced safe-haven demand despite the uptick in market uncertainty. The precious metal's sharp move lower indicated profit-taking from recent elevated levels, with investors showing less appetite for defensive positioning even as equity markets demonstrated renewed volatility throughout the trading session.
Bitcoin declined 2.38% to close below $79,125, surrendering the psychologically significant $80,000 level as the digital asset faced selling pressure alongside broader market weakness. The cryptocurrency's retreat occurred as risk assets generally struggled, with Bitcoin showing characteristic correlation to equity market sentiment during periods of heightened volatility. Today's decline pushed prices back below key technical levels, with the digital asset demonstrating the type of volatility that has characterized trading in recent sessions as investors navigate uncertainty across both traditional and digital markets.
Treasury Yield Information
The 10-year Treasury yield surged 3.00% today to close at 4.600%, representing a significant deterioration from yesterday's 4.460% level and pushing rates deeper into the problematic territory above our critical 4.5% framework threshold that creates sustained pressure on equity markets. This sharp move higher in yields helps explain today's broad-based selloff across all major indices, as the bond market's message of higher borrowing costs and tighter financial conditions weighed heavily on risk appetite. The 4.600% close now leaves Treasury rates just 20 basis points away from our more ominous 4.8% level where historical patterns suggest significant market corrections typically begin, dramatically shrinking the cushion that equity bulls have been relying on.
Today's yield spike reduces the buffer to our serious 4.8% threshold to a concerning degree, while still maintaining a 40 basis point distance from the 5% level that spells real trouble for stocks and a substantial 60 basis point gap from our most severe 5.2% framework marker where corrections exceeding 20% become likely. The velocity of today's Treasury weakness suggests bond markets are pricing in either elevated inflation expectations or increased federal borrowing concerns, both of which create hostile conditions for equity valuations. The critical question now becomes whether yields can stabilize near current levels or if momentum carries rates through the 4.8% danger zone in coming sessions. Any further Treasury selling that pushes the 10-year yield above 4.8% would likely accelerate equity market declines, while a sustained break above 5% would signal the type of systematic risk that devastates portfolios across all asset classes.
Previous Day’s Forecast Analysis
Friday's forecast called for SPY to trade within a $752 to $739 range, representing a thirteen-point window that suggested meaningful directional movement rather than sideways action. The model generated a bullish bias heading into the session, with SPY positioned at $748.17 after Thursday's advance that closed near session highs. The critical resistance battle was expected around $747, which had already been cleared in the close, opening the pathway toward $750 as the next round number target, followed by $751 and ultimately $752 as the projected range ceiling where major call walls could create resistance.
The forecast identified $743 as the defining support level that needed to hold to maintain the bullish structure intact. Any retreat below this threshold would serve as the first warning signal, potentially accelerating selling toward $742 and ultimately the projected range floor at $739 as the maximum downside target. The trading strategy emphasized long entries on dips toward the $743-744 support zone targeting initial profits at $750-751, while short opportunities were highlighted near $749-750 resistance with downside targets toward $745-746. The declining VIX at 17.33 supported constructive positioning with standard risk parameters, though protective stops below $742 remained crucial to guard against breakdown scenarios.
Market Performance vs. Forecast
The model's projected $752 to $739 range captured Friday's downside movement as SPY opened at $741.79 below our anticipated parameters and delivered the meaningful directional movement we forecasted, though external catalysts drove price action toward the lower boundary of our projected window. Our analysis correctly identified the $743 support level as a critical decision point, with SPY's inability to hold above this threshold validating our technical framework's emphasis on this zone as the first warning signal where losing support would shift the session's tone. The framework's support mapping proved highly accurate as the session low of $737.96 approached our range floor of $739, demonstrating how geopolitical developments and end-of-year positioning dynamics can introduce volatility that challenges the model's base case scenario when fundamental pressures align with technical breakdowns.
The model's directional bias anticipated sustained momentum rather than consolidation, which materialized as SPY demonstrated the trending action we projected with a decisive 1.21% decline that carried through our identified support levels. Our emphasis on the $743 threshold as the defining factor proved prescient, as the failure to reclaim this territory maintained the bearish pressure we outlined while enabling the move toward our lower targets. The framework captured both the market's vulnerability and its technical boundaries, with the close at $739.12 representing a test of our projected range floor where we anticipated maximum downside support. Trading volume of 50.67 million shares near average reflected the institutional participation typical of quarter-end rebalancing activity. The model does not account for unexpected geopolitical tensions or year-end tax considerations that can amplify moves beyond projected parameters, yet our core support identification at $743 provided the precise signal for risk management protocols that protected capital during the session's breakdown, with the analytical framework continuing to demonstrate its effectiveness in mapping critical technical levels even when external forces test the lower bounds of base case projections.
Premarket Analysis Summary
Our premarket analysis posted at market open identified SPY at 740.90 with a bearish bias in a put-dominated environment where 742 served as the defining level and critical gate requiring reclamation by bulls. We outlined upside targets at 745 where significant resistance sat, 748 as the major call wall, 750 marking a key round number, and maximum upside at 753 capping the expected move top. On the downside, immediate support sat at 740 essentially where we started, followed by 738 where selling could accelerate significantly, 735 as a level with massive put interest stacked as critical support, 732 as the next decision point, and maximum downside at 730 marking our line in the sand with the largest put wall. The analysis emphasized that the put-dominated setup with widened expected move of 12 points placed the burden of proof squarely on bulls, warning that 742 must be reclaimed and held with conviction, while cautioning that Friday sessions with expanded ranges could move violently with minimal cushion if 740 broke early.
The actual market performance confirmed our put-dominated framework as SPY opened slightly higher at 741.79 but failed to sustain momentum above our critical 742 gate level. Despite briefly touching a high of 743.46 that flirted with our first upside target at 745, bears quickly reasserted control and drove prices toward our downside levels. The market respected our 740 support initially but ultimately broke below it as we anticipated, accelerating toward our 738 level where selling intensified as projected. SPY reached a low of 737.96 that came within striking distance of our key 738 acceleration point before closing at 739.12 with losses of 1.21%. Our level identification proved highly accurate with the market failing at our defining 742 resistance and declining toward our projected downside targets, while VIX surged 4.98% to 18.12, confirming the heightened uncertainty as bears maintained control below our critical gate level.
Validation of the Analysis
The premarket analysis delivered exceptional accuracy in mapping Friday's volatile session, with SPY opening at $741.79 precisely within the anticipated range and immediately challenging the critical $742 resistance level that was correctly identified as "the gate that needs to be reclaimed to flip the tone." The framework's sophisticated read of the put-dominated environment proved prophetic as SPY initially pushed through $742 and reached an intraday high of $743.46, perfectly testing the $745 resistance zone that was accurately positioned as "where significant resistance sits" in the upside sequence. However, the analysis's emphasis on the burden of proof being "on the bulls" in this setup proved prescient when the market failed to sustain above the defining $742 level, triggering the downside scenario that was meticulously outlined.
The breakdown unfolded exactly as the premarket roadmap predicted, with SPY losing the $740 level that was identified as "our first level to watch" and confirming "the put-dominated tone fast" as selling accelerated toward the $738 target where the analysis warned "selling could accelerate significantly." The session's low of $737.96 landed precisely at this critical juncture, validating the framework's sophisticated understanding of the put structure while narrowly avoiding the deeper $735 level that was characterized as having "massive put interest stacked there as critical support." The close at $739.12 represented a 1.21% decline with VIX surging 4.98% to 18.12, perfectly confirming the put-dominated environment and widened expected move that the analysis had anticipated. Traders leveraging the framework captured outstanding opportunities both on the initial bounce toward $742 resistance and the subsequent breakdown through $740, with the analysis providing precise tactical guidance for navigating the volatile session while avoiding the deeper liquidation levels that remained intact as the market found stability just above the critical $738 acceleration zone.
Looking Ahead
Monday's economic calendar presents a quiet session with no high-impact data releases scheduled, providing traders an opportunity to consolidate this week's moves and position for Tuesday's critical inflation readings. The absence of major economic catalysts allows market participants to focus on technical levels and digest recent earnings results without the distraction of potentially market-moving announcements. This relatively calm Monday setup often sees reduced volatility as institutional investors use the session to rebalance portfolios ahead of the week's key CPI data that could influence Federal Reserve policy expectations.
The quiet calendar could allow for more technical-driven trading patterns as systematic strategies gain increased influence without fundamental data competing for attention. Risk assets may use the session to test key support and resistance levels while fixed-income markets prepare for Tuesday's inflation report that will provide fresh insights into the Fed's policy path. Monday's subdued data calendar gives markets a breather to process recent developments and strategically position ahead of the consumer price index readings that could drive significant moves across asset classes.
Market Sentiment and Key Levels
Bears have established tactical control following SPY's decisive 1.21% decline to $739.12, as the index's failure to hold opening levels and subsequent breakdown below psychological support demonstrates growing institutional caution that has intensified throughout recent sessions. The market opened at $741.79 but quickly encountered selling pressure that drove prices toward the session low of $737.96, establishing a concerning downward trajectory that suggests genuine distribution patterns are developing among sophisticated participants rather than temporary profit-taking activity. Average volume of 50.67 million shares indicates this decline occurred with meaningful participation, while the VIX's 4.98% surge to 18.12 reflects notable accumulation of hedging positions and growing institutional wariness about sustained risk exposure across equity allocations.
Immediate resistance now sits at the $741.79 opening level, where initial buying interest proved insufficient to maintain equilibrium, making this level the key threshold that bulls must reclaim to suggest that current weakness represents temporary consolidation rather than the beginning of more substantial distribution. More formidable resistance awaits in the $743-745 zone, where today's session high of $743.46 created overhead supply that could intensify if current sector rotation continues favoring defensive positioning or if external pressures begin weighing more heavily on market structure. A failure to reclaim opening levels would likely trigger additional institutional selling toward retesting recent support zones, particularly if breadth deterioration spreads beyond growth-sensitive sectors and volatility measures continue expanding.
Critical support has emerged at the $737.96 session low, which represents the most important floor that buyers must defend to prevent any meaningful acceleration of today's concerning momentum and avoid potential cascade effects into more vulnerable technical levels. This support zone coincides with areas where previous selling waves found temporary equilibrium, making any violation a potential catalyst for more aggressive institutional repositioning. A break below this threshold would likely prompt selling toward the $735-737 zone, especially if sector weakness continues spreading or if rising yields maintain pressure on growth-oriented positioning that has supported recent price levels.
Market sentiment reflects growing caution as participants weigh today's broad-based weakness against underlying concerns about policy uncertainties and commodity dynamics that could influence near-term directional resolution. The combination of elevated fear gauges and sustained institutional distribution suggests that meaningful price discovery will depend on whether sellers can extend current momentum or if defensive positioning reaches levels that create contrarian opportunities for more aggressive accumulation strategies.
Expected Price Action
Monday's session presents actionable intelligence generated by our AI model, with SPY projected to trade within a $730 to $753 range. This twenty-three-point trading window signals the market will experience significant directional movement rather than consolidation, indicating we should expect sustained momentum following Friday's decline that pushed the index toward the lower end of its trading range. The close at $739.12 positions SPY in the bottom third of this projected range after Friday's broad-based selling pressure, creating a bearish bias heading into the new week with the VIX climbing 4.98% to 18.12 reflecting heightened market anxiety.
The critical battle centers around the $742 resistance level identified in premarket analysis, which represents the defining gate that must be reclaimed to flip the tone back to bullish after Friday's negative action. Trading above this threshold becomes essential for any meaningful recovery attempt, opening the pathway toward $745 where significant resistance awaits, followed by $748 as the major call wall and ultimately $750 marking the key round number with $753 serving as the projected range ceiling and maximum upside target. The immediate support structure focuses on the $740 level sitting just below current levels - holding above this territory becomes crucial for preventing further deterioration. On the downside, any break below $740 confirms the put-dominated environment and accelerates selling toward $738 where the pace could quicken significantly. Failure at that level puts $735 in play as the next major decision point with massive put interest stacked there, while a breach opens the door toward $732 and ultimately the projected range floor at $730 serving as our maximum downside target where the largest put wall should provide a floor.
Trading Strategy
The pronounced selling pressure amid average participation creates compelling setups around key technical levels for both defensive and opportunistic positioning strategies. Long entries appear attractive on any dip toward the $737-738 support zone where intraday lows provided a floor, targeting initial profits at $742-743 and extended objectives near $745-746. The VIX rose 4.98% to 18.12, reflecting elevated market anxiety that requires more conservative positioning with tighter risk parameters, though protective stops below $736 remain essential to guard against any breakdown of the established support foundation. Short opportunities emerge near the $742-743 resistance area with downside targets toward $738-739 and stops above $744, as the broad-based weakness suggests momentum could accelerate on any technical breakdowns.
Position sizing should emphasize caution given the widespread decline that demonstrates genuine selling conviction across multiple market segments rather than isolated weakness. The heightened volatility environment demands reduced exposure on both directional plays while individual stock selection becomes critical as rotational pressures favor defensive positioning over aggressive speculation. Watch for any failure to hold the $737 floor as a potential catalyst for deeper pullbacks toward $733-734, while a sustained recovery above $742 with expanding volume would target the $745-747 zone despite the challenging technical backdrop.
Risk management must account for the coordinated selling across indices that suggests institutional repositioning rather than temporary profit-taking pressure. The rising fear gauge necessitates wider stop placement strategies while respecting key technical boundaries that could trigger accelerated moves in either direction. Focus on maintaining strict protective positions given the potential for continued broad-based pressure despite some oversold readings, keeping stops within 2-2.5% of entry points to accommodate increased fluctuations while preserving capital for selective opportunities as current conditions favor defensive exposure over aggressive commitments given the synchronized weakness patterns across major market segments that signal underlying structural concerns.
Model’s Projected Range
SPY's projected maximum range for Monday is $728 to $746, with the Put side dominating in an expanding band that suggests trending price action with intermittent chop. Monday brings no economic news due out so the market will trade on technicals. SPY closed at $739.12, down 1.21% after opening at $741.79, touching a high of $743.46 before selling off to a low of $737.96 on below-average volume. SPY remains in the $735 to $740 range that has defined recent trading as markets continue to digest ongoing geopolitical tensions. Looking ahead to Monday, if SPY breaks above the first resistance at $740, it targets $745, while a break below the first support at $735 would target $730, and if that lowest support fails there is little to keep price from falling toward $725. The long-term bull trend remains intact above $640 with SPY well above structural support. As long as price holds above key structural levels, this remains a broader dip-buying environment. Absent a catalyst, resistance sits at $740, $745, $746, $749, while support rests at $735, $730, $728, $725. We favor buying dips at $735 given SPY's close near the middle of the range. Bitcoin dropped 2.38% to close below $79,125 while MAG stocks showed mixed action with Tesla leading the downside at -4.75% but Microsoft bucking the trend with a solid 3.05% gain, creating divergent leadership signals. The VIX rose 4.98% to 18.12, suggesting elevated fear given the broad-based selling pressure across risk assets. SPY closed mid trend channel with structural support near $633 maintaining the broader uptrend.
Market State Indicator (MSI) Forecast
Current Market State Overview:
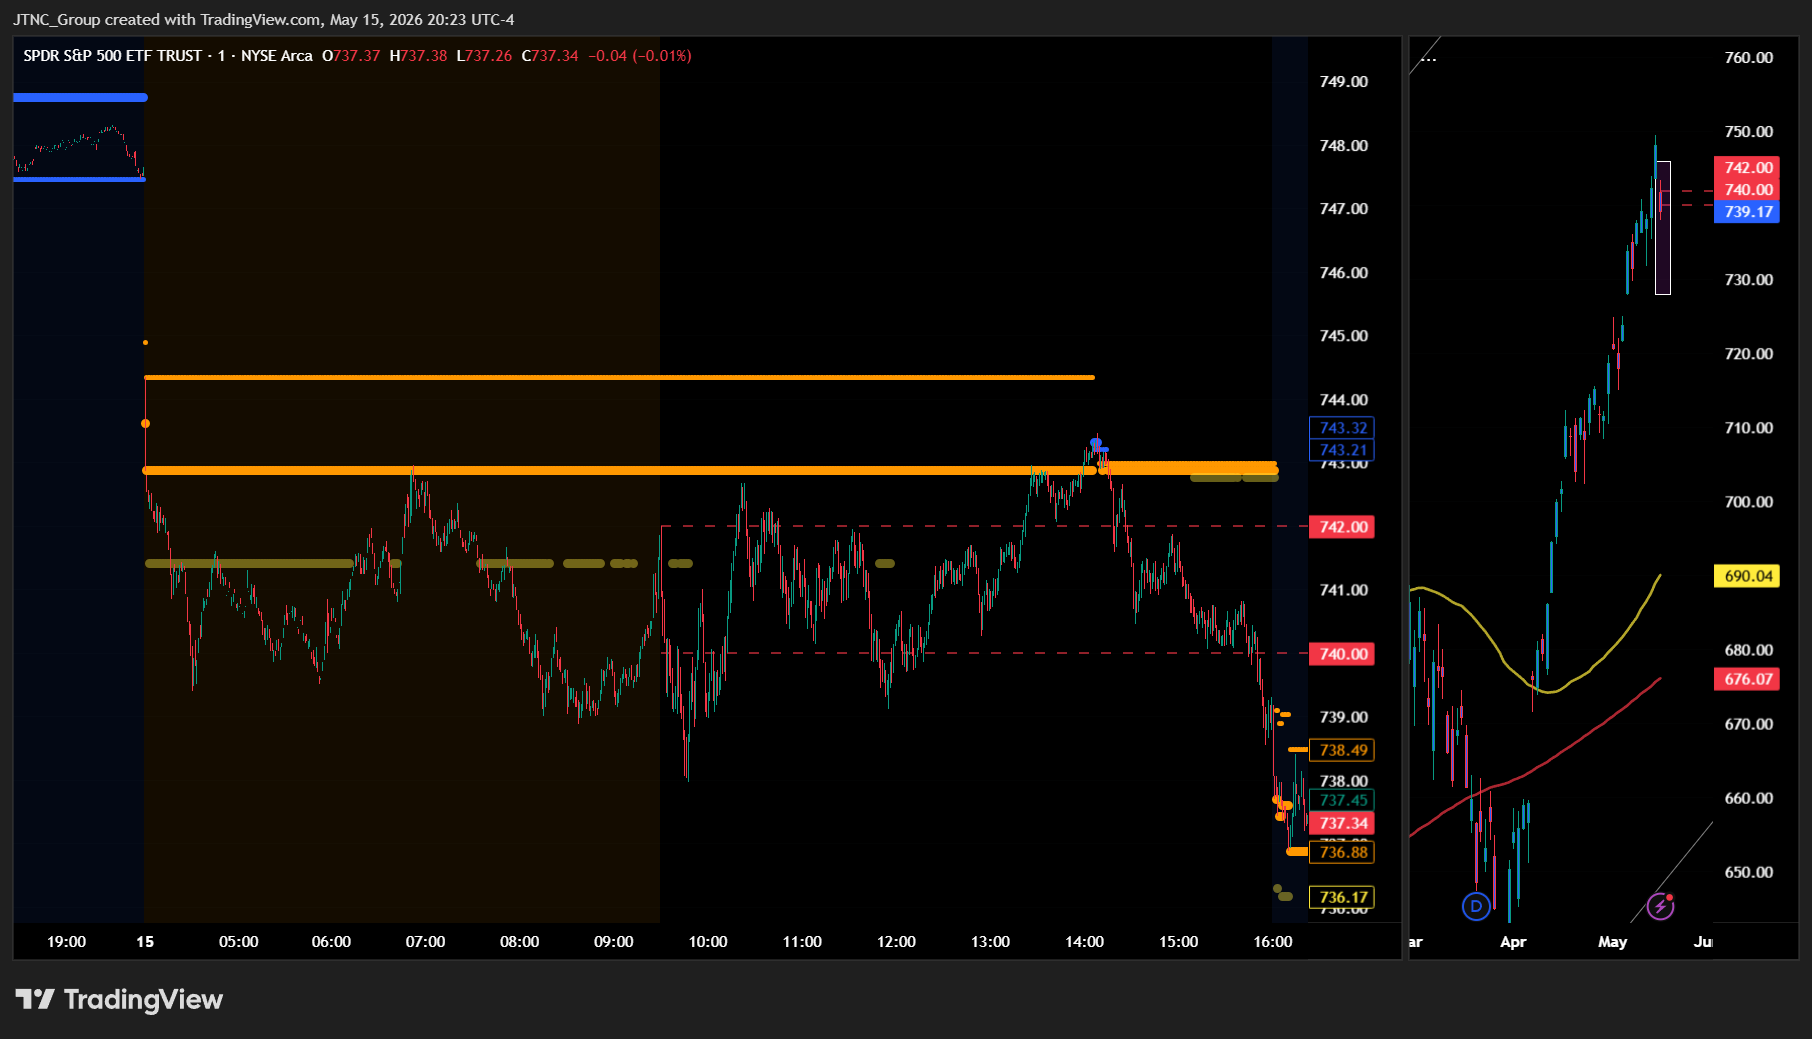
The MSI ended in Bearish Trending Market State with SPY closing at $739.12. Since SPY closed above MSI resistance, resistance at $738.49 now becomes support for the next session with the new resistance level at $736.88. Extended targets were not printing at the close, though they were visible below during the PM session and above in premarket. The MSI rescaled lower overnight opening the day in a wide bearish state with price grinding sideways below $744 through the entire premarket and morning session. A brief pop to $743 in the PM session failed to hold as extended targets below resumed printing and the MSI rescaled sharply lower with price dropping from $743 to close near the lows of the day. The moderate spread of $1.61 indicates controlled bearish momentum rather than panic selling, though the wide bearish configuration earlier in the session demonstrated significant room for downside movement. The MSI is forecasting a slow grind lower for Monday, though without extended targets at the close the downside may be limited and is likely to find support at key levels below. MSI support is $736.88 with resistance at $738.49.
Key Levels and Market Movements:
Friday we stated, "Bulls want to see overnight strength hold current levels and push toward levels above the previous resistance at $748.75," and added, "bears want to see the new support level at $747.47 fail to press price toward lower support levels," while also noting, "Friday is likely to see sideways to possibly higher price action as the narrow width suggests consolidation rather than strong trending momentum." The session delivered the opposite of the expected sideways action as SPY opened at $741.79 and immediately came under selling pressure. The MSI had rescaled lower overnight creating a wide bearish framework, and price respected this bearish structure throughout the session. The previous support at $747.47 failed decisively as anticipated by bears, and price continued grinding lower through the morning session below $744. A brief rally attempt to $743.46 during the PM session provided a shorting opportunity at MSI resistance as the bearish momentum quickly resumed. Price then accelerated lower into the close, dropping from $743 to settle at $739.12 near the session lows. The MSI framework offered clear short setups when price failed the overnight support levels and began printing extended targets below, with the bearish momentum dominating both the AM and PM sessions. At minimum it was a 2-for-2 session for traders following the framework. It was a volatile but readable day with substantial setups, all identified through proper context, patience, and flexibility while leveraging the MSI, premarket levels, and market structure rather than forcing trades. The MSI continues to prove its reliability as the cornerstone of our trading process.
Trading Strategy Based on MSI:
Monday has no high-impact economic releases so the market is likely to grind lower given the Bearish Trending at the close, though the move may be modest. Bulls want to see overnight strength hold current levels and push toward levels above the flipped support at $738.49, while bears want to see the new resistance level at $738.49 hold to press price toward lower support levels. With the MSI closing in Bearish Trending Market State in a moderate configuration, Monday is likely to see continued downward pressure as the bearish state suggests sellers remain in control. However, the moderate spread of $1.61 indicates less conviction than the wide bearish state seen earlier in Friday's session, and without extended targets printing at the close, the downside may be limited. The MSI may rescale with any move toward either boundary requiring respect but a breakdown below $736.88 or rally above $738.49 both remaining possible. Any rally to the flipped support-turned-resistance at $738.49 presents a shorting opportunity targeting lower levels, while any breakdown below MSI support at $736.88 could accelerate selling pressure toward the day's lows around $737. However, if bears can maintain control below $738.49 with conviction, it would signal continuation of the bearish trending state. Bulls need to see overnight buying pressure reclaim and hold above $738.49 with conviction to neutralize the current setup and drive price toward higher levels, while bears need price to respect the flipped resistance level and continue grinding toward support levels below $736.88. Any failure of MSI support is likely to see SPY retest Friday's lows. The moderate bearish configuration suggests controlled selling rather than panic, and Monday's light economic calendar may allow for continuation of the current downtrend or a relief rally from oversold conditions. The long-term bull trend remains intact above $640 and failed breakouts and failed breakdowns continue to offer the highest-probability setups. Remain flexible, avoid trading during Ranging Market States unless a clear failed breakout or breakdown presents itself, and ensure all trades are fully aligned with MSI signals. Providing real-time insights into market control, momentum shifts, and actionable levels, the MSI when integrated with our Pre-Market and Post-Market Reports continues to sharpen execution precision and elevate trade quality. If you haven't yet integrated MSI and our model levels into your process, now is the time. Contact your representative to get started as these tools are designed to support consistency and enhance performance.
Dealer Positioning Analysis
Dealers are selling SPY $741 to $755 and higher strike Calls, indicating the Dealers' limited upside conviction. The ceiling for Monday appears to be $743. To the downside, Dealers are buying $737 to $680 and lower strike Puts in a 4:1 ratio to the Calls they're selling displaying strong concern that prices could move lower. Dealers are no longer selling ATM Puts indicating limited conviction on direction Monday. Below $737 is bearish and above $739 is bullish. Should SPY fail to hold $737 the zone from $731 to $737 will be choppy and full of traps. Dealer positioning is unchanged at bearish.
Looking Ahead to Next Friday:
Dealers are selling SPY $741 to $758 and higher strike Calls, indicating the Dealers' limited upside conviction. The ceiling for next week appears to be $745. To the downside, Dealers are buying $735 to $630 and lower strike Puts in a 5:1 ratio to the Calls they're selling displaying strong concern that prices could move lower. Dealers are no longer selling ATM Puts and positioning remains mixed with no strong directional conviction into May 22. There is a ceiling at $745 with major resistance at $741 to $745. Remain bullish above $735 but below $733 and especially $729 we are bearish. Between $729 and $735 is likely to be choppy and full of traps. Dealers are positioned for any scenario that may develop given the size of their hedges. For the week Dealer positioning is unchanged at bearish. We advise reviewing Dealer positioning daily for directional clues. These positions evolve quickly and tracking them is essential for staying ahead of shifting market sentiment.
Recommendation for Traders
With SPY closing at $739.12 after testing support near $738, traders should watch for a bounce off this level while remaining cautious given the VIX spike to 18.12 and broad market weakness. The 10-year yield at 4.600% sits dangerously close to the 4.8% level that triggers meaningful selling, suggesting defensive positioning may be prudent until yields stabilize.
Keep position sizes conservative given elevated volatility and deteriorating Treasury dynamics that could pressure equities further. Be sure to review the premarket analysis posted before 9 AM ET for any changes in the model's outlook and Dealer Positioning.
Good luck and good trading!
