Market Insights: Thursday, May 15th, 2025
Market Overview
Wall Street closed Thursday with a cautious tone as optimism around easing U.S.-China trade tensions gave way to renewed concerns over the lingering impact of President Trump's remaining tariffs. After opening flat, markets drifted sideways throughout the session, lacking strong conviction as investors digested mixed economic signals and corporate earnings.
The spotlight fell on Walmart, whose earnings revealed plans for “unavoidable” price hikes in response to tariff-related cost pressures. While wholesale inflation data for April came in softer than expected, retail sales showed signs of slowing, creating an uneasy backdrop. Markets have been trying to price in both the fading tailwinds of relaxed tariffs and the growing headwinds from those that remain. Futures tied to the Dow, S&P 500, and Nasdaq each gained 0.1% in the early session but failed to inspire a broader rally.
Looking abroad, Asian markets were mixed as Japan’s economy unexpectedly shrank at an annualized 0.7% in Q1, well below economist forecasts. The Nikkei slipped 0.5%, and Hong Kong’s Hang Seng dropped 0.9%, reflecting continued investor caution ahead of next week’s Chinese economic data. Meanwhile, Australia’s ASX 200 posted a strong 0.8% gain on the back of strength in mining stocks. Heading into Friday, investors will turn their attention to the University of Michigan consumer sentiment survey for insight into how Americans are handling inflation and the ongoing trade situation.
SPY Performance
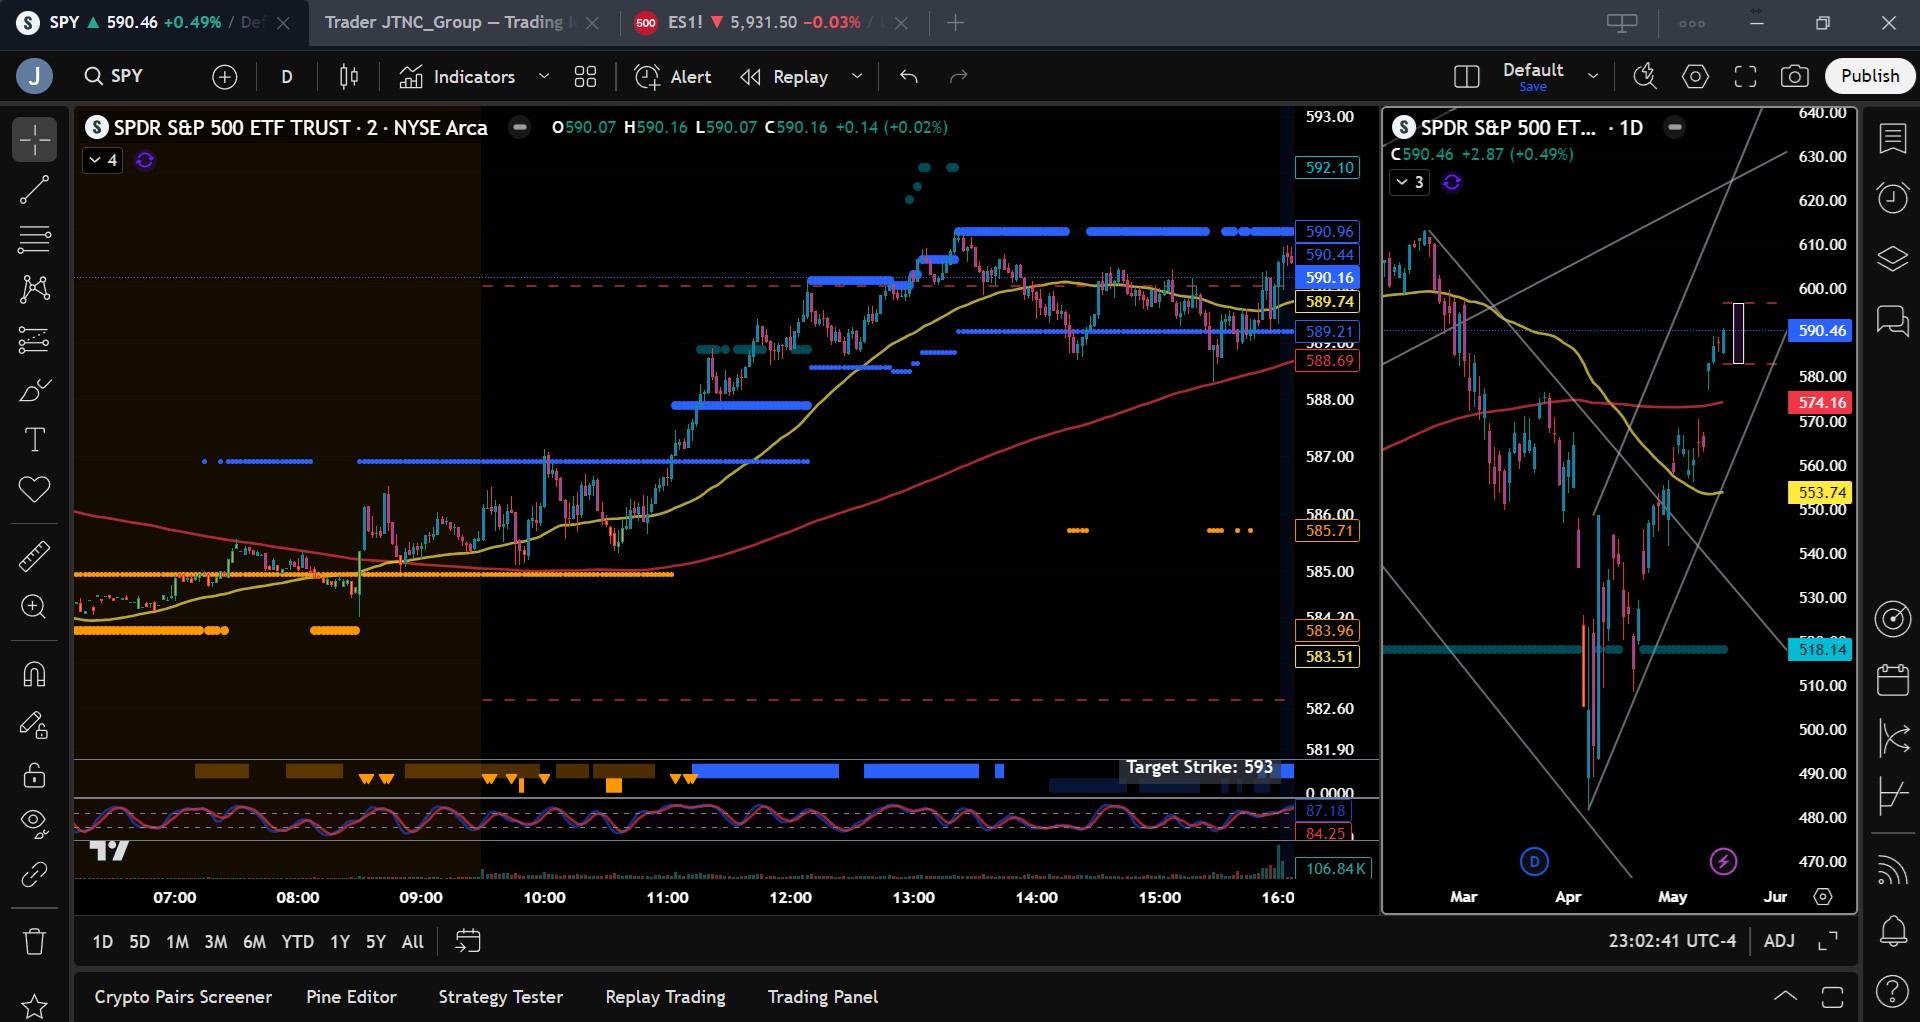
SPY climbed 0.49% to close at $590.46 on Thursday, buoyed by midday strength that pushed the ETF to an intraday high of $590.97. After opening at $585.56 and dipping briefly to a low of $585.10, SPY gained momentum late in the morning before consolidating into the close. Volume reached 71.27 million shares, modestly above average, signaling renewed interest as the index tested key resistance near the $590 mark. With another strong close above $585, the bullish trend remains intact heading into Friday.
Major Indices Performance
The Dow led the major averages with a 0.65% gain, helped by strength in consumer and financial stocks. The Russell 2000 followed closely with a 0.58% advance, showing renewed interest in small-cap names. The S&P 500 added 0.49%, riding a strong session in value and industrial names. The Nasdaq slipped 0.18%, weighed down by weakness in big tech, particularly Amazon and Meta. Despite mixed action, the tone remained broadly constructive as markets digested retail and inflation data and prepared for Friday’s consumer sentiment report.
Notable Stock Movements
It was a weak day overall for the Magnificent Seven, with Amazon falling 2.42% and Meta sliding 2.35%, dragging on broader tech sentiment. Most other names in the group saw modest declines, with the exception of Microsoft and Netflix, which posted slight gains. The defensive tone across mega-cap tech reflects the market’s sensitivity to inflation trends and macro data. While the sector remains dominant, Thursday’s session suggests investors are taking a more cautious approach at current levels.
Commodity and Cryptocurrency Updates
Crude oil dropped 1.91% to $61.68, continuing its downward slide as traders grow more confident in our model’s $60 target. With interest rates trending higher and the dollar likely to bottom, oil could eventually test the $50 zone, where we would look to accumulate. Gold rebounded 1.99% to $3,239.80 after a sharp decline earlier this week, finding support as investors reassessed inflation risks. Bitcoin rose 0.25% to finish just above $103,700, maintaining its tight range. We remain buyers between $83,000 and $77,000, avoiding entries below $77,000 due to increased downside risk.
Treasury Yield Information
The 10-year Treasury yield eased 0.74% to settle at 4.422%, offering some relief to equities after Wednesday’s climb above the critical 4.5% threshold. Yields remain a key driver of market sentiment, particularly as traders watch for signs of sticky inflation or a hawkish shift from the Fed. As long as rates remain below 4.5%, equity valuations may stay supported. A move toward 4.8% or above would rekindle downside risk across asset classes.
Previous Day’s Forecast Analysis
Wednesday’s outlook called for a bullish bias above $585, forecasting a potential move toward $593 with consolidation expected unless SPY broke below key support at $580. The model projected a trading range of $583 to $593, favoring long setups above $585, with short trades only considered below $580. The forecast emphasized the possibility of chop and stressed caution entering new positions ahead of Thursday’s data-heavy session. Long trades were encouraged on dips to support, with stops advised near key resistance levels.
Market Performance vs. Forecast
Thursday’s action tracked the model’s forecast closely, as SPY traded within the expected $583 to $593 range. Opening at $585.56, the ETF dipped to $585.10 before powering to a session high of $590.97, closing at $590.46. The model’s bias level at $585 proved to be an effective pivot, with long setups from support providing multiple opportunities to profit. Resistance at $590 initially capped gains, but the close just above it signals that momentum remains with the bulls. The model’s range, levels, and directional bias once again delivered highly accurate and actionable insights.
Premarket Analysis Summary
In Thursday’s premarket analysis posted at 8:34 AM, SPY was trading at $584.83 with a bias level set at $585.50. The outlook projected potential weakness if the ETF remained below that level, with downside targets at $582.75 and $580. Above the bias, the model called for chop and consolidation with targets at $587, $588.50, $590, and possibly $592. The tone remained cautious, with expectations for limited upside unless momentum broke firmly above $585.50, and early profit-taking was advised on long setups given the likely churn.
Validation of the Analysis
Thursday’s market validated the premarket analysis with remarkable precision. SPY initially struggled to break above the $585.50 bias level but eventually surged past it during the late morning rally. Once above, it chopped around the projected $587 level before tagging the higher resistance targets of $588.50 and $590. The session’s high of $590.97 aligned perfectly with the premarket target zone, confirming the model’s reliability. Traders who followed the analysis had multiple clean long setups with tight stops and solid upside. Once again, the premarket levels served as a reliable roadmap.
Looking Ahead
Friday brings the University of Michigan’s Consumer Sentiment and Inflation Expectations report, offering a final look at consumer mood this week. While recent economic prints have trended softer, sentiment data can still sway market momentum. With no other major events until next Thursday, Friday’s report may be the last notable catalyst before a quieter stretch. Traders should remain alert for any surprises, particularly if inflation expectations surge or sentiment collapses.
Market Sentiment and Key Levels
SPY closed at $590.46, reaffirming bullish sentiment as the ETF continues to march toward its March highs near $597. Bulls remain in control above $585, with upward momentum likely to persist unless this level breaks. Resistance now lies at $593, $595, and $597, while support rests at $587, $585, and $580. A breakout above $593 would likely invite a test of the $597 level, potentially setting the stage for new all-time highs. However, any sustained move below $585 could open the door to a pullback toward $580 or even $575. With volume holding steady and volatility low, the path of least resistance continues to be higher.
Expected Price Action
Our AI model forecasts a trading range of $583 to $595 for Friday, providing actionable intelligence for managing risk and identifying opportunities. The bias remains bullish while SPY trades above $585, favoring long entries on dips and breakout plays above $590. Should SPY push through $593, we could see acceleration toward $597 and possibly $600. If support at $585 fails, a retest of $580 is likely, and a breakdown below $580 would target $575. Momentum remains on the bulls’ side, but traders should watch closely for failed breakouts or signs of exhaustion at higher levels.
Trading Strategy
Traders should favor long setups above $585 with targets at $593 and $597. If SPY surges through $593 with volume, trailing stops may allow for a run toward $600. Short trades can be considered near $593 or higher, but remain lower probability unless SPY decisively breaks below $585. A dip below $580 could invite tactical shorts with downside targets at $575 and $570. With the VIX at 17.83, volatility remains manageable, but a surprise in Friday’s data could change that quickly. Maintain smaller position sizes near major releases and use tight stops when trading near resistance.
Model’s Projected Range
The model’s maximum projected range for Friday is $583 to $596.75, with the Call side dominating in a similar range to today suggesting consolidation with periods of trending behavior. Friday will bring the University of Michigan (UoM) Consumer Sentiment and Inflation data, which could offer some insight into the state of the consumer and may modestly influence market direction. So far this week, economic releases such as CPI and PMI have come in softer than expected, suggesting subdued inflationary pressures. While the UoM report could move the market slightly, there is little on the immediate horizon that appears capable of acting as a strong catalyst heading into tomorrow or next week. Today, SPY began the session in a narrow range, moved slightly higher overnight, and then rallied during the late morning session. This move continued its bullish push toward all-time highs, although it encountered resistance near the $590 level. The afternoon saw tight trading within a $2 range, but another close above $585 confirms that bulls remain firmly in control. As discussed previously, bulls seem to be gearing up to challenge the March highs around $597, and a move above that level could set the stage for a broader rally toward new record highs. Throughout the day, support at $585 held strong, keeping prices elevated. If bulls can maintain that level, upward momentum may continue. However, a break below $585 could lead to a dip toward $580, which may present a buying opportunity if the breakdown proves to be false. If $580 fails as support, it could finally usher in a red day, something the market appears overdue for. The key question is not whether a red day will come, but rather from which level it will materialize. Currently, SPY is trading above the $565–$585 range, a zone where institutional investors have are reducing exposure. Despite this, today’s strong trading volume lends support to the continuation of the bullish trend. Broadly, the path of least resistance still appears to be higher, rather than revisiting the April lows. Heading into Friday, key resistance levels to watch include $593, $595, and $600. On the downside, important support levels are $587, $585, and $580. Above $600, resistance seems limited, although there is a developing supply zone between $590 and $600. Support is solid above $585 but becomes less reliable below $580. Since April 2, market direction has largely been driven by macroeconomic forces such as tariffs, bond yields, and inflation. This trend is expected to persist over the next couple of months, barring a major policy shift from the White House. Meanwhile, the VIX closed at 17.83, comfortably below its pivot level of 23. Volatility above 23 typically weighs on equities, while lower readings tend to support bullish behavior. With SPY closing above $590, the bulls remain in clear control and may attempt to push the market higher on Friday. That said, the index is moving within a steep bullish trend channel that began at the April lows, and the current pace of ascent may not be sustainable. A period of consolidation or a mild pullback would not be surprising. While momentum still favors the bulls, the market remains volatile, and flexibility will be crucial in navigating the days ahead.
Market State Indicator (MSI) Forecast
Current Market State Overview:
The MSI is currently in a narrow Bullish Trending Market State, with SPY closing just below MSI resistance. Extended targets of and on for two hours during the late morning but remained absent for the afternoon and into the close implying a weakening bull trend. The MSI rescaled higher several times after 11 am and with extended targets above, the herd pushed the market to the day’s highs. But by 1 pm the MSI settled into its current range and stopped printing extended targets which saw price move sideways for the rest of the day. Current MSI support is $589.21 and resistance is at $590.96.
Key Levels and Market Movements:
On Wednesday, we noted: “Thursday brings several economic reports that could influence the market.” We also stated: “A move back to $585…seems increasingly probable,” and, “As long as $585 holds, price is likely to rebound toward $590.” With this actionable insight in hand, SPY opened just above $585, at MSI support in a ranging state. While we typically avoid trading in this state, our model suggested $585 would hold. Accordingly, we entered long at the open on a double bottom at this level, targeting MSI resistance at $587. By 10:00 AM, we had reached our first target and set our sights on a second, premarket resistance level at $588.50. The MSI began rescaling higher, supported by a favorable PPI report that pointed to lower interest rates. We hit our second target before noon and moved our stop to breakeven. As the MSI continued to rescale with price, extended targets printed above. Although we considered reloading our long, we decided to hold our runner for the next key level: MSI resistance at $590, another premarket level. Rather than pushing for more, we opted to lock in profits and close the long, noting a potential failed breakout at that level. We chose not to short the failed breakout since the MSI continued to print extended targets given we never fight the MSI. That restraint paid off, as price continued to climb and the MSI rescaled higher, reaching the day’s highs. By 1:20 PM, the MSI stopped printing extended targets. With another failed breakout on tap, we took a shot at a scalp short from MSI resistance down to MSI support at $589.21. Given the strong trend and profits already booked, we limited our risk by moving the stop to breakeven. Our second target was again the premarket level at $588.50, which was reached at 3:25 PM. At that point, we exited the remaining 30% of the position as price began forming a failed breakdown long setup. Two for two again today, thanks to disciplined execution, a clear plan, and the precision of both our model and the MSI. The MSI continues to prove its value by identifying who holds control, when that control shifts, and where actionable levels lie. It enables sharp entries and timely exits. When combined with a structured trading framework, the MSI helps align with dominant market forces, avoid traps, and secure profits with confidence. We continue to strongly recommend integrating the MSI into your trading process. With a clear plan, it becomes a powerful engine for long-term consistency and performance.
Trading Strategy Based on MSI:
Friday brings no major economic reports likely to move the market, aside from a possible surprise from the University of Michigan Consumer Sentiment release. The market appears to be searching for a reason to pull back and consolidate the impressive gains off the April lows, and this report could serve as that catalyst. Until then, however, the trend remains higher and we continue to defer to that strength. The MSI rescaled higher multiple times today, printing extended targets that confirm persistent and powerful bullish momentum. Volume supported the move, reinforcing that buyers remain firmly in control and are pressing toward the April highs near $597. While a pullback toward $585 or even $580 seems increasingly probable, the broader uptrend remains intact. We continue to favor long setups over shorts, though we are becoming more open to tactical two-way trades, especially from key edges. Our model suggests SPY may test $588 and potentially break lower toward $585, where we expect buyers to step in. If $585 holds, we anticipate a rebound toward $590, with a possible breakout attempt toward $593. A sustained move above $595 would suggest accelerating momentum, but given the overhead resistance, we view that as unlikely on Friday without an external catalyst. Momentum still favors the bulls, but it may be time to consider tactical short setups from the $590–$593 zone. With $600 within striking distance, there remains a high probability the market touches that level before undergoing a more significant correction. We recommend focusing on failed breakdowns near key support zones at $588 and $585, while also being alert for failed breakouts around $590 to $593. The MSI is currently in a narrow bullish state, suggesting the trend is weakening and that choppy, two-way action is increasingly likely again, assuming no meaningful surprises from economic data. Until we see a confirmed red day, we continue to lean long and remain cautious on the short side. Stay aligned with the MSI and the prevailing bullish narrative. Avoid trading when the MSI enters a Ranging State, and as always, remain disciplined and responsive to what the market offers. The MSI continues to provide real-time insight into momentum and structural dynamics. When paired with the Premarket and Postmarket Reports, it helps identify high-probability targets and clean entry points keeping traders aligned with the tape and away from costly missteps. If you're not yet integrating the MSI and model levels into your trading process, now is the time. Contact your representative to get started as these tools can significantly enhance your performance.
Dealer Positioning Analysis
Summary of Current Dealer Positioning:
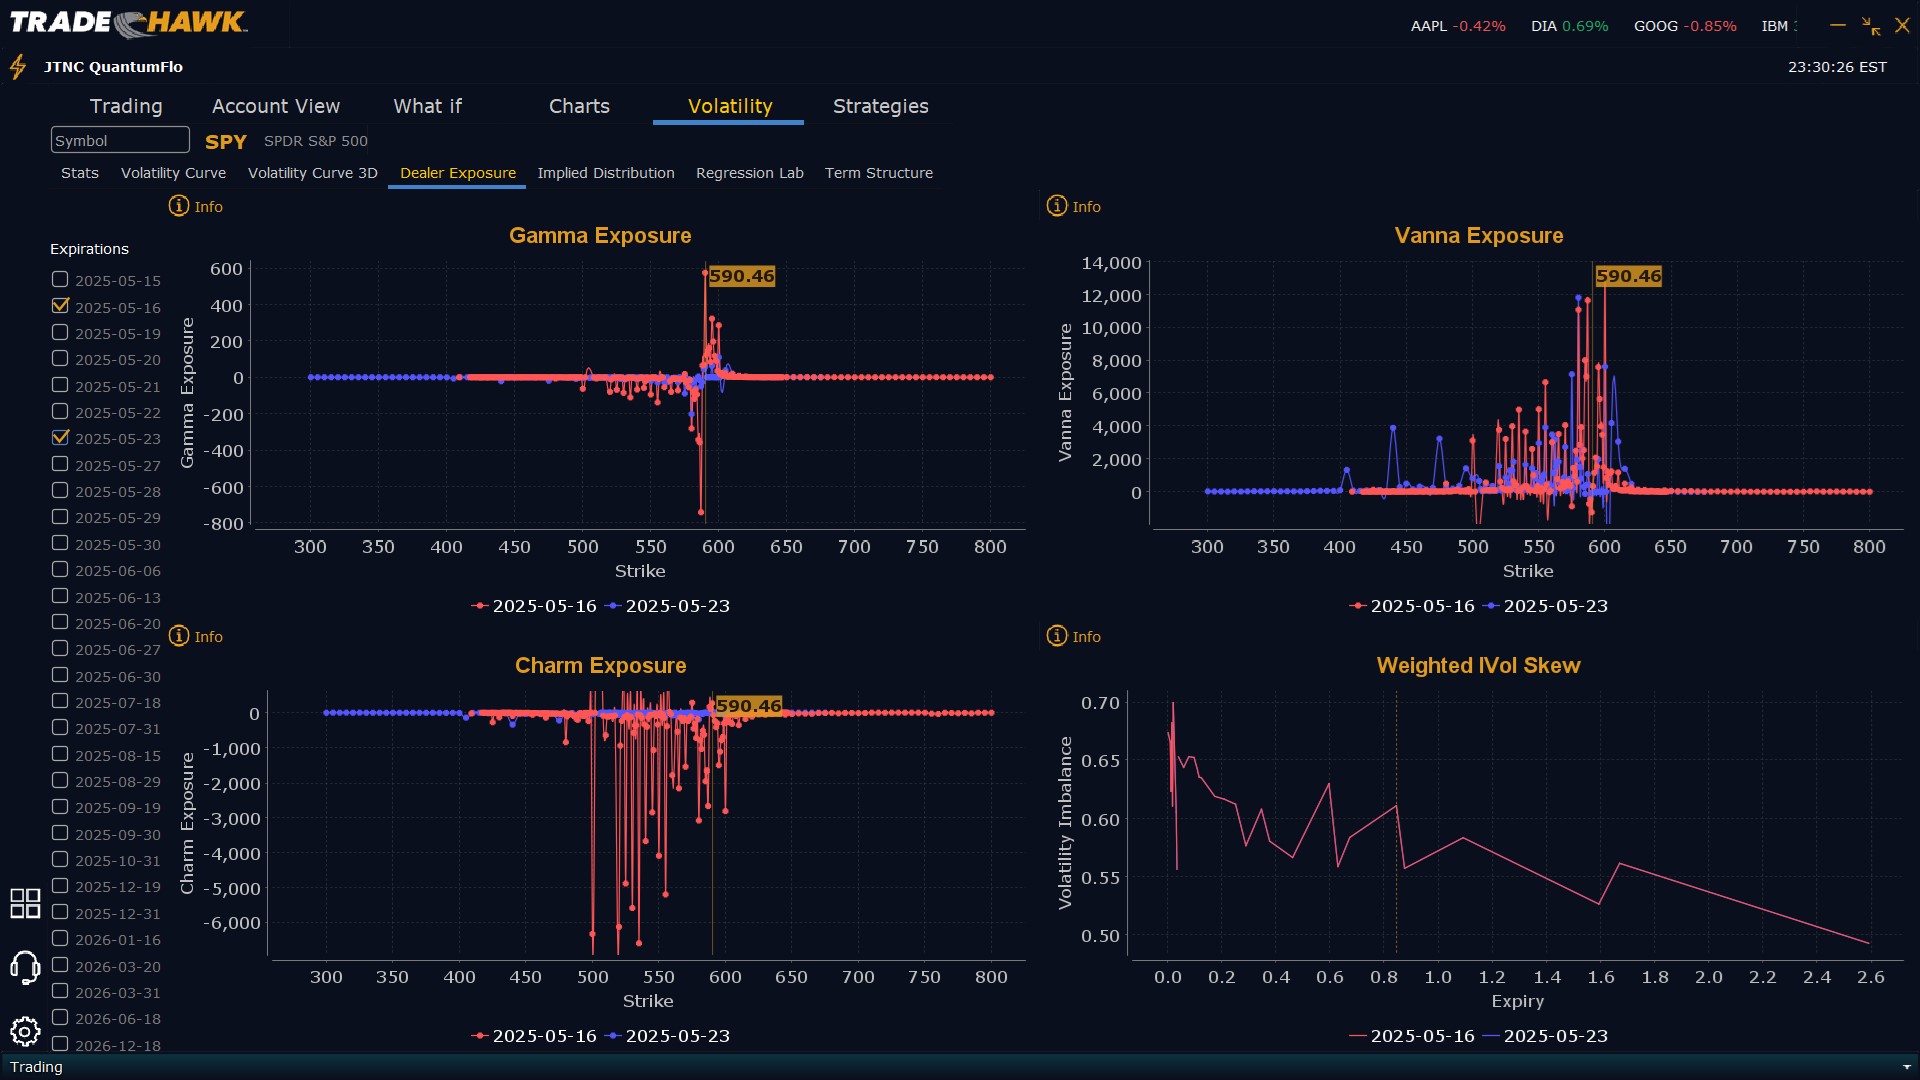
Dealers are selling $591 to $610 and higher strike Calls while selling $589 to $590 Puts indicating the Dealers belief that prices may continue to rally on Friday. Dealers appear to project a ceiling for Friday at $595. To the downside Dealers are buying $588 to $500 and lower strike Puts in a 3:1 ratio to the Calls/Puts they are selling, implying a slightly bearish posture for Friday. Dealer positioning has changed from neutral to slightly bearish.
Looking Ahead to Next Friday:
Dealers are selling $591 to $610 and higher strike Calls. Dealers are no longer selling near the money Puts. Dealers appear to believe the peak for SPY next week is $600 and the market is likely slowing and will perhaps enter a consolidation phase. To the downside, Dealers are buying $589 to $440 and lower strike Puts in a 3:1 ratio to the Calls/Puts they’re selling, reflecting a slightly bearish outlook for next week. Dealer positioning is unchanged from slightly bearish to slightly bearish. We advise reviewing Dealer positioning daily for directional clues. These positions evolve quickly and tracking them is essential for staying ahead of shifting market sentiment.
Recommendation for Traders
With SPY closing above $590 and bulls maintaining control, traders should continue to favor long setups above $585. Key upside targets include $593 and $597, and if price surges through $597, $600 comes into play. However, if SPY drops below $585, expect a move toward $580, which may present a long opportunity on a failed breakdown. Short trades may develop near $593 or above but remain lower probability unless confirmed by weakness and a break back below $585. Volatility remains low with the VIX at 17.83, but traders should remain cautious ahead of Friday's consumer sentiment data. Position size should remain conservative into major data prints. Review the premarket analysis posted before 9 AM ET to adjust your plan accordingly.
Good luck and good trading!
