Market Insights: Wednesday, May 14th, 2025
Market Overview
Tech continued to steal the show Wednesday as the Nasdaq notched its sixth straight day of gains, led by another explosive move in Nvidia. Stocks mostly drifted higher throughout the session, with the Nasdaq climbing 0.7%, the S&P 500 edging up 0.1%, and the Dow slipping 0.2% amid ongoing uncertainty around tariffs. Nvidia and AMD surged more than 4%, while Alphabet added over 3% and Super Micro Computer jumped more than 15%. The AI chipmaker sector saw renewed strength on expectations of loosened restrictions on chip exports and new AI-related deals driven by Saudi Arabia, reinforcing bullish sentiment in the "Magnificent Seven" trade.
Foxconn, Nvidia's key server partner, helped spark further gains after it posted a massive 91% jump in quarterly profit, citing strong AI demand. However, it also trimmed its full-year outlook due to tariff concerns, a theme echoed globally. Sony warned of a $700 million hit from US tariffs and delivered a soft forecast, while American Eagle became the latest firm to withdraw guidance, citing macroeconomic headwinds. The tariff narrative remains central to market sentiment, even as traders increasingly bet that easing inflation and solid earnings from tech giants could continue powering equities higher into summer.
SPY Performance
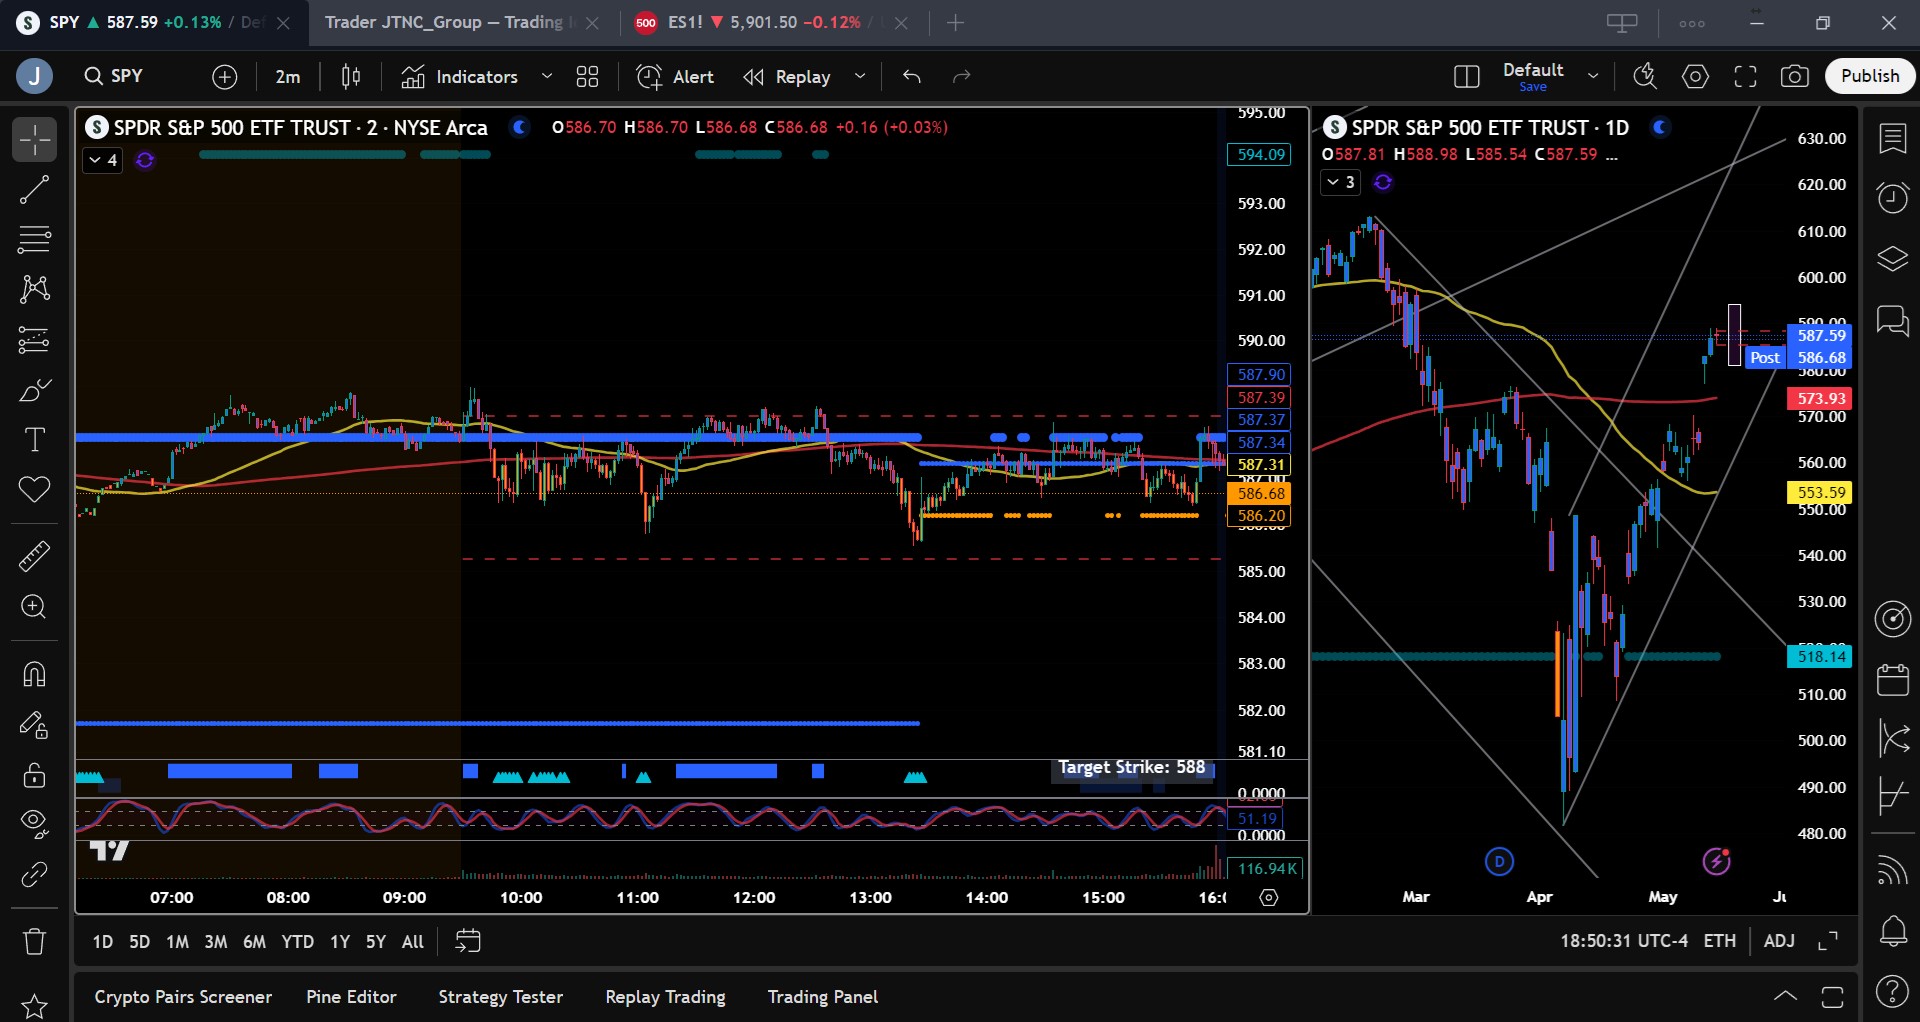
SPY added 0.12% to close at $587.57 on Wednesday in a quieter session that lacked any major economic catalysts. The ETF opened at $587.81, reached a high of $588.98, and briefly dipped to a low of $585.54 before settling into a tight trading range for most of the afternoon. Volume slowed to just 57.96 million shares, reflecting reduced participation as traders await Thursday's key PPI report. SPY continues to hold well above the $585 level, reinforcing the current bullish bias.
Major Indices Performance
The Nasdaq once again led the charge with a 0.72% gain, stretching its winning streak to six days as Nvidia and other AI names kept tech in the driver’s seat. The S&P 500 finished up 0.1%, staying near its 2025 highs, while the Dow lagged with a 0.21% decline, weighed down by weakness in industrials. The Russell 2000 posted the weakest performance with a 0.92% drop, suggesting risk appetite remains concentrated in large-cap growth. Overall, markets remained in a holding pattern ahead of Thursday’s data, but the leadership from tech and the resilience in SPY kept the bullish tone intact.
Notable Stock Movements
Nvidia was the standout performer among the Magnificent Seven, gaining over 3.67% as enthusiasm for AI pushed shares to erase their 2025 losses. Tesla and Alphabet also climbed more than 3.67%, while Meta and Microsoft posted modest gains. Amazon and Apple were the day’s only underperformers, slipping slightly. The continued rotation into AI and chip stocks underscores market confidence in innovation-driven growth, even as macro risks like tariffs linger in the background.
Commodity and Cryptocurrency Updates
Crude oil fell 1.17% to $62.87, extending its recent decline as our forecasted target of $60 comes into focus. With interest rates drifting higher and the dollar finding support, we expect oil to potentially drop as low as $50, where we would become aggressive buyers. Gold also weakened, dropping 2.24% to $3,176 amid a continued unwind in safe haven assets. Bitcoin closed just above $103,500, down 0.78%. We remain buyers in the $83,000 to $77,000 zone, taking profits above $85,000, and caution against buying below $77,000 due to increased downside risk.
Treasury Yield Information
The 10-year Treasury yield rose 0.93% to close at 4.541%, breaching the key 4.5% level. This move adds pressure to equities, as rising yields can drag on valuations and risk sentiment. A continued rise toward 4.8% could spark broader equity weakness, while a reversal back below 4.5% would offer relief. For now, yields represent a growing headwind and will be closely watched as Thursday’s economic data rolls out.
Previous Day’s Forecast Analysis
Tuesday’s forecast anticipated a consolidation-style session after two strong days of gains, with a trading range of $580 to $592 and a bullish bias as long as SPY held above $580. The model identified $585 and $590 as key resistance levels, with support expected at $580. It warned that while upside momentum was intact, a pullback was possible if $580 broke. Long trades were favored above $580, with potential to reach $593 or $595 if $590 was breached. Traders were advised to trail stops near resistance and stay cautious given the proximity of Thursday’s macro data.
Market Performance vs. Forecast
SPY traded almost perfectly within the projected range on Wednesday. Opening at $587.81, it reached a high of $588.98 and a low of $585.54 before closing at $587.57, respecting both the upper and lower bounds of the $580 to $592 range. Resistance at $590 capped the session, and support at $585 held firm. The consolidation scenario played out as forecasted, offering solid setups for traders who bought dips near $585 or entered longs above $586. Volume remained light, signaling a lack of speculative drive ahead of Thursday’s releases. The model’s projected levels and directional bias proved once again to be reliable and actionable.
Premarket Analysis Summary
In Wednesday’s premarket analysis posted at 8:10 AM, SPY was trading at $588.01 with a bias level identified at $587. The analysis forecast a potential stall in momentum and called for consolidation, projecting upside targets at $588.35, $590, and $593.25, with downside levels at $587, $585.25, and $581.25. The tone emphasized limited upside follow-through and anticipated a sideways grind unless key levels were breached. Traders were advised to stay cautious on short setups and focus on long entries near support if the bias level held.
Validation of the Analysis
Wednesday’s market action tracked closely with the premarket analysis. SPY hovered around the $587 level for most of the session, testing but failing to break above the $588.35 resistance. The low of the day came in at $585.54, right above the premarket support zone and the ETF never lost key bias or support levels. The anticipated stalling behavior was accurate, as the session played out in a narrow range with limited directional conviction. Long trades near $585 held up well, and traders who followed the premarket plan had multiple opportunities to profit within a stable, low-volatility environment.
Looking Ahead
Thursday brings a packed schedule with the Producer Price Index, Retail Sales, and Weekly Jobless Claims all set for release in the morning. Fed Chair Powell is scheduled to speak after the close, and Walmart’s earnings before the open will shed light on consumer spending trends. These events carry potential to drive significant price action, particularly if inflation surprises to the upside or if Powell adopts a more hawkish tone. Traders should prepare for increased volatility and keep a close eye on model levels as the market digests this wave of data.
Market Sentiment and Key Levels
SPY closed at $587.57, firmly above the key $585 level, signaling continued bullish sentiment. The market remains in a strong uptrend and appears poised to challenge resistance at $590, followed by $593 and the March highs near $597. Support remains at $585, with deeper levels at $583 and $580. If SPY pushes above $590, we expect renewed momentum toward $595. However, a break below $580 could trigger a deeper pullback toward $575. With macroeconomic events on deck, traders should brace for potential swings and monitor these levels closely for signs of trend continuation or reversal.
Expected Price Action
Our AI model projects a trading range of $583 to $593 for Thursday, offering actionable intelligence for navigating a potentially volatile session. The bias remains bullish as long as SPY holds above $585. A breakout above $590 opens the door to $593 and potentially $597, especially if Thursday’s economic data supports a dovish Fed outlook. If SPY breaks below $585, we could see a test of $580, and a failure there would target $575. With the day packed with key catalysts, traders should expect strong directional moves and look for failed breakouts or breakdowns around the major levels to initiate high-probability trades.
Trading Strategy
Traders should continue favoring long setups above $585, targeting $590 and $593. If SPY breaks through $590 with volume, consider trailing stops and aiming for the March highs near $597. Short trades may be considered if SPY fails to hold $580, with downside targets at $575 and $570, but keep in mind that short setups remain lower probability in this environment. The VIX ticked up to 18.62, still below the key 23 pivot, indicating manageable volatility but this could change quickly post-data. Stay nimble, size down during erratic swings, and focus on executing around key levels with disciplined stops.
Model’s Projected Range
The model’s maximum projected range for Thursday is $581 to $594.25, with the Call side dominating in a slightly narrowing range suggesting consolidation with periods of trending behavior. Thursday brings a slate of key economic data, including PPI, Retail Sales, and Unemployment Claims each of which has the potential to move the market. SPY traded in a very narrow range between $586.20 and $587.20 for most of the session. The market rallied in the premarket to test the prior day's highs, where it met resistance and entered a tight range for the remainder of the day. With a close above $585, the bulls remain firmly in control. This strong close positions the bulls to challenge the March highs near $597. A move to this level could pave the way for a broader push toward new all-time highs. The $585 support level held throughout the day, keeping prices elevated. If the bulls stay committed, they will aim to maintain levels above $585. Should that support break, the price could dip to $580, which may present a buying opportunity on a failed breakdown. If $580 holds, a push to $590 and possibly higher remains in play. However, a decisive break below $580 could trigger a pullback, marking a red day, something the market appears due for. The key question is not if a red day is coming, but from what level it will begin. SPY currently trades just above the $565–$585 range, a zone where institutional traders often reduce exposure. The price could either drift back into this range or continue its climb. As it stands, the odds favor higher prices over a retest of the April lows. Key resistance levels to watch on Thursday include $590, $592, $595, and $597. Support levels to monitor are $586, $583, and $578. Resistance above $600 is limited, although there is a notable supply zone building between $590 and $600. Meanwhile, support remains firm above $586 but weakens below $580. Since April 2, macroeconomic forces such as tariffs, bond yields, and inflation have been the primary drivers of market direction—a trend expected to continue over the next 60 days unless a significant policy shift emerges from the White House. The VIX closed at 18.62, well below its pivot level of 23. Volatility above 23 typically pressures equities, while lower levels tend to support bullish behavior. With SPY closing above $587, the bulls are in full control and will likely aim to break through $590 on Thursday. SPY remains in a steep bullish trend channel that began at the April lows. However, the sharp angle of ascent may be unsustainable, potentially leading to a period of consolidation or a mild pullback. While momentum currently favors the bulls, this remains a volatile market. Flexibility and readiness to adapt are essential.
Market State Indicator (MSI) Forecast
Current Market State Overview:
The MSI is currently in a very narrow Bullish Trending Market State, with SPY closing just above MSI support. Extended targets printed for a small portion of the late morning. There were no extended targets printing in the close which implies a weakening bull trend. The MSI rescaled from a very wide bullish state to a very narrow ranging state and bullish state, flip flopping between the two states into the close. Again this implies a weakening bull trend with some confusion from market participants. Current MSI support is $587.30 and resistance is at $587.93.
Key Levels and Market Movements:
On Tuesday we noted, “the market is more likely to drift higher than surge.” We also stated, “SPY may attempt a move toward $593,” and emphasized, “Focus on failed breakdowns at key support zones, specifically $585”. With this actionable plan in place, SPY opened with a textbook failed breakout at the premarket resistance level of $588.35. However, with extended targets above, we remained patient and waited for a cleaner setup. We observed the entire morning session without initiating a trade. In the afternoon, a triple top began to form. As extended targets stopped printing, we entered a short position at 12:38 PM at MSI resistance, aiming for a first target at the premarket support level of $585.25. Price moved in our favor and fell to a session low of $588.54 but never reached our target. At 1:24 PM, SPY setup a failed breakdown. We believed there was little chance of further downside, so we exited the short and reversed to a long position, targeting MSI resistance at $587.90. MSI had shifted to a ranging state, which is not a preferred condition, so we adjusted our first target to $587 and aimed to scalp a one-dollar gain from our long entry. We reached our first target at 1:50 PM and took off 70 percent of the position. Given the day’s narrow range and the continued ranging state of MSI, we moved our stop to breakeven. As MSI shifted into a very narrow bullish state and trend strength diminished, we chose to close the remaining position at $587.90. We exited at 2:35 PM and wrapped up the session with two successful trades. They were small but added meaningful gains, made possible by disciplined execution, a clear plan, and the precision of our model and the MSI. The MSI continues to demonstrate its value by showing who holds control, when control shifts, and where actionable levels exist. This supports sharp entries and timely exits. When used alongside a structured trading framework, it helps align with dominant market forces, avoid traps, and take profits with confidence. We continue to strongly recommend incorporating the MSI into your trading approach. Combined with a clear plan, it becomes a powerful engine for consistent long-term performance.
Trading Strategy Based on MSI:
Thursday brings several economic reports that could influence the market. As new information emerges, focus on trading what you see. SPY continues to press higher, but with a weakening MSI and a very narrow range, a pullback appears likely without an external catalyst. A move back to $585, and potentially $580, seems increasingly probable. The market needs time to consolidate and digest recent gains before continuing higher. This process could begin tomorrow or on Friday. The broader trend remains strong, so we continue to favor long trades over short. However, we are becoming more open to two-way trading opportunities from the edges. Our model suggests that SPY may test $585 and possibly break lower toward $580, where we anticipate buyers will step in. PPI has the potential to move the market by ten points or more, so remain flexible and ready for various scenarios. As long as $585 holds, price is likely to rebound toward $590 and possibly attempt a breakout toward $593. A move above $595 would indicate accelerating momentum, but with significant resistance building above, we view this as an unlikely outcome for Thursday unless driven by external catalysts. Momentum still favors the bulls, but it may be time to consider tactical short setups from $590 and above. With $600 within reach, there is a high probability the market touches that level before making a more substantial move lower. We recommend focusing on failed breakdowns near key support zones at $585 and $580, while also watching for failed breakouts in the $590 to $593 area. The MSI is currently in a very narrow bullish state, reflecting a weakening trend. This suggests increased potential for choppy, two-way action on Thursday, again assuming no significant surprises from the economic data. Until we see a confirmed red day, we continue to favor long setups and advise caution on the short side. Stay aligned with the MSI and the bullish narrative currently in control. Avoid trading when the MSI enters a Ranging State, and as always, remain disciplined and responsive to what the market presents. The MSI continues to deliver critical real-time insight into momentum and structural dynamics. When used alongside the Premarket and Postmarket Reports, it can help identify high-probability targets and clean entry points. This combination keeps traders aligned with the tape and away from costly missteps. If you are not yet using the MSI and model levels in your trading process, now is the time. Contact your representative to get started, as these tools can make a meaningful impact on your performance.
Dealer Positioning Analysis
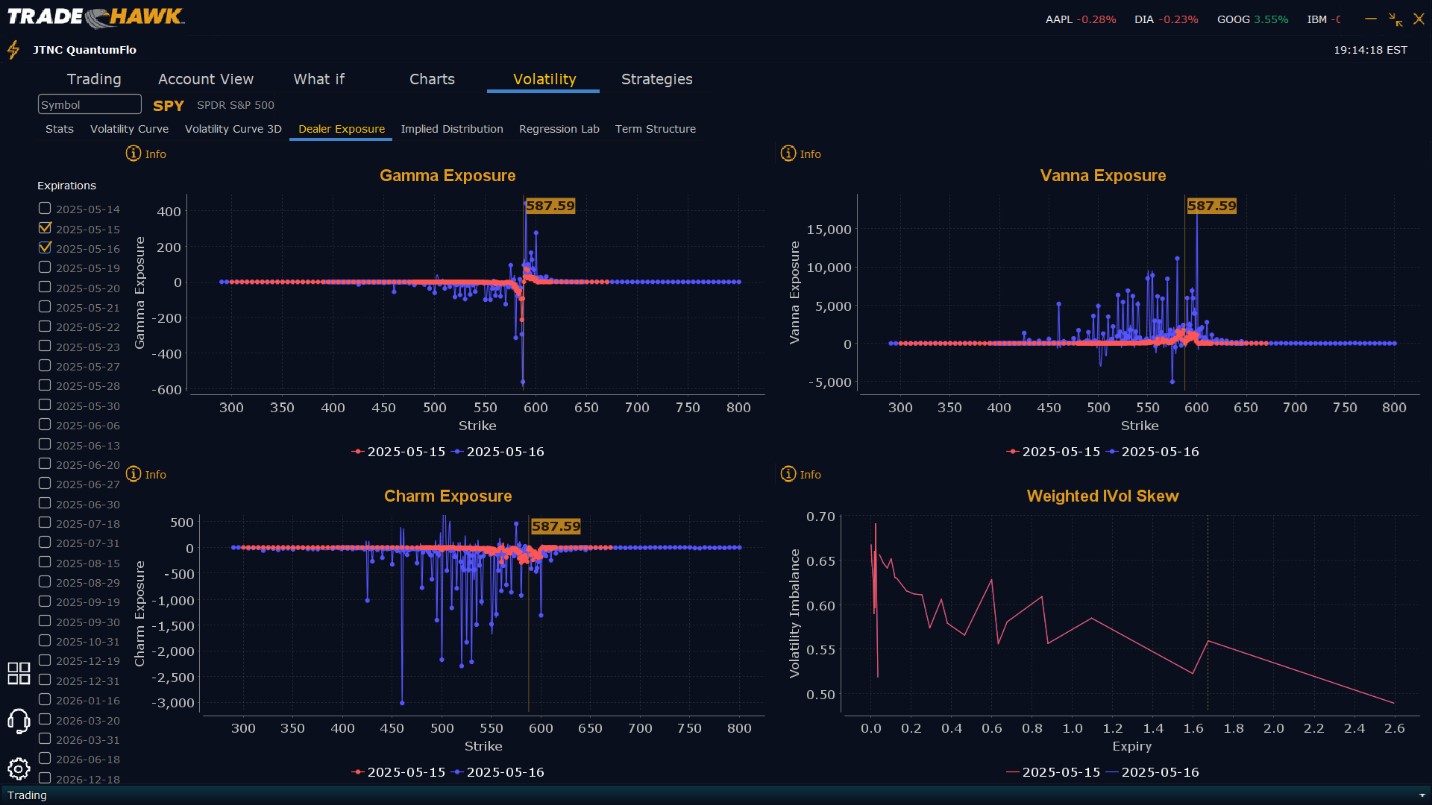
Summary of Current Dealer Positioning:
Dealers are selling $588 to $610 and higher strike Calls. They are no longer selling Puts. This implies the Dealers belief that prices may not move materially higher on Thursday. Dealers appear to project a ceiling for Thursday of $592. To the downside Dealers are buying $587 to $500 and lower strike Puts in a 2:1 ratio to the Calls they are selling, implying a neutral posture for Thursday. Dealer positioning has changed from bullish to neutral.
Looking Ahead to Friday:
Dealers are selling $588 to $610 and higher strike Calls while also selling $575 to $587 Puts indicating the Dealer’s belief that the market is likely to continue to rally into the end of the week. Dealers do not sell near the money Puts without confidence that prices will move higher. Dealers also appear to believe the peak for SPY for this week is $600. To the downside, Dealers are buying $574 to $460 and lower strike Puts in a 3:1 ratio to the Calls/Puts they’re selling, reflecting a slightly bearish outlook for the rest of the week. Dealer positioning has changed from neutral to slightly bearish. We advise reviewing Dealer positioning daily for directional clues. These positions evolve quickly and tracking them is essential for staying ahead of shifting market sentiment.
Recommendation for Traders
With SPY holding above $585 and bulls still in control, traders should continue to favor long setups above $580. If the market pushes through $590, look for acceleration toward $593 and potentially $597. Should SPY dip below $580, watch for failed breakdown setups and potential bounces off $575. Short trades are also possible above $590 but remain a lower probability and should be approached with caution. The VIX at 18.62 suggests manageable volatility, but this could change quickly with Thursday’s economic releases. Manage position sizes carefully, use tight stops near resistance, and be prepared for potential intraday reversals. Always review the premarket analysis before 9 AM ET to account for any overnight changes to model levels or Dealer Positioning.
Good luck and good trading!
