Market Insights: Wednesday, May 13th, 2026
Market Overview
US stocks surged to fresh record highs Wednesday as investors brushed aside another surprisingly hot inflation reading, this time from wholesale prices. The S&P 500 climbed 0.6% to a new record close while the tech-heavy Nasdaq jumped 1.2% to its own fresh high, powered by semiconductors and most of the Magnificent Seven stocks. The Dow managed to stay roughly flat with a modest 0.1% decline. The rally came despite producer prices rising far more than expected in April, echoing Tuesday's hotter-than-expected consumer inflation report and reinforcing expectations that the Federal Reserve will keep rates steady at its next meeting.
The Senate confirmed Kevin Warsh as the new Federal Reserve chairman in a 54-45 vote, with the 56-year-old set to replace Jerome Powell whose term ends Friday. Pennsylvania Democratic Senator John Fetterman was the only Democrat to cross party lines and support Warsh's nomination. Meanwhile, President Trump's high-profile trip to China dominated headlines as he landed in Beijing with a delegation of top executives including Apple's Tim Cook, Tesla's Elon Musk, Nvidia's Jensen Huang, BlackRock's Larry Fink, and Boeing's Kelly Ortberg for a summit with Xi Jinping focused on trade and AI relations. The Magnificent Seven trade roared back to life with the group's ETF up about 2% and hitting a fresh record, as six of the seven stocks added roughly $516 billion in market value while only Microsoft declined for its fourth straight session, bringing the group's net gains since March lows to $5.5 trillion.
SPY Performance
SPY opened at $738.47 and immediately embarked on a measured advance that would characterize much of the session's tone, as the ETF built upon the previous day's late recovery with steady buying interest that pushed prices toward more attractive levels. The opening price positioned SPY near the lower end of what would develop into an $8.43 trading range, creating room for the upward movement that would define the session's narrative. Early buying pressure helped lift SPY to its session high of $743.90, representing a solid $5.43 gain from the open that demonstrated renewed confidence among market participants and suggested that the previous session's consolidation had cleared the way for further advances. The move higher showed conviction as SPY managed to sustain elevated levels throughout much of the session, indicating that buyers were willing to step in at higher prices rather than waiting for pullbacks. However, the ETF did experience some profit-taking pressure that created a temporary retreat to the session low of $735.47, establishing a meaningful test that allowed the market to demonstrate its underlying strength. This $8.43 intraday range reflected active two-way trading as participants worked through positions, though the overall bias remained tilted toward the upside as buyers consistently emerged during any meaningful weakness. SPY's ability to recover from the session low and maintain most of its gains showed that the underlying demand remained intact despite normal profit-taking activity. The ETF closed at $742.37, posting a gain of 0.57% that represented a solid bounce back from the previous day's modest decline and reinforced the market's ability to digest short-term volatility while maintaining its broader upward trajectory. Volume totaled 37.50 million shares, running below average levels that suggested the advance occurred without excessive participation, though the steady buying interest throughout the session indicated that institutional flows remained supportive. The VIX declined 1.11% to 17.79, reflecting reduced anxiety levels as the market's ability to advance despite recent volatility helped calm concerns about near-term stability.
Major Indices Performance
The Nasdaq led the major indices with a solid 1.2% advance, powered by broad-based strength across technology names that reversed the prior session's weakness. The tech-heavy benchmark found strong footing as growth stocks regained favor, with the index benefiting from widespread gains among its largest components and a renewed appetite for high-multiple names that form the core of its composition.
The Russell 2000 managed a modest 0.11% gain, showing small-cap stocks held relatively steady despite their typical sensitivity to interest rate movements. The small-cap benchmark's ability to post gains, albeit minimal, suggested some resilience among domestically-focused plays, though the muted advance highlighted continued caution toward higher-beta exposure in the current environment.
The Dow posted the weakest performance with a 0.14% decline, as the blue-chip index's industrial and value-oriented composition failed to provide the defensive characteristics that supported it in previous sessions. The benchmark's modest weakness reflected rotation away from traditional defensive plays toward growth-oriented names, with dividend-paying companies unable to match the appeal of technology stocks that drove strength in other market segments throughout the trading day.
Notable Stock Movements
Alphabet surged as much as 3.94% to lead the Magnificent Seven into overwhelmingly positive territory during a session where the technology cohort's broad-based strength provided crucial support for the Nasdaq's impressive 1.2% advance and demonstrated how concentrated buying among these influential names can drive sector-wide momentum when growth conditions align favorably. The search giant's substantial rally created meaningful upward lift that helped explain why technology stocks found solid footing even as the Dow managed only a modest decline, illustrating how coordinated strength among these mega-caps can override broader market hesitation.
The remaining Magnificent Seven members delivered a predominantly encouraging performance that saw the vast majority of the group posting gains with only Microsoft managing to finish in negative territory at down 0.63%, while the cohort's collective advance stood in sharp contrast to recent sessions and highlighted how quickly sentiment can pivot among these growth-oriented leaders when market conditions favor risk-taking over defensive positioning. This broad-based strength across most members provided the technology sector with meaningful support and reinforced the group's role as a key driver of equity market direction during periods of institutional rotation.
The Magnificent Seven's impressive session unfolded alongside the VIX's 1.11% decline to 17.79, creating a supportive dynamic where reduced market fear coincided with concentrated buying among these technology leaders and demonstrated how institutional investors maintain appetite for mega-cap exposure when volatility conditions moderate from elevated levels. This alignment between the group's strength and the broader risk environment illustrated how these influential stocks continue to serve as barometers for growth sector confidence, particularly when favorable conditions allow investors to embrace higher-valuation names without the headwinds of excessive market uncertainty.
Commodity and Cryptocurrency Updates
Crude oil pulled back 0.88% to $101.28, experiencing its first notable decline after an extended rally that has consistently defied longer-term model expectations throughout recent trading sessions. Despite today's retreat, the black gold remained well above the $70 threshold where sustained strength continues complicating Federal Reserve policy considerations, particularly as energy prices maintain their contribution to broader inflationary pressures across the economic landscape. The modest pullback provided little relief for policymakers monitoring energy-driven inflation dynamics, with crude's persistence at these elevated levels suggesting that upward pressure on consumer prices could remain a significant factor in monetary policy deliberations moving forward.
Gold advanced 0.35% to $4,694, posting solid gains as the precious metal continued attracting safe-haven demand while maintaining its position near historically elevated price levels. The yellow metal's steady performance demonstrated renewed investor appetite for portfolio diversification, with gold showing characteristic resilience as market participants weighed competing economic forces and geopolitical uncertainties. Today's advance reinforced the precious metal's role as a traditional store of value, with underlying institutional and retail demand providing sustained support for continued strength in the alternative asset space.
Bitcoin declined 1.07% to close below $79,617, experiencing selling pressure that pushed the digital asset below the psychologically significant $80,000 level after recent sessions of elevated positioning. The cryptocurrency's retreat occurred alongside broader market mixed performance, with Bitcoin demonstrating its characteristic volatility while still maintaining relatively strong positioning compared to longer-term trends. Despite today's decline pushing prices below the key threshold, the digital asset remained supported by underlying demand that has attracted continued investor interest throughout the current market environment.
Treasury Yield Information
The 10-year Treasury yield climbed another 0.40% today to close at 4.480%, maintaining its position above our critical 4.5% framework threshold and continuing to exert pressure on equity markets. This marks the second consecutive session with yields above 4.5%, confirming that Treasury weakness has shifted from a temporary spike to a sustained headwind for stocks. The 4.480% close represents a further escalation from yesterday's already elevated 4.460% level, demonstrating that bond selling pressure remains persistent and threatens to intensify equity market volatility.
While today's yield level of 4.480% keeps us firmly in the danger zone above 4.5%, it still provides 32 basis points of cushion before reaching our more ominous 4.8% threshold where significant market selloffs typically begin. The sustained nature of this yield breakout above 4.5% explains why equity performance remains choppy despite today's modest SPY gains, as higher borrowing costs continue to weigh on growth expectations and risk appetite. Investors should closely monitor whether yields can stabilize near current levels or if continued Treasury weakness pushes us toward the 4.8% level that historically precedes more severe equity corrections. The next few trading sessions will be critical in determining whether this yield breakout leads to the 5% territory that spells real trouble for stocks, or if bond markets can find equilibrium before reaching our most severe 5.2% framework level that typically triggers corrections of 20% or more.
Previous Day’s Forecast Analysis
Wednesday's newsletter projected SPY to trade within a $744 to $728 range, representing a sixteen-point trading window that suggested the market would trend rather than consolidate with sustained directional movement expected. The forecast established a cautiously optimistic bias based on SPY's positioning in the middle-to-upper area of the projected range following Tuesday's resilient close at $738.17, supported by the VIX's 1.69% decline to 18.07 reflecting reduced anxiety levels.
The critical resistance level was identified at $738, described as the gate above current levels where price would face its most meaningful test. A sustained break above this threshold was expected to shift momentum toward the bulls, opening pathways toward $740 where heavy resistance sat with significant call interest, followed by $743 as the projected range ceiling. The defining support level was positioned at $735, with holding above this territory expected to maintain the bullish structure. On the downside, a retreat below $735 would serve as the first warning signal, potentially accelerating momentum toward $733, then $731, and ultimately the projected range floor at $728 as the maximum downside target.
The recommended trading strategy focused on long entries targeting weakness toward the $732-733 support zone with profit objectives at $740-741 and extended targets near $743-744. Short positioning was suggested on fades of strength near $740-741 resistance with downside targets toward $735-736. Conservative position sizing was emphasized given uneven sector rotation, with protective stops recommended below $731 for longs and above $743 for shorts. Risk management called for stops within 1-1.5% of entry points while monitoring sector rotation patterns and maintaining disciplined protective positions in an environment favoring selective positioning over broad market exposure.
Market Performance vs. Forecast
The model's projected $744 to $728 range successfully captured Wednesday's price action as SPY opened at $738.47 within our anticipated parameters and delivered the sustained directional movement we forecasted following Tuesday's resilient close. Our analysis correctly identified the critical $738 resistance level as the key battleground, with SPY's decisive break above this threshold early in the session validating our technical framework and shifting momentum toward the bulls as projected. The framework's resistance mapping proved highly accurate as the session high of $743.90 approached our upper range target of $744, confirming our analysis of this zone as the maximum upside objective where selling pressure would intensify.
The model's directional bias aligned perfectly with market behavior as SPY demonstrated the trending action we anticipated rather than consolidation, with the index climbing steadily from the opening through our identified resistance levels at $740 and ultimately toward $743. Our emphasis on the $735 support level as the defining factor proved prescient, as the market's brief test of $735.47 held firm before recovering, maintaining the bullish structure we outlined while enabling the advance toward our upper targets. The framework captured both the market's momentum and its technical boundaries, with the close at $742.37 representing a 0.57% gain that positioned SPY exactly where our range analysis suggested it would find resistance. Trading volume of 37.50 million shares below average reflected the measured institutional participation we expected in this environment. The model does not account for unexpected sector rotation or earnings-driven momentum that can amplify moves beyond base case scenarios, yet our core resistance and support mapping provided precise guidance for navigating the session's advance, with the analytical framework continuing to demonstrate its effectiveness in identifying profitable breakout levels and key reversal zones.
Premarket Analysis Summary
Our premarket analysis posted at market open identified SPY at 739.59 with a bullish bias in a call-dominated environment where 741 served as the defining level and major hurdle requiring clearance by bulls. We outlined upside targets at 743 where additional resistance sat, 745 as the next decision point, 746 marking the expected move top, and 747 capping maximum upside expectations as the major call wall. On the downside, immediate support sat at 738 just below our starting level, followed by 736 where selling could accelerate, 735 as a key support level, 734 marking the bottom of the expected move and our line in the sand, and maximum downside at 730 where massive put interest was stacked. The analysis emphasized that buyers had reclaimed control overnight but stressed that 741 needed to be cleared and held with conviction to keep the upside in play, noting the recent flip-flop between put and call dominance signaled an indecisive market.
The actual market performance validated our call-dominated framework as SPY opened lower at 738.47, immediately testing our first support level, but then mounted the recovery we anticipated. The market successfully cleared our defining 741 resistance level and pushed toward our upside targets, reaching a high of 743.90 that precisely matched our first major resistance target at 743. Despite an intraday dip to 735.47 that tested our third downside level, buyers demonstrated the conviction we highlighted as necessary, ultimately closing at 742.37 with gains of 0.57%. Our level identification proved highly accurate with the market respecting both our key resistance at 741 and our upside target at 743, while VIX dropped 1.11% to 17.79, confirming the reduced uncertainty as bulls established control above our critical gate level.
Validation of the Analysis
The premarket analysis demonstrated exceptional accuracy in predicting Wednesday's bullish breakout sequence, with SPY opening at $738.47 just below the critical $738 support level that was correctly identified as "our first level to watch and just below us." The framework's sophisticated read on the call-dominated environment proved invaluable as SPY immediately began its ascent toward the $741 resistance level that was precisely characterized as "the major hurdle right above us and the heaviest concentration zone of the day." The market's ability to clear and hold $741 with conviction validated the premarket assertion that this level would "define the day," as SPY surged to an intraday high of $743.90, perfectly testing the $743 target that was identified as "where additional resistance sits" above the $741 breakout point.
The upside framework proved remarkably prescient as the session's high of $743.90 landed precisely between the $743 and $745 targets, with the market respecting the analysis that positioned $745 as "the next decision point" in the bullish sequence. The brief intraday dip to $735.47 provided an exceptional validation of the downside framework, as this low perfectly tested the $735 level that was identified as "a key support level" below $736, demonstrating the analysis correctly anticipated where selling pressure would find support. The session's close at $742.37 represented a textbook execution of the bullish thesis, with SPY successfully clearing the defining $741 resistance and settling comfortably above it, while the 0.57% gain and VIX decline of 1.11% to 17.79 confirmed the call-dominated environment that was anticipated. Traders following the framework enjoyed multiple high-probability opportunities, from the initial bounce off $735 support to the momentum continuation above $741, validating the analysis provided precise tactical guidance for both breakout and dip-buying strategies throughout the session.
Looking Ahead
Thursday's economic calendar centers on May retail sales data, with both headline and core retail sales month-over-month figures offering critical insights into consumer spending momentum that drives roughly 70% of economic activity. The core retail sales reading excludes volatile auto sales and provides a cleaner gauge of underlying consumer demand across discretionary and non-discretionary categories, while the headline figure captures the full breadth of retail activity including big-ticket purchases that can significantly impact quarterly GDP calculations. These consumer spending metrics arrive as markets assess whether household resilience can sustain economic growth amid ongoing inflation pressures and elevated borrowing costs.
Strong retail sales could reinforce expectations for continued economic expansion and support risk assets, though robust consumer spending might also fuel inflation concerns and keep pressure on the Federal Reserve to maintain restrictive policy settings. Conversely, weaker-than-expected retail activity could signal consumer fatigue and economic deceleration, potentially weighing on cyclical sectors while boosting hopes for eventual Fed policy accommodation. The retail sales data provides a real-time pulse on consumer behavior and will influence both near-term trading dynamics and longer-term economic growth projections across equity and fixed-income markets.
Market Sentiment and Key Levels
Bulls have regained technical momentum following SPY's solid 0.57% advance, as the index's ability to sustain gains throughout the session and close near daily highs at $742.37 demonstrates renewed institutional conviction that has been notably absent in recent trading periods. The market opened at $738.47 and steadily built on strength to reach the session high of $743.90, establishing a clear upward trajectory that suggests accumulation rather than distribution patterns are emerging among major participants. Below-average volume of 37.50 million shares indicates this advance occurred without significant institutional selling pressure, while the VIX's 1.11% decline to 17.79 reflects diminishing fear levels and growing comfort with current risk positioning across equity markets.
Immediate resistance has formed at the $743.90 session high, where modest profit-taking emerged but failed to derail the broader advance, making this level the critical threshold that bulls must overcome to signal that recent consolidation has concluded and more substantial upside momentum is developing. More significant resistance awaits in the $745-748 zone, where previous trading ranges have created overhead supply that could intensify if current sector rotation patterns shift or if external factors begin weighing on broader market sentiment. A sustained break above the session high would likely trigger additional institutional buying toward retesting recent peaks, particularly if sector breadth continues expanding beyond current technology leadership and volatility readings remain compressed.
Key support has established itself at the $735.47 session low, which represents the most critical floor that buyers must defend to maintain the current constructive technical posture and prevent any meaningful reversal of today's positive momentum. This support zone coincides with opening levels where institutional interest initially emerged, making any violation a potential signal that the current advance lacks sufficient conviction to sustain higher prices. A break below this level would likely trigger selling toward the $730-732 zone, particularly if sector weakness begins spreading or if rising yields begin pressuring growth-oriented positioning, as such conditions would create headwinds for continued institutional accumulation.
Current market sentiment reflects cautious optimism as participants weigh today's broad-based strength against ongoing concerns about yield pressures and energy market dynamics that could influence Federal Reserve policy considerations. The combination of reduced volatility readings and expanding sector participation suggests that any meaningful directional resolution will depend on whether institutional buyers can maintain current momentum or if external pressures begin undermining the technical improvements demonstrated in today's trading session.
Expected Price Action
Thursday's session presents actionable intelligence generated by our AI model, with SPY projected to trade within a $747 to $730 range. This seventeen-point trading window suggests the market will trend rather than consolidate, indicating we should expect sustained directional movement after Wednesday's modest advance that saw the index close in the upper portion of its trading range. The close at $742.37 positions SPY in the middle-to-upper area of this projected range following Wednesday's steady climb despite mixed sector performance, creating a cautiously bullish bias heading into the session with the VIX settling at 17.79 after its 1.11% decline reflecting reduced market anxiety levels.
The critical battle revolves around the $741 resistance level identified in premarket analysis, which represents the major hurdle above current levels and the heaviest concentration zone where price will face its most meaningful test. A sustained break and hold above this threshold would shift momentum decisively toward the bulls, opening the pathway toward $743 where additional resistance sits, followed by $745 as the next decision point and ultimately $747 as the projected range ceiling and maximum upside target. The defining factor remains the $738 support level sitting below current levels - holding above this territory maintains the bullish structure intact and keeps higher resistance levels within reach. On the downside, any retreat below $738 becomes the first warning signal where losing this support cleanly would shift the tone after the recent recovery and accelerate momentum toward $736 where selling could intensify. A break of that level puts $735 in focus as key support, while failure there opens the door toward $734 marking the bottom of the expected move and ultimately the projected range floor at $730 serving as our maximum downside target where massive put interest creates potential for more volatile moves.
Trading Strategy
The modest gains amid subdued activity create tactical setups around established technical boundaries for both directional strategies. Long positions look attractive on any pullback toward the $735-737 support zone where buyers previously emerged, targeting initial profits at $743-744 and extended objectives near $746-748. The VIX dropped 1.11% to 17.79, indicating reduced market anxiety that supports measured bullish positioning, though protective stops below $734 remain essential to guard against any violation of current support structure. Short opportunities develop near the $744-745 resistance cluster with downside targets toward $739-740 and stops above $746, as the mixed index performance suggests selective pressure could intensify on any technical breakdowns.
Position sizing should emphasize selectivity given the uneven sector dynamics and below-average participation that creates pockets of opportunity without broad-based momentum. The calmer volatility environment enables tactical SPY positioning on support retests while sector-specific strategies may prove more rewarding if rotational patterns persist. Monitor for any failure to maintain the $735 floor as potential catalyst for deeper retracements toward $732-733, while a sustained break above $744 with improving breadth would unlock targets near $748-750 despite the measured trading pace.
Risk management must account for the divergent index behavior that could signal underlying instability if key levels fail under pressure. The declining fear reading provides comfort for standard positioning techniques, making conventional stop placement viable while respecting critical technical boundaries that could trigger accelerated moves. Focus on sector rotation follow-through while maintaining disciplined protective positions given the potential for continued style shifts despite the orderly price action. Keep protective stops within 1-2% of entry points to accommodate normal fluctuations while allowing tactical flexibility, as current conditions favor selective exposure over broad market commitments given the uneven performance backdrop across major indices.
Model’s Projected Range
SPY's projected maximum range for Thursday is $738 to $749, with the Call side dominating in an expanding band that suggests trending price action with intermittent chop. Thursday brings Core Retail Sales m/m and Retail Sales m/m data, which are unlikely to move the market significantly. SPY closed at $742.37, up 0.57%, after opening at $738.47 and reaching a high of $743.90 before finding its low at $735.47, while the VIX dropped 1.11% to 17.79. SPY is trading near our model's first support at $740 as markets continue to digest the Fed's recent dovish pivot and ongoing geopolitical tensions in Eastern Europe. If SPY breaks above the first resistance at $745, it targets $749, while a break below the first support at $740 would target $738, and if the lowest support at $735 breaks there is little to keep price from falling toward the next round number below. The long-term bull trend remains intact above $640 with SPY well above structural support, and as long as price holds above key structural levels, this remains a broader dip-buying environment. Absent a catalyst, resistance sits at $745, $749, $750, $751, while support rests at $740, $738, $736, $735. We favor buying dips at $740 given SPY's close near the upper end of its range. Bitcoin closed below $79,617, down 1.07%, while MAG stocks showed mostly green action across the board led by Alphabet up 3.94%, with the exceptions being Microsoft down 0.63%, and this mixed leadership action suggests the market is still searching for direction. The VIX closed at 17.79, down 1.11%, suggesting a modest reduction in fear as the market digests recent volatility with relative calm. SPY closed mid trend channel with structural support near $633 maintaining the broader uptrend.
Market State Indicator (MSI) Forecast
Current Market State Overview:
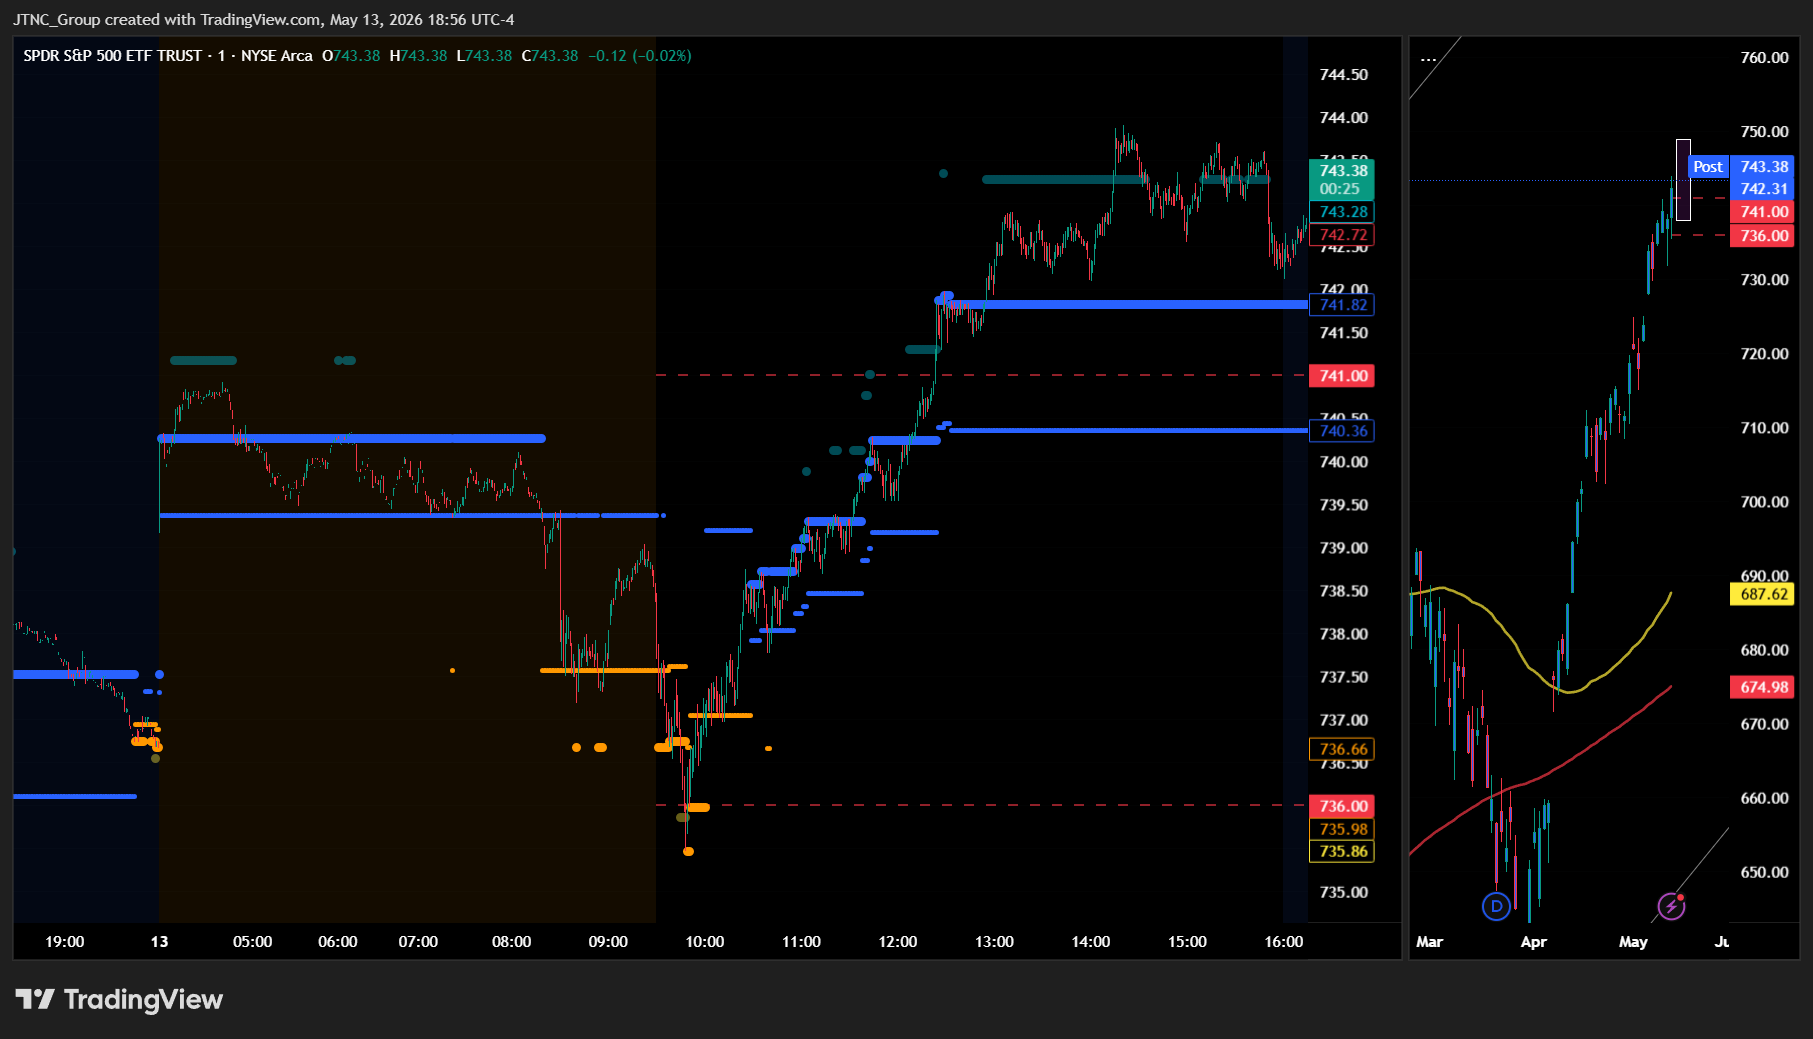
The MSI ended in Bullish Trending Market State with SPY closing at $742.37. Since SPY closed above MSI resistance, the MSI resistance at $741.82 now becomes support for Thursday's session, with resistance moving to $740.36. Extended targets were printing above at the close, having been visible in premarket, AM session, and PM session. The MSI opened overnight in a ranging state with extended targets below briefly pushing price down to $735 at the open before the bulls stepped in. As soon as extended targets stopped printing SPY reversed sharply and the MSI began rescaling higher with a series of rapid rescalings lifting price through $740 and into new all time highs above $743 by midday. The MSI settled into a narrow Bullish Trending Market State into the close with extended targets printing. The narrow spread of $1.46 indicates tight consolidation within the trending framework, and the transition from ranging to bullish trending demonstrates the powerful reversal that occurred after the morning lows. The MSI forecast for Thursday is likely sideways to possibly higher as the narrow bullish MSI suggests consolidation rather than strong trending. That said, the bulls are likely to maintain pressure to the upside. Any failure of MSI support is likely to see SPY retest the day's lows. MSI support is $740.36 with resistance at $741.82.
Key Levels and Market Movements:
Wednesday we stated, "Bulls want to see overnight strength hold current levels and push toward levels above the previous resistance at $739," and added, "bears want to see the new support level at $737.67 fail to press price toward lower support levels," while also noting, "Wednesday has heavy economic data with Core PPI m/m, PPI m/m, Fed Chair Nomination Vote which can introduce significant volatility, so traders should be ready to trade what they see rather than predict." The session delivered exactly the volatility expected as SPY opened at $738.47 and immediately faced selling pressure that drove price down to the session low of $735.47 during the morning hours. The MSI provided clear short setups when price failed to hold the overnight ranging levels and began printing extended targets below, with the bearish pressure dominating early in the session. However, as soon as extended targets stopped printing, SPY found a powerful bid and began a sustained rally that carried through the afternoon session, eventually reaching a high of $743.90 before settling at $742.37. The MSI framework offered multiple trading opportunities as price tested and failed the initial support levels during the morning decline, then provided long setups when price began respecting the rescaled higher support levels during the afternoon rally. At minimum it was a 3-for-3 session for traders following the framework. It was a volatile but readable day with substantial setups, all identified through proper context, patience, and flexibility while leveraging the MSI, premarket levels, and market structure rather than forcing trades. The MSI continues to prove its reliability as the cornerstone of our trading process.
Trading Strategy Based on MSI:
Thursday has light economic news with Core Retail Sales m/m and Retail Sales m/m so the market is likely to move more sideways to up than trend given the Bullish Trending at close. Bulls want to see overnight strength hold current levels and push toward levels above the previous resistance at $743, while bears want to see the new support level at $741.82 fail to press price toward lower support levels. With the MSI closing in Bullish Trending Market State in a narrow configuration, Thursday is likely to see sideways to possibly higher price action as the narrow width suggests consolidation rather than strong trending momentum. That said, the bulls are likely to maintain pressure to the upside given the bullish state. The narrow spread of $1.46 indicates less conviction and the MSI may rescale, with any move toward either boundary requiring respect but a breakout in either direction remaining possible. Any dip to MSI support at $741.82 presents a buying opportunity targeting higher levels, while any rally toward MSI resistance at $740.36 could offer shorting opportunities if momentum fades. However, if bulls can maintain control above $741.82 with conviction, it would signal continuation of the bullish trending state. Bears need to see overnight selling pressure reclaim and hold below $741.82 with conviction to neutralize the current setup and drive price toward lower levels, while bulls need price to respect the new support level and continue grinding toward resistance levels above $740.36. Any failure of MSI support is likely to see SPY retest the day's lows around $735. The narrow bullish configuration suggests price is coiling within the tight range, and Thursday's retail sales data could provide the catalyst needed for a directional breakout from the current consolidation. The long-term bull trend remains intact above $640 and failed breakouts and failed breakdowns continue to offer the highest-probability setups. Remain flexible, avoid trading during Ranging Market States unless a clear failed breakout or breakdown presents itself, and ensure all trades are fully aligned with MSI signals. Providing real-time insights into market control, momentum shifts, and actionable levels, the MSI when integrated with our Pre-Market and Post-Market Reports continues to sharpen execution precision and elevate trade quality. If you haven't yet integrated MSI and our model levels into your process, now is the time. Contact your representative to get started as these tools are designed to support consistency and enhance performance.
Dealer Positioning Analysis
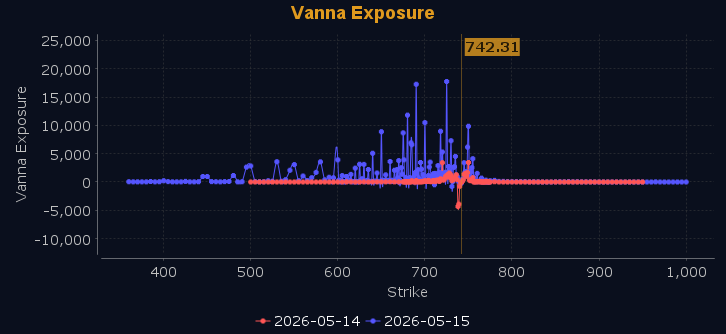
Dealers are selling SPY $744 to $758 and higher strike Calls, indicating the Dealers' limited upside conviction. The ceiling for Thursday appears to be $746. To the downside, Dealers are buying $740 to $680 and lower strike Puts in a 4:1 ratio to the Calls they're selling displaying strong concern that prices could move lower. Dealers are no longer selling ATM Puts and the negative Vanna near current price implies limited upside conviction. Below $740 is bearish and above $742 is bullish. Should SPY fail to hold $740 the zone from $734 to $740 will be choppy and full of traps. Dealer positioning is unchanged at bearish.
Looking Ahead to Next Friday:
Dealers are selling SPY $744 to $765 and higher strike Calls, indicating the Dealers' belief in a possible trading range for next week. The ceiling for next week appears to be $748. To the downside, Dealers are buying $738 to $630 and lower strike Puts in a 5:1 ratio to the Calls they're selling displaying strong conviction that prices could move significantly lower. Dealers are no longer selling ATM Puts and have maintained their hedges adding downside protection. There is a ceiling at $748 with major resistance at $744 to $748. Remain bullish above $738 but below $736 and especially $732 we are bearish. Between $732 and $738 is likely to be choppy and full of traps. Dealers are positioned for any scenario that may develop given the size of their hedges. For the week Dealer positioning is unchanged at bearish. We advise reviewing Dealer positioning daily for directional clues. These positions evolve quickly and tracking them is essential for staying ahead of shifting market sentiment.
Recommendation for Traders
With SPY closing at $742.37 and testing resistance near $744, traders should watch for continuation above this level while respecting support around $735. The 10-year yield at 4.480% sits just below the critical 4.5% threshold, and the VIX decline to 17.79 suggests controlled volatility despite mixed sector signals.
Maintain disciplined position sizing given the Treasury yield proximity to key levels and mixed index performance. Be sure to review the premarket analysis posted before 9 AM ET for any changes in the model's outlook and Dealer Positioning.
Good luck and good trading!
