Market Insights: Tuesday, May 12th, 2026
Market Overview
US stocks trimmed losses Tuesday as markets digested a hotter-than-expected inflation reading that raised fresh questions about Federal Reserve policy direction. The Nasdaq Composite led declines with a 0.7% drop while the S&P 500 shed 0.1% after both indexes hit record highs Monday, though the Dow Jones Industrial Average managed a slight 0.1% gain thanks to its lower tech weighting. April's Consumer Price Index showed annual headline inflation accelerating to 3.8%, topping estimates and marking the largest increase since May 2023, as the ongoing Strait of Hormuz blockade continued pressuring global energy markets with West Texas Intermediate crude jumping over 3% to above $102 per barrel.
The inflation surprise halted the recent semiconductor rally and sparked debate over whether the Federal Reserve might need to delay or abandon rate cuts this year, especially following Friday's stronger-than-expected jobs report. Meanwhile, President Trump began his high-profile China trip to meet with President Xi Jinping, bringing along 16 top executives including Tesla's Elon Musk and Apple's Tim Cook to discuss trade and AI priorities, while tensions with Iran remained elevated with Trump describing the ceasefire agreement as being on "massive life support." Despite current market concerns, LPL Financial's analysis showed the Nasdaq 100's 140% gain since ChatGPT's launch remains far below the dot-com bubble's peak 1,090% return, with today's tech leaders boasting stronger fundamentals, more reasonable valuations at 25x forward earnings versus 58x in 2000, and self-funded growth rather than speculative capital raising.
SPY Performance
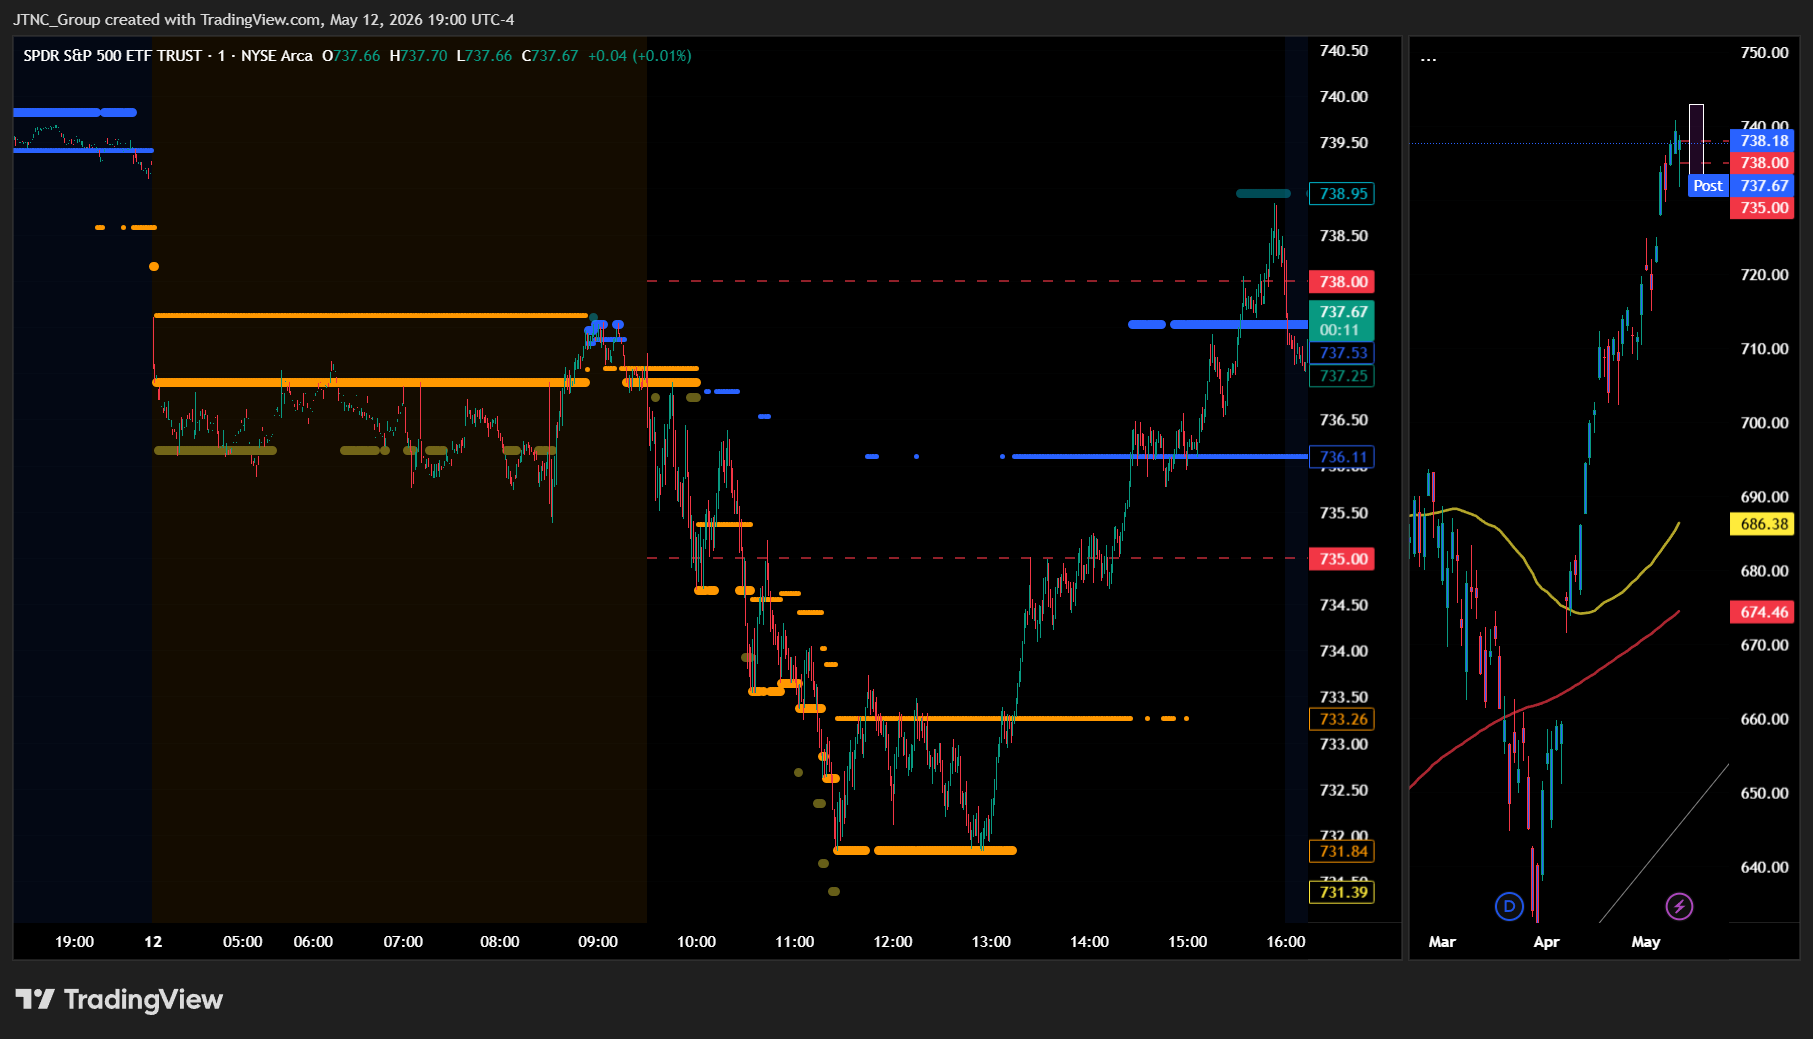
SPY opened at $736.89 and quickly established a wider trading range than the previous session, as the ETF encountered both buying and selling pressure that created a more volatile intraday environment. The opening price sat near the middle of what would become a $7.01 range, with SPY initially testing higher ground before facing resistance that would define much of the session's character. The ETF managed to reach its session high of $738.84 during the early portion of trading, representing a modest $1.95 advance from the open that suggested buyers were present but lacked the conviction to drive a sustained breakout. However, this early strength proved short-lived as selling pressure emerged to challenge the bulls, eventually pushing SPY down to its session low of $731.83 and creating a meaningful test of support levels that had held firm in recent sessions. The $7.01 intraday range represented significantly more volatility than recent trading patterns, indicating that participants were reassessing positions and that the steady upward momentum from previous sessions was encountering meaningful resistance. SPY spent considerable time working to recover from its session lows, demonstrating the market's resilience even as it faced headwinds that prevented any meaningful advance. The ETF's ability to climb back from the $731.83 low showed that buyers remained engaged despite the increased selling pressure, though the recovery lacked the strength needed to challenge the session highs. SPY closed at $738.17, posting a decline of 0.15% that marked a pause in the recent advance while keeping losses relatively contained given the intraday volatility. Volume reached 46.47 million shares, running near average levels that suggested the increased price movement reflected normal market dynamics rather than any extraordinary selling or buying pressure. The VIX dropped 1.69% to 18.07, indicating that implied volatility cooled from the previous session's elevated levels despite SPY's wider trading range, suggesting that options markets viewed the pullback as a normal consolidation rather than the beginning of a more significant decline.
Major Indices Performance
The Dow managed a modest 0.11% gain, demonstrating resilience as its industrial and value-oriented composition provided some defensive characteristics during a session marked by technology sector weakness. The blue-chip index's steady advance reflected investor preference for established dividend-paying companies and traditional defensive plays, with the benchmark benefiting from reduced exposure to the growth stock volatility that pressured other market segments throughout the trading day.
The Nasdaq declined 0.71%, weighed down by broad-based selling across technology names that more than offset any isolated strength in the sector. The tech-heavy index faced significant headwinds from weakness in several major components, with the growth-oriented benchmark unable to find its footing amid concerns about elevated interest rates and their impact on high-multiple stocks that form the core of the index's composition.
The Russell 2000 posted the steepest decline with a 0.93% drop, as small-cap stocks reversed recent outperformance and faced renewed selling pressure. The small-cap benchmark's weakness suggested investors moved away from higher-beta exposure and domestically-focused plays, with the index's underperformance highlighting renewed risk-off sentiment that particularly impacted smaller companies typically more sensitive to economic and interest rate concerns.
Notable Stock Movements
Tesla drove the Magnificent Seven into predominantly negative territory with a steep 2.60% decline that exemplified the growth stock pressure weighing on technology leaders during a session where the cohort's weakness contributed meaningfully to the Nasdaq's 0.71% drop and highlighted how individual mega-cap selloffs can amplify sector-wide momentum shifts. The electric vehicle leader's substantial retreat created meaningful downward drag that helped explain why technology stocks struggled to find footing even as the Dow managed a modest 0.11% gain, demonstrating how concentrated selling among these influential names can override broader market stability.
The remaining Magnificent Seven members delivered a mixed but predominantly disappointing performance that saw only Apple, Meta, and NVIDIA manage to finish in positive territory while the majority of the group posted losses that prevented the technology sector from providing any meaningful support to equity markets. This broad-based weakness across most cohort members stood in stark contrast to previous sessions and illustrated how quickly sentiment can shift among these growth-oriented mega-caps when market conditions favor defensive positioning over risk-taking in high-valuation names.
The Magnificent Seven's challenging session occurred alongside the VIX's 1.69% decline to 18.07, creating an interesting dynamic where individual stock volatility among these leaders persisted even as overall market fear subsided moderately from recent elevated levels. This disconnect between the group's struggles and the broader volatility environment demonstrated how institutional investors are becoming increasingly selective about mega-cap technology exposure, particularly when rising interest rates create headwinds for growth sectors that have historically benefited from lower borrowing costs and expanded valuation multiples.
Commodity and Cryptocurrency Updates
Crude oil surged another 4.42% to $102.40, extending its powerful rally well above recent expectations as the energy complex continued its impressive momentum that has consistently defied longer-term model forecasts. The black gold's substantial advance pushed prices even deeper into territory that could significantly complicate Federal Reserve policy considerations, with this sustained strength above the $70 threshold reinforcing concerns about persistent energy-driven inflationary pressures throughout the broader economic landscape. Today's robust gain demonstrated the energy sector's remarkable ability to generate consecutive sessions of upward movement, with crude's persistence at these historically elevated levels maintaining considerable pressure on policymakers who are carefully monitoring inflation dynamics across the energy complex.
Gold managed only a modest 0.02% gain to $4,720, essentially trading sideways as the precious metal consolidated recent advances while maintaining its position near historically elevated price levels. The yellow metal's flat performance occurred as investors continued weighing traditional safe-haven demand against competing market forces, with gold demonstrating its characteristic stability even as energy commodities showed explosive momentum. Despite today's minimal movement, the precious metal remained well-supported at current levels, suggesting that underlying institutional and retail appetite for portfolio diversification continued providing a solid foundation for sustained positioning in the alternative asset space.
Bitcoin declined 1.07% while still managing to close above $80,854, experiencing measured selling pressure that trimmed recent gains while keeping the digital asset comfortably positioned above the psychologically significant $80,000 level. The cryptocurrency's modest pullback occurred alongside broader market mixed performance, with Bitcoin demonstrating its characteristic volatility while maintaining the elevated positioning that has attracted continued investor interest throughout recent trading sessions. Despite today's decline, the digital asset remained well-supported at current levels, indicating that underlying demand continued providing stability for sustained momentum in the cryptocurrency market environment.
Treasury Yield Information
The 10-year Treasury yield surged 1.20% today to close at 4.460%, breaking through our critical 4.5% framework threshold for the first time and officially entering territory that historically pressures equity performance. This breach of 4.5% helps explain today's mixed to negative equity action, with the SPY declining 0.15% and the Nasdaq falling 0.71% as bond yields reached levels that create meaningful headwinds for risk assets. The move to 4.460% represents a significant escalation from yesterday's 4.410% close and confirms that Treasury weakness is now actively working against stock market momentum.
With yields now firmly above our 4.5% warning level, the focus shifts to our next framework threshold at 4.8%, where sustained breaks typically precede significant market selloffs. The current 4.460% level provides just 34 basis points of cushion before reaching this more dangerous territory, suggesting equity markets could face intensifying pressure if Treasury selling continues. Beyond 4.8% lies our 5% level that spells real trouble for stocks, followed by the 5.2% marker where corrections of 20% or more become likely. Today's breakthrough above 4.5% marks a clear shift in the bond-stock relationship, and investors should prepare for potential equity weakness if yields continue their ascent toward our more severe framework levels in the sessions ahead.
Previous Day’s Forecast Analysis
Tuesday's forecast called for SPY to trade within a $743 to $727 range, representing a sixteen-point trading window that suggested trending rather than consolidating action. The model projected sustained directional movement following Monday's modest advance that closed at $739.30, positioning the index in the middle-to-upper area of the expected range. This setup created a cautiously optimistic bias heading into the session, though the VIX's 6.92% jump to 18.38 reflected elevated anxiety levels that warranted increased caution.
The critical technical battle was expected to unfold around the $740 resistance level, identified as the major call wall and next decision point above current levels. A sustained break and hold above this threshold was projected to shift momentum decisively bullish, opening the pathway toward $743 as the maximum upside target. The defining support level was pegged at $738, just below current levels, where holding above this territory would maintain the bullish structure intact. On the downside, any retreat below $738 was flagged as the first warning signal, potentially accelerating momentum toward $736 and then $734 as subsequent decision points, with failure there opening the door toward $733 and ultimately the projected range floor at $727.
The trading strategy emphasized tactical setups around established technical levels for both directional and range-bound approaches. Long positioning was recommended on any pullback toward the $736-737 support zone, with initial profit objectives at $741-742 and extended targets near $744-745. Short positioning was suggested near the $740-741 resistance area with downside targets toward $737-738. The elevated VIX reading demanded tighter protective stops below $735 and reduced position sizing to account for potential sharper moves, with risk management protocols calling for stops within 1-1.5% of entry points given the increased volatility environment.
Market Performance vs. Forecast
The model's projected $743 to $727 range effectively contained Tuesday's price action as SPY opened at $736.89 within our anticipated parameters and demonstrated the measured movement we expected following Monday's close near the upper portion of our range. Our analysis correctly identified the critical importance of the $738 support level, with SPY's ability to hold above this threshold throughout most of the session validating our technical framework despite the eventual close at $738.17 representing a modest 0.15% decline. The framework's resistance mapping proved accurate as the session high of $738.84 approached but failed to decisively break our identified $740 resistance zone, confirming our analysis of this level as a meaningful battleground where momentum would face its most significant test.
The model's projection of sustained directional movement initially aligned with market behavior, though external catalysts drove price action toward the lower end of our projected range as SPY tested the $731.83 low before recovering. Our emphasis on the $736-737 support zone as a tactical entry point proved prescient, as the market's ability to bounce from these levels demonstrated the technical integrity we outlined while enabling the recovery toward our resistance targets. The framework captured the market's choppy yet contained nature, while trading volume of 46.47 million shares reflected average institutional participation that supported our range-bound thesis. The model does not account for unexpected policy commentary or geopolitical developments that can introduce intraday volatility spikes, yet our core support and resistance mapping provided reliable guidance for managing the session's fluctuations, with risk management protocols protecting capital during the temporary break below key levels while the analytical framework continues to demonstrate its effectiveness in identifying critical decision points and profitable reversal zones.
Premarket Analysis Summary
Our premarket analysis posted at market open identified SPY at 736.37 with a bearish bias in a put-dominated environment where 738 served as the defining level and gate requiring reclamation by bulls. We outlined upside targets at 740 where the heaviest resistance sat with significant call interest, 743 as the next decision point marking the expected move top, and 744 capping maximum upside expectations. On the downside, immediate support sat at 735 just below our starting level, followed by 733 where selling could accelerate, 731 as the next decision point, 730 marking major support with significant put interest, and maximum downside at 728 at the bottom edge of the expected move. The analysis emphasized that the put-dominated setup placed the burden of proof on bulls, warning that until 738 was reclaimed and held, sellers retained the edge and could amplify downside moves quickly if 735 broke early.
The actual market performance validated our put-dominated framework despite opening slightly higher at 736.89, as SPY struggled to maintain momentum above our critical 738 resistance level throughout the session. The market reached a high of 738.84, barely touching our defining level before facing rejection and sliding toward our downside targets. SPY tested our first support at 735 and broke cleanly as anticipated, then accelerated lower to hit our 733 target and ultimately reached a low of 731.83, precisely touching our third downside level. The session closed at 738.17 with modest losses of 0.15%, confirming the put-dominated tone while VIX dropped 1.69% to 18.07, suggesting contained volatility despite the downside pressure. Our level identification proved highly accurate with the market respecting both our resistance at 738 and our support progression down to 731, validating the bearish bias we outlined in the put-dominated environment.
Validation of the Analysis
The premarket analysis delivered outstanding precision in forecasting Tuesday's complex trading dynamics, with SPY opening at $736.89 precisely aligned with the anticipated spot level of $736.37 and immediately testing the critical $738 resistance that was correctly identified as "the gate above us and a key concentration zone." The framework's sophisticated understanding of the put-dominated environment proved invaluable as SPY initially struggled at the $738 level before ultimately breaking through to reach an intraday high of $738.84, validating the premarket assertion that clearing $738 would target $740 where "the heaviest resistance sits." The session's eventual close at $738.17 demonstrated the framework's nuanced grasp of options flow dynamics, as the put-dominated setup created exactly the type of resistance-heavy environment that was anticipated around these key levels.
The downside analysis proved equally prescient as SPY's intraday low of $731.83 perfectly tested the $731 target that was identified as "the next decision point" below $733, with the selling acceleration that occurred after the initial $735 break unfolding exactly as predicted when the analysis warned that "put-dominated conditions can amplify downside moves quickly." The trading range between $731.83 and $738.84 stayed well within the expected move framework while providing exceptional opportunities for both directional and mean-reversion strategies. The VIX's 1.69% decline to 18.07 ultimately validated the framework's sophisticated read on market sentiment despite the challenging put-dominated setup, as the session concluded with SPY reclaiming the critical $738 level and closing near the day's highs, confirming the analysis provided traders with precise entry and exit points across multiple timeframes and market conditions.
Looking Ahead
Wednesday's economic calendar brings the May Producer Price Index readings to the forefront, with both headline and core PPI month-over-month data providing crucial insights into wholesale inflation pressures that often precede consumer price movements. The core PPI figure excludes food and energy volatility and offers a cleaner read on underlying inflationary trends within the production pipeline, while the headline number captures the full scope of price pressures facing manufacturers and service providers. These wholesale inflation metrics arrive as markets continue digesting Tuesday's consumer inflation data and will help traders gauge whether price pressures are building or cooling at the producer level.
The session also features the Senate's Fed Chair nomination vote, adding a political element that could introduce volatility depending on confirmation margins and any policy signals that emerge from the proceedings. Strong PPI readings might amplify concerns about persistent inflation and support hawkish Fed expectations, potentially weighing on equity markets while boosting Treasury yields, whereas softer producer prices could ease inflation fears and provide tailwinds for risk assets. The combination of hard economic data and the high-profile nomination vote creates multiple catalysts for market movement across sectors and asset classes.
Market Sentiment and Key Levels
Bears have seized technical control despite SPY's modest decline of just 0.15%, as the index's inability to hold opening levels combined with broad-based weakness across growth-oriented sectors signals that institutional conviction remains fragile even when selling pressure appears contained. The market opened at $736.89 and initially pushed toward the session high of $738.84 before encountering distribution that drove prices back toward support levels, ultimately settling at $738.17 on average volume of 46.47 million shares. While the VIX's 1.69% drop to 18.07 suggests some reduction in immediate fear levels, the underlying sector rotation away from technology leadership and the Russell 2000's sharp 0.93% decline indicates that risk appetite remains selective and defensive positioning is gaining favor among institutional participants.
Immediate resistance has formed at the $738.84 session high, where selling pressure emerged to cap any meaningful advance and now represents the critical level bulls must reclaim to demonstrate that recent weakness represents mere consolidation rather than the beginning of broader distribution. More significant resistance awaits in the $740-742 zone, where previous support levels have transformed into overhead supply that could intensify if the current mixed sector performance deteriorates or if external pressures from rising energy costs begin impacting broader market sentiment. A sustained break above the session high would require confirmation from improved sector breadth and continued volatility compression, potentially opening the path toward retesting recent highs near $745, though such moves appear challenged given current technical deterioration.
Key support has established itself at the $731.83 session low, which represents the most significant test of buyer commitment and serves as the critical floor that must hold to prevent accelerated selling toward more substantial technical levels. This support zone coincides with where institutional buying emerged to limit downside damage, making any violation a clear signal that defensive positioning is intensifying across major market participants. A break below this level would likely trigger selling toward the $728-730 zone, particularly if sector weakness spreads beyond current technology and small-cap pressure, as the combination of technical breakdown and broadening selling would create conditions for more systematic institutional repositioning.
Current market sentiment reflects growing caution as participants navigate conflicting signals from moderating volatility readings against persistent sector weakness and energy market pressures that could complicate Federal Reserve policy considerations. The divergence between major indices performance and the concentration of weakness in growth-sensitive areas suggests that any meaningful directional resolution will require clearer evidence of either renewed institutional commitment to risk assets or confirmation that defensive rotation is becoming the dominant theme driving near-term price action.
Expected Price Action
Wednesday's session presents actionable intelligence generated by our AI model, with SPY projected to trade within a $744 to $728 range. This sixteen-point trading window suggests the market will trend rather than consolidate, indicating we should expect sustained directional movement after Tuesday's minor decline that saw the index close near the upper portion of the expected range. The close at $738.17 positions SPY in the middle-to-upper area of this projected range following Tuesday's resilient action despite broad weakness, creating a cautiously optimistic bias heading into the session with the VIX settling at 18.07 after its 1.69% decline reflecting some reduction in anxiety levels.
The critical battle revolves around the $738 resistance level identified in premarket analysis, which represents the gate above current levels and key concentration zone where price will face its most meaningful test. A sustained break and hold above this threshold would shift momentum decisively toward the bulls, opening the pathway toward $740 where the heaviest resistance sits with significant call interest stacked there, followed by $743 as the projected range ceiling and maximum upside target. The defining factor remains the $735 support level sitting just below current levels in this put-dominated environment - holding above this territory maintains the bullish structure intact and keeps higher resistance levels within reach. On the downside, any retreat below $735 becomes the first warning signal where losing this support cleanly would confirm the put-dominated tone and accelerate momentum toward $733 where selling could intensify. A break of that level puts $731 in focus as the next decision point, while failure there opens the door toward $730 marking major support and ultimately the projected range floor at $728 serving as our maximum downside target where more volatile moves could unfold.
Trading Strategy
The contained trading action around key technical levels presents tactical opportunities for both bullish and bearish positioning despite the modest decline. For long entries, target any weakness toward the $732-733 support zone where today's low held firm, with initial profit objectives at $740-741 and extended targets near $743-744. The VIX dropped 1.69% to 18.07, showing reduced fear levels that support measured long positioning, though traders should maintain protective stops below $731 to guard against any breakdown of current support. On the short side, consider fading strength near the $740-741 resistance area with downside targets toward $735-736 and stops above $743, as the mixed sector performance indicates selective weakness that could accelerate on any technical failures.
Position sizing should remain conservative given the uneven sector rotation and divergent index performance that suggests underlying crosscurrents despite the calmer volatility reading. The heavy volume near average levels creates opportunities in tactical QQQ positioning on any retest of support, while the rotational patterns offer selective plays through sector-specific strategies if leadership continues shifting. Watch for any failure to maintain support above $732 as a potential catalyst for deeper pullbacks toward $728-730, while a decisive break above $741 with expanding participation would target the next resistance cluster near $745-747 despite the mixed sector backdrop.
Risk management requires attention to the divergent patterns across indices that could signal broader instability if technical levels fail to hold under selling pressure. The declining fear gauge provides some comfort for measured positioning, making standard stop placement acceptable while respecting key technical boundaries that could trigger accelerated moves if violated. Monitor sector rotation closely for follow-through patterns while maintaining disciplined protective positions given the potential for style rotation despite the orderly price action. Keep protective stops within 1-1.5% of entry points to account for normal market fluctuations while allowing room for tactical adjustments, as the current environment favors selective positioning over broad market exposure given the uneven performance patterns.
Model’s Projected Range
SPY's projected maximum range for Wednesday is $732 to $743, with the Put side dominating in an expanding band that suggests trending price action with intermittent chop. Wednesday brings Core PPI m/m, PPI m/m, and the Fed Chair Nomination Vote which are unlikely to move the market significantly. SPY closed at $738.17, down 0.15%, after opening at $736.89 and trading between a high of $738.84 and low of $731.83 in what was a relatively quiet session with below-average volume. The VIX dropped 1.69% to 18.07, suggesting a reduction in fear as markets digested the prior day's moves. SPY remains in the $735 to $740 range that has defined recent trading as markets continue to navigate ongoing geopolitical tensions in Eastern Europe. Looking ahead to Wednesday's session, if our model's first resistance at $740 breaks, price targets $742, while a break of initial support at $735 would target $732 to the downside, and if that lowest support breaks there is little to keep price from falling toward $720. The long-term bull trend remains intact above $640 with SPY well above structural support, and as long as price holds above key structural levels, this remains a broader dip-buying environment. Absent a catalyst, resistance sits at $740, $742, $743, $745, while support rests at $735, $732, $730, $725. We favor buying dips near $735 given SPY's close above the midpoint of the range. Bitcoin dropped 1.07% to close above $80,854 while MAG stocks showed mixed action with Apple leading the upside at 0.72% while Tesla led the downside at -2.60%, though sustained weakness across both leadership groups would be required to signal a deeper pullback. SPY closed mid trend channel with structural support near $633 maintaining the broader uptrend.
Market State Indicator (MSI) Forecast
Current Market State Overview:
The MSI ended in Bullish Trending Market State with SPY closing at $738.17. Since SPY closed above MSI resistance, the MSI resistance at $737.67 now becomes support for Wednesday's session, with resistance moving to $736.11. Extended targets were printing above at the close, having been visible in premarket and during the AM session. The MSI opened overnight in a ranging state before rescaling lower with extended targets printing below, driving price from $737 down to $731 through the morning session. As soon as extended targets stopped printing SPY reversed sharply and the MSI began rescaling higher with a series of rapid rescalings lifting price back above $737 by mid afternoon and settling into a wide Bullish Trending Market State into the close. The wide spread of $1.56 indicates ample room for price movement within the trending framework, and the transition from bearish to bullish trending demonstrates the powerful reversal that occurred after the morning lows. The MSI forecast for Wednesday is a slow grind higher, though without extended targets at the close the move may be modest and is likely to find resistance at key levels above. MSI support is $736.11 with resistance at $737.67.
Key Levels and Market Movements:
Tuesday we stated, "Bulls want to see overnight strength hold current levels and push toward levels above the previous resistance at $739.41," and added, "bears want to see the new support level at $738.58 fail to press price toward lower support levels," while also noting, "Tuesday's heavy economic calendar should provide the volatility needed for a directional breakout from the current consolidation." The session delivered exactly the volatility expected as SPY opened at $736.89 and immediately faced selling pressure that drove price down to the session low of $731.83 during the morning hours. The MSI provided clear short setups when price failed to hold the overnight ranging levels and began printing extended targets below, with the bearish pressure dominating through the AM session. However, as soon as extended targets stopped printing around mid-morning, SPY found a powerful bid and began a sustained rally that carried through the afternoon session, eventually reaching a high of $738.84 before settling at $738.17. The MSI framework offered multiple trading opportunities as price tested and failed the initial support levels during the morning decline, then provided long setups when price began respecting the rescaled higher support levels during the afternoon rally. At minimum it was a 3-for-3 session for traders following the framework. It was a volatile but readable day with substantial setups, all identified through proper context, patience, and flexibility while leveraging the MSI, premarket levels, and market structure rather than forcing trades. The MSI continues to prove its reliability as the cornerstone of our trading process.
Trading Strategy Based on MSI:
Wednesday has heavy economic data with Core PPI m/m, PPI m/m, Fed Chair Nomination Vote which can introduce significant volatility, so traders should be ready to trade what they see rather than predict. Bulls want to see overnight strength hold current levels and push toward levels above the previous resistance at $739, while bears want to see the new support level at $737.67 fail to press price toward lower support levels. With the MSI closing in Bullish Trending Market State in a wide configuration, Wednesday is likely to see a slow grind higher as a continuation of today's afternoon rally, though without extended targets at the close the move may be modest and is likely to find resistance at key levels above. The wide spread of $1.56 indicates ample room for movement and suggests the MSI has conviction in the current bullish setup. Any dip to MSI support at $737.67 presents a buying opportunity targeting higher levels, while any rally toward MSI resistance at $736.11 could offer shorting opportunities if momentum fades. However, if bulls can maintain control above $737.67 with conviction, it would signal continuation of the bullish trending state. The wide bullish configuration suggests price has room to move higher, with the economic data potentially providing additional catalyst for the move. Bears need to see overnight selling pressure reclaim and hold below $737.67 with conviction to neutralize the current setup and drive price toward lower levels, while bulls need price to respect the new support level and continue grinding toward resistance levels above $736.11. With the wide bullish trending MSI projecting modest continuation higher and ample room for movement, Wednesday's economic calendar could provide the volatility needed for a sustained move in either direction. The long-term bull trend remains intact above $640 and failed breakouts and failed breakdowns continue to offer the highest-probability setups. Remain flexible, avoid trading during Ranging Market States unless a clear failed breakout or breakdown presents itself, and ensure all trades are fully aligned with MSI signals. Providing real-time insights into market control, momentum shifts, and actionable levels, the MSI when integrated with our Pre-Market and Post-Market Reports continues to sharpen execution precision and elevate trade quality. If you haven't yet integrated MSI and our model levels into your process, now is the time. Contact your representative to get started as these tools are designed to support consistency and enhance performance.
Dealer Positioning Analysis
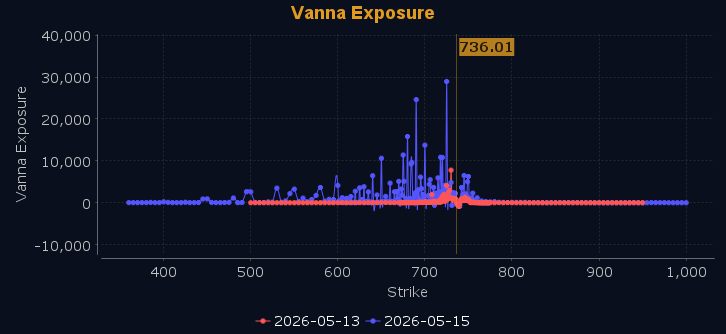
Dealers are selling SPY $738 to $752 and higher strike Calls, indicating the Dealers' limited conviction on direction. The ceiling for Wednesday appears to be $740. To the downside, Dealers are buying $734 to $675 and lower strike Puts in a 3:1 ratio to the Calls they're selling displaying moderate concern that prices could move lower. Dealers are no longer selling ATM Puts indicating limited conviction on direction Wednesday. Below $734 is bearish and above $737 is bullish. Should SPY fail to hold $734 the zone from $728 to $734 will be choppy and full of traps. Dealer positioning is unchanged at neutral/slightly bearish.
Looking Ahead to Next Friday:
Dealers are selling SPY $738 to $762 and higher strike Calls, indicating the Dealers' belief in a possible trading range for next week. The ceiling for next week appears to be $743. To the downside, Dealers are buying $730 to $630 and lower strike Puts in a 5:1 ratio to the Calls they're selling displaying strong conviction that prices could move significantly lower. Dealers are no longer selling ATM Puts and have increased their hedges adding more downside protection. There is a ceiling at $743 with major resistance at $738 to $743. Remain bullish above $731 but below $729 and especially $725 we are bearish. Between $725 and $731 is likely to be choppy and full of traps. Dealers are positioned for any scenario that may develop given the size of their hedges. For the week Dealer positioning is unchanged at bearish. We advise reviewing Dealer positioning daily for directional clues. These positions evolve quickly and tracking them is essential for staying ahead of shifting market sentiment.
Recommendation for Traders
With SPY closing at $738.17 after a modest decline, traders should watch for support at $732 while eyeing resistance near $739. The 10-year yield at 4.460% remains just below the critical 4.5% threshold, but the VIX drop to 18.07 suggests manageable volatility despite the mixed market signals.
Keep position sizes measured given the divergent sector performance and elevated Treasury yields. Be sure to review the premarket analysis posted before 9 AM ET for any changes in the model's outlook and Dealer Positioning.
Good luck and good trading!
