Market Insights: Monday, May 12th, 2025
Market Overview
Markets exploded higher on Monday after a surprise breakthrough in U.S.-China trade relations sent buyers flooding back into risk assets. Stocks surged after the two countries agreed to a 90-day pause on tariffs, dramatically reducing levies on each other's goods. The U.S. cut duties on most Chinese imports from 145% to 30%, while China slashed its own tariffs on American products from 125% to 10%. Investors cheered the unexpected scope of the tariff rollback, viewing it as a meaningful step toward de-escalating trade tensions that have long weighed on markets. The S&P 500 soared nearly 3.3% to its highest close since early March, while the Dow ripped over 1,100 points higher in a 2.8% rally. The Nasdaq led with a 4.3% surge as traders piled into tech stocks, especially the large-cap names that had been under pressure from trade war rhetoric. Tesla, Amazon, Apple, and Nvidia all saw major gains, fueling a powerful move in the broader indices. President Trump added fuel to the rally by signing an executive order aimed at slashing U.S. drug prices, a move that could boost pharma company revenues overseas. Meanwhile, Treasury yields and the dollar climbed as risk appetite returned, and oil prices rose in a broad commodity rally. Traders now turn their attention to this week’s economic calendar, which includes CPI data Tuesday and PPI on Thursday, both key reads on inflation that could impact market momentum going forward.
SPY Performance
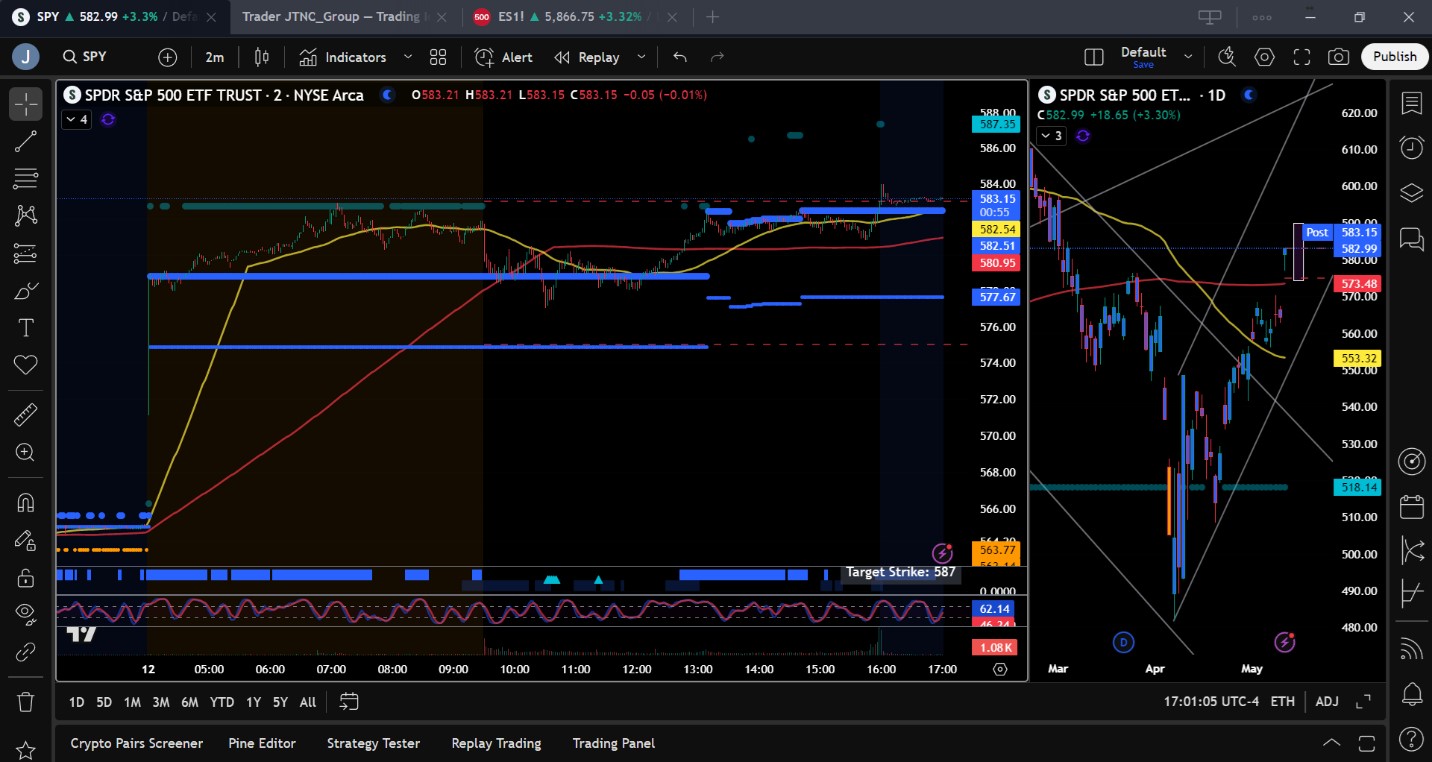
SPY jumped 3.29% on Monday to close at $582.88, a massive rally fueled by the tariff deal with China and improved sentiment across global equities. The ETF opened at $581.67, briefly dipped to a session low of $577.04, and climbed to a high of $582.58 before settling near the top of the range. Despite the big move, volume remained just above average at 71.28 million shares, suggesting some sidelined traders may be waiting for confirmation before joining the rally. SPY now sits above the key $580 level and firmly above its 200-day moving average for the first time since March, putting bulls back in control heading into Tuesday’s CPI release.
Major Indices Performance
The Nasdaq led the way with a 4.35% gain as tech stocks exploded higher, followed closely by the Russell 2000, which rallied 3.51%. The S&P 500 climbed 3.3% to its highest level in over two months, while the Dow added 2.81%, surging more than 1,100 points. Monday’s strength was broad and powerful, with all major indices posting outsized gains in response to the U.S.-China tariff truce. The sudden shift in trade policy provided the kind of headline catalyst that markets had been waiting for, and the response was emphatic. With the economic calendar heating up later in the week, this rally could gain more traction or quickly reverse depending on incoming data.
Notable Stock Movements
The Magnificent Seven roared back to life, with Nvidia soaring 8.09% to lead the pack. Tesla, Apple, Meta, and Amazon all rallied between 5.44% and 7.2%, reflecting renewed optimism around global growth and trade. Microsoft and Alphabet were more modest gainers, but still posted solid green days. The only outlier was Netflix, which fell 2.65%, bucking the tech rally as traders rotated into more trade-sensitive and growth-oriented names. The sharp bounce in tech underscores just how much fear had been priced into the sector and how quickly sentiment can reverse when macro headlines shift.
Commodity and Cryptocurrency Updates
Crude oil added 1.69% to close at $62.07, continuing its recent uptrend. While near-term price action may remain volatile, our model continues to project a pullback toward $50, where we expect stronger buying interest to emerge. Gold tumbled 3.11% to $3,239, as investors rotated out of safe havens in favor of risk assets. Bitcoin dropped 1.94% to close just above $102,200, giving back some recent gains. Our strategy remains unchanged: we are buyers between $83,000 and $77,000, with profit targets above $85,000. No new trades should be initiated below $77,000 due to elevated downside risk.
Treasury Yield Information
The 10-year Treasury yield surged 2.24% to close at 4.473%, pushing closer to the key 4.5% threshold that typically pressures equities. With markets rebounding strongly on the back of geopolitical news, rising yields may start to matter more again, especially with CPI data on deck. A break above 4.5% could limit equity upside, while a move toward 4.8% would likely shift sentiment more defensively. For now, the rise in yields is being interpreted as a sign of growth expectations returning rather than a red flag.
Previous Day’s Forecast Analysis
Friday’s model called for a trading range of $560 to $570 with a bullish bias. It identified $565 as a pivotal level, suggesting long trades above $562 and a stretch upside target of $575. The framework emphasized that the market remained Call dominated with room for either a continuation of Thursday’s rally or further consolidation. Support was pegged at $560, $558, and $555. The analysis noted that without a clear catalyst, price might remain choppy within a defined range, and traders were advised to stay tactical.
Market Performance vs. Forecast
SPY blew past expectations on Monday, surging well above the projected $560–$570 range after the surprise tariff relief over the weekend. The ETF opened at $581.67 and closed at $582.88, more than $12 above the upper end of the prior forecast. Resistance levels, including $570 and $575, were taken out early in the session with little opposition, as the market gapped higher and never looked back. This sharp move illustrates how unexpected geopolitical news can instantly invalidate technical models. Still, traders who recognized the breakout above $575 had ample opportunity to capture upside toward $580 and beyond. With SPY now above its 200-day moving average, the forecast pivots toward identifying upside continuation levels.
Premarket Analysis Summary
In Monday’s premarket analysis posted at 8:09 AM, SPY was trading at $581.33 with $580 marked as the critical bias level. The model highlighted upside targets at $583, $585, and $588, with downside support at $580 and $575. The analysis flagged a long bias as long as SPY held above $580 and cautioned that a drop below $580 could lead to a pullback toward $575. The premarket note emphasized that while the news had created a rally environment, traders should remain cautious if early gains failed to hold.
Validation of the Analysis
Monday’s price action validated the premarket analysis with precision. SPY opened just above the bias level at $581.67 and never lost that key $580 support, paving the way for a textbook long-biased session. The ETF reached as high as $582.58 before closing strong at $582.88, staying within reach of the first upside target at $583. Though volume lagged slightly, the directional move was clear, and any long trades initiated above $580 were well rewarded. The call for upside continuation as long as $580 held was spot on, reinforcing the utility of the model's bias level and target structure.
Looking Ahead
Tuesday brings the long-awaited CPI report for April, which could be a pivotal driver for near-term market direction. With inflation data back in focus, the market may reassess its recent bullish breakout depending on the report’s tone. A cooler-than-expected CPI would likely fuel the rally, pushing SPY toward $585 or even $590. However, a hot reading could halt momentum and send traders back into defensive mode. Expect heightened volatility at the open and throughout the session as markets digest the data.
Market Sentiment and Key Levels
SPY closed at $582.88, just below the major $585 resistance zone. Bulls are clearly in control with the market back above the 200-day moving average for the first time since March. The key resistance levels to watch are $584, $585, and $590, while downside support begins at $580, with stronger levels at $575 and $570. If SPY breaks and holds above $585, a run toward $590 and potentially the March highs near $597 becomes increasingly likely. On the downside, any break below $575 could attract sellers targeting $570. With volatility set to increase around CPI data, expect swift moves between these levels.
Expected Price Action
Our AI model projects a trading range of $578 to $590 for Tuesday, providing actionable intelligence for navigating the next session. The bias remains bullish, especially with SPY closing above key resistance zones and nearing $585. A confirmed breakout above $585 would likely target $590, and a move beyond that could place the March highs in play. However, if the CPI report disappoints and SPY slips below $575, watch for a drop to $570. A loss of $570 could shift some momentum back to the bears. With the market driven by macro headlines, it's critical to stay nimble and trade reactions rather than predictions.
Trading Strategy
With SPY hovering near major resistance, long trades remain favored above $570, targeting $585 and $590. A breakout above $585 on strong volume could offer momentum trades with the next leg up pointing toward $597. Short setups become viable if SPY loses $570, with potential downside to $565 and $560. Failed breakouts above $585 may also offer quick reversal opportunities but we heavily favor longs over shorts in the current environment. The VIX closed at 18.4, signaling lower volatility, but that could change quickly post CPI. Use tighter stops near resistance and consider reducing position size until volatility direction is confirmed.
Model’s Projected Range
The model’s maximum projected range for Tuesday is $574.25 to $590, with the Call side dominating in a narrowing range suggesting consolidation with periods of trending behavior. CPI is due Tuesday, with PPI following on Thursday, and both events have the potential to move markets. Today saw a massive rally driven by news that China tariffs have been reduced to 30% for 90 days, allowing time for both sides to work toward a deal. As we often say, it's important to trade what you see, since models cannot price in headline-driven events until after the fact. With SPY now trading above its 200-day moving average for the first time since March 25th, the March highs near $597 are becoming a clear target for the bulls. A move of that size would hand control of the market to the bulls and set the stage for a broader push toward new all-time highs. However, CPI days tend to be risky, and anything can happen. While the bull trend remains intact, it's important to stay alert to failed breakouts and failed breakdowns, which often serve as signals for the next directional move. If bulls can hold $575, the market is likely to continue higher. In the event of a negative CPI print, a drop to $570 could offer a failed breakdown setup, with $590 as a viable upside target. We've said for months that above $585, bulls take complete control of the market, and the bears will step aside. With SPY closing at $582.99, that scenario is close to becoming reality. Of course, if $570 fails to hold, the bears may attempt a move lower, though that outcome seems unlikely at the moment. SPY remains within the $565 to $585 zone, an area where institutional traders will look to reduce exposure. That said, today’s news has shifted the narrative enough to suggest that higher prices are more likely in the near term, rather than a retest of the April lows. Key levels to watch on Tuesday include resistance at $584, $585, and $590, and support at $580, $575, and $570. Resistance appears to be fading, leaving little to hold price down in the near term, while support continues to build, particularly at $580 and $575. As we have emphasized since April 2nd, macroeconomic factors such as tariffs, bond yields, and inflation are expected to remain the dominant forces over the next 60 days, barring a clearer policy shift from the White House. The VIX closed at 18.4, well below its 23 pivot level, which is notable, as readings above 23 tend to weigh on equities, while dips below tend to support them. With SPY ending the day just under $583, the bulls will likely attempt to push through the $585 level on Tuesday to assert full control of the market. SPY remains in a steep, bullish trend channel that began at the April lows, though the channel may be too steep to sustain for long, suggesting a potential flattening through consolidation or a mild pullback. While momentum clearly favors the bulls, in a market this volatile, it's critical to remain flexible and ready for quick shifts in sentiment.
Market State Indicator (MSI) Forecast
Current Market State Overview:
The MSI is currently in a wide bullish trending market state, with SPY closing just above MSI resistance, which has now turned into support. Extended targets began to print right at the close, with most appearing during the overnight session following the announcement of the China tariff news. Overnight, the MSI shifted from a ranging to a bullish state, fueled by a massive gap up that contributed to today’s 3.3% gain. Extended targets printed during after the gap up and continued into the market open. At the open, the broader market, driven by herd behavior, took profits, which caused the extended targets to stop printing and led to a retest of the MSI support. That support held, and the market rallied through the afternoon, ultimately closing at the session highs with extended targets printing again into the close. The MSI rescaled higher at 1:00 p.m. and again at 2:45 p.m. Although there were some instances of extended targets during the afternoon rally, they faded quickly until the final two minutes of trading. Given the current bullish MSI state, further gains are likely. The MSI may either rescale higher or remain in its current state until increased volume prompts a new interpretation. Current MSI support is $582.50 and lower at $577.67.
Key Levels and Market Movements:
On Friday, we noted: “Bulls still control the tape,” and highlighted that “failed breakdowns below $560 and failed breakouts above $565 present the most profitable setups.” We also stated that “if bulls can reclaim and hold above $570, a push toward the 200 DMA at $573 becomes more likely.” As long-time readers know, we often emphasize that when new information enters the market, you trade what you see. Today reinforced that point. After a massive gap up at 4 a.m. ET, SPY surged to $582.75 before encountering resistance. By the open, extended targets had stopped printing but given the strength of the move and clearly favorable market news, shorting was off the table. Instead, we waited for a test of MSI support at $578.75, watching for a failed breakdown pattern to go long. That opportunity arrived at 10:30 a.m. with a textbook setup, prompting a long entry at $578. Our first target was the premarket level of $580, hit in under an hour. We banked 70% of the position and set a second target at another premarket level: $583. We held patiently for several hours. When extended targets resumed printing at 12:45 p.m., confidence grew. However, after the MSI rescaled higher, we opted to take profits at MSI resistance of $582.50 rather than risk a reversal. With another 20% booked, we moved our stop to breakeven and held the final portion to see if SPY could push to $583 into the close. A late-day pop delivered just over $583, capping a one-and-done trade that produced strong returns, even after a significant overnight gap up. Once again, this success was the result of disciplined execution, a clear plan, and the precision of our model and the MSI. The MSI consistently shows who’s in control, when control shifts, and where actionable levels lie, enabling sharp entries and timely exits. Paired with a structured framework, it keeps us aligned with dominant market forces, helps avoid traps, and supports confident profit-taking. We continue to strongly recommend integrating the MSI into your trading process. Combined with a clear plan, it becomes a powerful engine for long-term performance.
Trading Strategy Based on MSI:
Tuesday brings the CPI report, which is likely to be a coin toss for markets. Momentum clearly favors the bulls, and there's little reason to consider short setups for now. CPI may shift that dynamic. Absent that information, we suggest focusing on failed breakdowns at key support levels: $580 and $575. The MSI remains in a strong bullish state, suggesting prices are likely to push higher on Tuesday, barring an external catalyst. Our model indicates that as long as $575 holds, the rally should continue. Even a drop to $570 on a weak CPI print may present a long opportunity via a failed breakdown. At this stage, long setups continue to offer better risk/reward, given the strength of the current rally. If $570 breaks, it doesn’t necessarily shift the tide to the bears. It may simply indicate they're testing the waters. The market’s reaction will be key, so stay focused on real-time developments and let the price action guide you. While the market may consolidate around the $585 level for a few sessions, two-way trading is less favorable in this environment. Instead, align with the MSI and the bulls, who currently control the narrative. Avoid trading when the MSI enters a Ranging State, and as always, stay disciplined and trade what’s in front of you. The MSI continues to deliver invaluable real-time insights into momentum and structural shifts. When combined with levels from the Premarket and Postmarket Reports, it identifies high-probability targets and clean entry points, helping traders stay on the right side of the tape and avoid costly mistakes. If you’re not yet leveraging the MSI and model levels, now is the time. Reach out to your rep as these tools can make a real difference in your trading outcomes.
Dealer Positioning Analysis
Summary of Current Dealer Positioning:
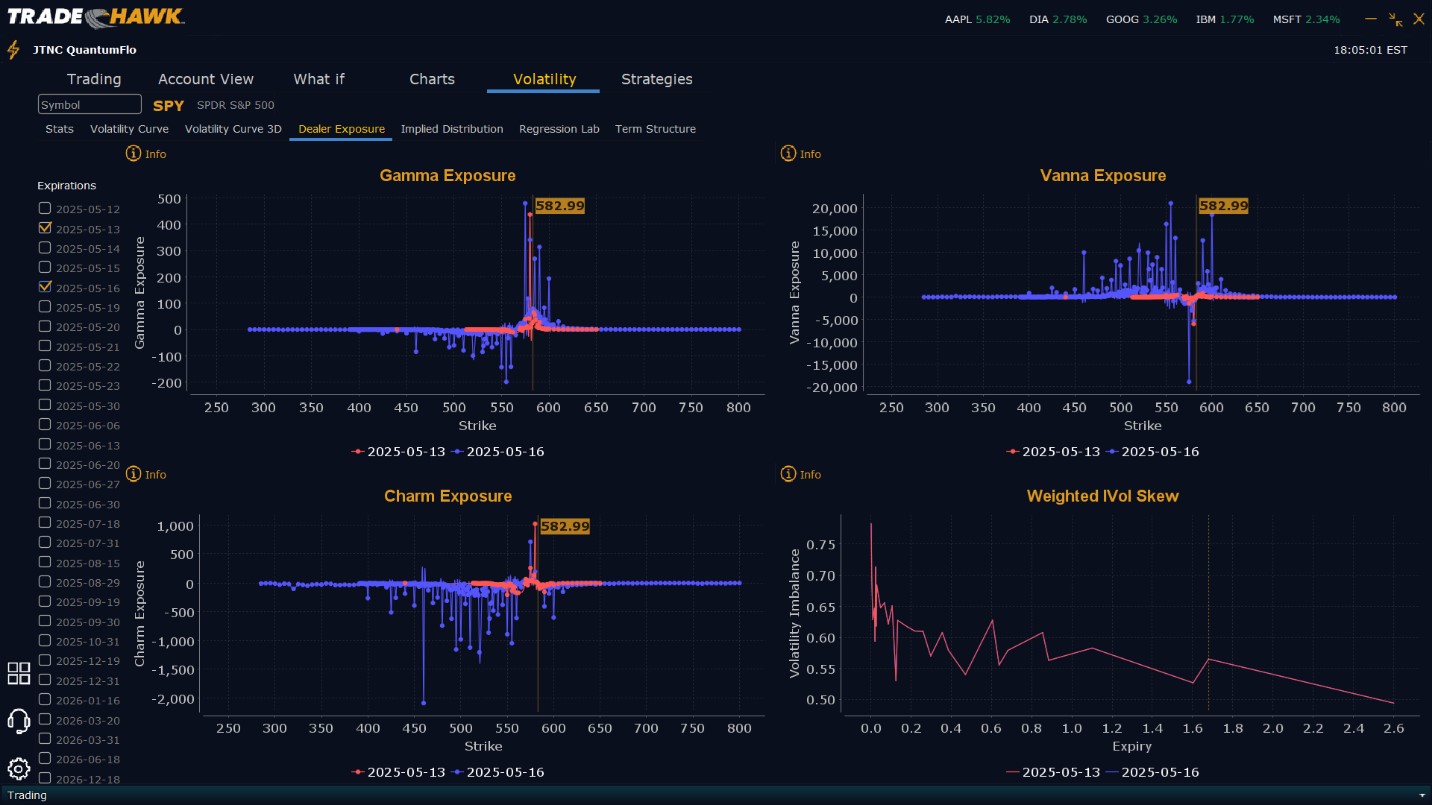
Dealers are selling $583 to $600 and higher strike Calls while also selling $570 to $583 Puts in size. This implies the Dealers belief that prices will continue to rally on Tuesday. Dealers do not sell at the money Puts without a firm belief that higher prices will follow. To the downside Dealers are buying $569 to $515 and lower strike Puts in a 1:1 ratio to the Calls/Puts they are selling, implying a bullish posture for Tuesday. Dealer positioning has changed from neutral to bullish.
Looking Ahead to Friday:
Dealers are selling $583 to $610 and higher strike Calls while also selling $575 to $582 Puts indicating the Dealer’s belief that the market is likely to continue to rally into the end of the week. As we stated above, Dealers do not sell near the money Puts without confidence that prices will move higher. Dealers also appear to believe the peak for SPY for this week is $590. To the downside, Dealers are buying $574 to $460 and lower strike Puts in a 2:1 ratio to the Calls/Puts they’re selling, reflecting a slightly neutral outlook for the week. Dealer positioning has changed from slightly bearish to neutral. We advise reviewing Dealer positioning daily for directional clues. These positions evolve quickly and tracking them is essential for staying ahead of shifting market sentiment.
Recommendation for Traders
With SPY closing just under $583 and CPI data due Tuesday, traders should watch closely for a breakout above $585, which could spark a move toward $590 or even the March highs at $597. Long trades are favored on dips to $580 or reclaiming $575 with strength, with upside targets at $585 and $590. Short setups may emerge below $575 targeting $570 and $565, but we hesitate even mentioning shorts in the current environment. Longs are favored over shorts in the near term. The VIX at 18.4 signals a more stable volatility backdrop, but this could change rapidly with tomorrow’s data. Be prepared for sharp moves and trade smaller ahead of CPI if needed. Always review the premarket analysis before 9 AM ET for updates to model levels and Dealer Positioning.
Good luck and good trading!
