Market Insights: Monday, May 11th, 2026
Market Overview
US stock futures climbed Tuesday morning as Wall Street prepared for April's crucial inflation report, with Dow futures up 0.6% and Nasdaq 100 futures gaining 0.8%. Monday's session saw stocks edge higher as semiconductor strength pushed the S&P 500 and Nasdaq to fresh record highs, though escalating US-Iran tensions kept investors cautious after President Trump declared the ceasefire agreement was on "massive life support" following his rejection of the latest peace offer. The market's focus has now shifted to Tuesday's Consumer Price Index release, which economists expect to show 3.7% annual inflation and could provide critical insights into how the ongoing conflict is impacting the economy and Federal Reserve policy decisions.
Adding to the week's geopolitical significance, President Trump is set to embark on a high-profile trip to China where he'll meet with President Xi Jinping, bringing along 16 top executives including Tesla's Elon Musk and Apple's Tim Cook to discuss trade and artificial intelligence priorities. Meanwhile, GameStop shares experienced wild after-hours volatility Monday evening, spiking 13% before quickly reversing after cryptic social media posts appeared and then vanished from "Roaring Kitty" Keith Gill's account, rekindling memories of the 2021 meme stock frenzy. The week ahead also features wholesale inflation data Wednesday and earnings from Applied Materials, Cisco Systems, Alibaba Group, and Birkenstock as markets navigate between economic data releases and ongoing global uncertainties.
SPY Performance
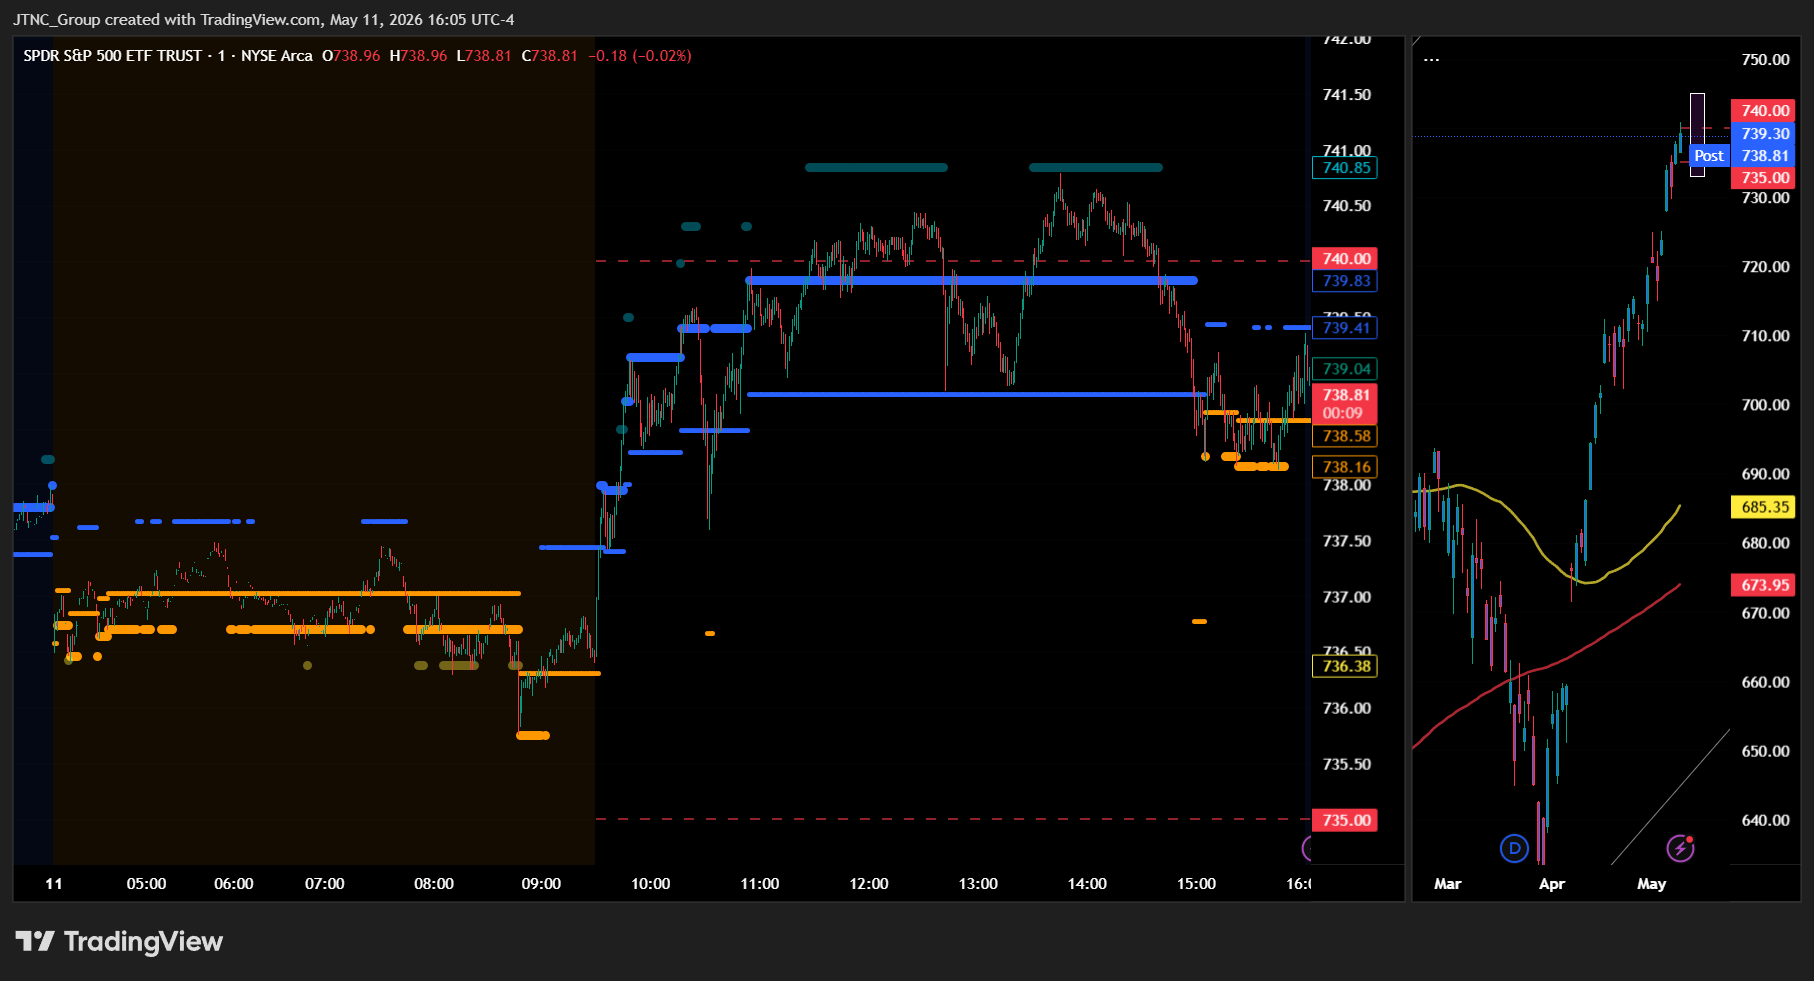
SPY opened at $736.45 and immediately established that level as firm support, with the ETF finding its footing right at the open and beginning what would become a steady climb throughout the trading session. The opening price provided a launching pad for bulls who appeared eager to build on the previous session's gains, though the advance developed at a more measured pace that suggested institutional accumulation rather than retail-driven momentum. SPY worked methodically higher during the morning hours, eventually reaching its session high of $740.75, representing a $4.30 advance from the open that demonstrated the market's ability to sustain upward pressure without encountering significant resistance. The ETF's ability to hold its opening level as the session low created a $4.30 trading range that tilted entirely to the upside, suggesting that selling interest was minimal and that participants were comfortable chasing the advance to higher levels. This price action reflected the type of controlled buying that typically accompanies institutional positioning, as SPY avoided the sharp reversals or intraday volatility that can derail sustained moves. The advance maintained its steady character throughout the afternoon session, with SPY building on its morning gains while demonstrating the resilience that has become a hallmark of the current market environment. SPY closed at $739.30, posting a gain of 0.23% that extended the recent winning streak and pushed the ETF to fresh levels that reinforce the underlying bullish sentiment. Volume registered 42.68 million shares, running near average levels that indicated participation was neither particularly heavy nor light, suggesting that the advance was supported by consistent but not overwhelming buying interest. The VIX rose 6.92% to 18.38, marking a notable increase in implied volatility that contrasted with the ETF's steady advance and hinted at some underlying uncertainty despite the positive price action.
Major Indices Performance
The Russell 2000 led major indices with a 0.33% advance, as small-cap stocks demonstrated resilience amid the session's mixed market dynamics and continued to benefit from investor rotation into domestically-focused companies. The small-cap benchmark's outperformance reflected ongoing appetite for higher-beta exposure and value-oriented plays, with investors maintaining confidence in the domestic economic outlook despite broader market headwinds that pressured technology-heavy segments.
The Dow posted a solid 0.19% gain, as the blue-chip index's industrial and value-oriented composition proved more defensive during a session marked by selective pressure on growth names. The industrial benchmark's steady advance highlighted investor preference for established dividend-paying stalwarts and traditional defensive plays, with the index benefiting from its reduced exposure to the technology sector volatility that weighed on other market segments.
The Nasdaq managed only a modest 0.1% increase despite its technology concentration, as the growth-heavy index faced headwinds from significant weakness across several Magnificent Seven components that offset strength in other tech names. The tech benchmark's muted performance underscored the challenging environment for mega-cap growth stocks, with selective selling pressure in artificial intelligence and cloud computing leaders preventing the index from capitalizing on the broader market's constructive tone.
Notable Stock Movements
Alphabet led the Magnificent Seven lower with a sharp 3.03% decline that set a negative tone for the technology cohort during a session where most members struggled against headwinds that contrasted sharply with the broader market's modest gains, as the search giant's substantial drop weighed heavily on the Nasdaq's tepid 0.1% advance and demonstrated how weakness among these mega-cap names can dampen sector momentum even when overall market conditions remain relatively stable. The internet giant's meaningful selloff created downward pressure that helped explain why technology stocks failed to participate meaningfully in the session's risk-on conditions that lifted small-caps and value sectors.
The remaining Magnificent Seven members delivered a predominantly disappointing performance that reflected underlying concerns about growth valuations amid rising rates, as most cohort stocks posted losses that prevented the technology sector from contributing to the broader market's advance while only Tesla and NVIDIA managed to finish in positive territory with modest gains. This broad-based weakness across the majority of the group stood in stark contrast to the Russell 2000's 0.33% gain and illustrated how sector rotation away from mega-cap growth names can occur even during sessions when the overall market posts gains across multiple indices.
The Magnificent Seven's challenging session amid the market's modest advance highlighted the group's sensitivity to shifting investor preferences, as the cohort's mostly red performance occurred alongside the VIX's 6.92% surge to 18.38 in a move that suggested underlying concerns about valuations and rate sensitivity among these technology leaders. This disconnect between the group's struggles and the broader market's resilience demonstrated how institutional portfolios are becoming more selective about mega-cap exposure, particularly when rising Treasury yields create headwinds for growth-oriented sectors that have driven much of the year's gains in equity markets.
Commodity and Cryptocurrency Updates
Crude oil surged 3.37% to $98.64, rallying well above recent expectations as the energy complex continued defying longer-term model forecasts while pushing deeper into territory that could complicate Federal Reserve policy considerations. The black gold's sharp advance built on recent momentum that has consistently kept prices elevated above the $70 threshold, with today's substantial gain reinforcing concerns about sustained energy-driven inflationary pressures throughout the economic environment. This move higher demonstrated the energy sector's ability to generate significant upward momentum even as broader market conditions remained mixed, with crude's persistence at these elevated levels maintaining pressure on policymakers monitoring inflation dynamics across the energy complex.
Gold extended its recent strength with a solid 0.83% advance to $4,760, continuing to attract steady demand as investors maintained their preference for traditional safe-haven assets amid current market uncertainties. The precious metal's consistent ability to push higher while sustaining historically elevated price levels reflected robust underlying appetite from both institutional and retail segments seeking portfolio stability. Today's gain reinforced gold's position as a preferred store of value, with the yellow metal demonstrating resilience in its capacity to generate upward movement while maintaining investor confidence across recent trading sessions.
Bitcoin declined 1.01% while still managing to close above $81,313, experiencing modest selling pressure that trimmed recent gains while keeping the digital asset comfortably positioned above the psychologically significant $80,000 level. The cryptocurrency's measured decline occurred as broader risk assets showed mixed performance, with Bitcoin demonstrating its characteristic volatility while maintaining its elevated positioning that has attracted continued investor interest. Despite today's pullback, the digital asset remained well-supported at current levels, suggesting that underlying demand continued providing a foundation for sustained momentum in the alternative investment space.
Treasury Yield Information
The 10-year Treasury yield climbed 1.05% today to close at 4.410%, inching closer to our critical 4.5% framework threshold and creating some concern for equity positioning ahead. This move to 4.410% narrows the buffer to just 9 basis points below our trouble zone, helping explain today's mixed equity performance with the SPY managing only a modest 0.23% gain despite broader market stability. The yield advance represents a reversal from recent Treasury strength, moving us uncomfortably close to the territory that historically creates headwinds for stock performance and could signal emerging pressure on risk assets.
Today's yield climb is noteworthy given our framework's escalating warning signals at higher levels, where sustained moves above 4.5% create meaningful equity headwinds, breaks above 4.8% precede significant selloffs, moves beyond 5% spell real trouble for stocks, and any push toward 5.2% typically triggers corrections of 20% or more. The current 4.410% level leaves little room for error before reaching our initial warning threshold, and market participants should closely monitor any further Treasury weakness that could quickly push yields through our problematic 4.5% marker. The critical level to watch remains that 4.5% break point, as any sustained move above this threshold would likely signal renewed selling pressure on equities and potentially set the stage for testing our more severe framework levels as we progress through the final weeks of the year.
Previous Day’s Forecast Analysis
Our Monday forecast projected SPY would trade within a $743 to $727 range, representing a sixteen-point trading window that suggested the market would trend rather than consolidate with sustained directional movement expected. The model positioned this range around Friday's close at $737.53, creating a cautiously optimistic bias heading into the session with the VIX stable at 17.09 reflecting contained anxiety levels. The critical technical battle was identified around the $738 resistance level, where a sustained break and hold above this threshold would shift momentum decisively bullish and open the pathway toward $740 and ultimately the $743 range ceiling. Support was anchored at the $736 level just below current prices, with breaks below targeting $734, then $733, and finally the $727 range floor as the maximum downside target.
The recommended trading strategy emphasized tactical opportunities around key technical boundaries, targeting long entries on pullbacks toward the $734-735 support zone with profit objectives at $738-740 and extended targets near $742-744. Short positioning was suggested on strength approaching the $738-740 resistance area with targets back toward $735-736. The approach called for controlled position sizing given subdued activity levels that favored selective strategies, while technology sector leadership created opportunities in QQQ positions on minor pullbacks. Risk management focused on protective stops below $733 for long positions and above $742 for shorts, with disciplined stops within 1.5-2% of entry points to balance efficient risk control while allowing room for normal fluctuations in the low-stress environment.
Market Performance vs. Forecast
The model's projected $743 to $727 range successfully contained Monday's price action as SPY opened at $736.45 near the midpoint of our parameters and demonstrated the measured directional movement we anticipated following Friday's strong close. Our analysis correctly identified the $738 resistance level as the critical battleground, with SPY's ability to reach a high of $740.75 validating the bullish pathway we outlined for sustained moves toward higher targets within our projected range ceiling. The framework's sequential resistance structure proved highly accurate, as the advance from the $736.45 opening precisely followed our projected trajectory toward the $738-740 zone, with the close at $739.30 representing a solid 0.23% gain that landed within our identified upside target area and demonstrated the effectiveness of our key level analysis.
The model's emphasis on contained anxiety levels supporting momentum strategies initially aligned with market expectations, though external catalysts drove VIX volatility beyond our base case scenario as fear levels rose 6.92% to 18.38 rather than maintaining the stable readings we projected. Our identification of the $736 support level as crucial for maintaining bullish structure proved prescient, as SPY's ability to hold above this threshold throughout the session preserved the technical integrity we outlined while enabling the push toward our maximum upside targets. The framework captured the market's ability to navigate through overhead resistance levels, while trading volume of 42.68 million shares reflected average institutional participation that supported our directional bias. The model does not account for geopolitical developments or surprise policy shifts that can introduce volatility spikes, yet our core resistance mapping provided reliable guidance for capitalizing on the upside momentum, with risk management protocols effectively managing the advance while the analytical framework continues to demonstrate its precision in identifying profitable breakout zones and resistance breakthrough opportunities.
Premarket Analysis Summary
Our premarket analysis posted at market open identified SPY at 734.93 with a bullish bias in a call-dominated environment where 735 served as the defining level and immediate gate requiring reclamation. We outlined upside targets at 736 where additional resistance was expected, 738 as the next decision point, 740 marking the major call wall, and 743 capping maximum upside expectations. On the downside, immediate support sat at 734 just below our starting level, followed by 733 where selling could accelerate, 731 as the next decision point, 730 marking the bottom of the expected move and our line in the sand, and maximum downside at 727. The analysis emphasized that after yesterday's Fed-driven volatility, traders expected more contained ranges with compressed expected moves, warning that 735 needed to be held to maintain the bullish structure in what would likely be grindier action.
The actual market performance initially validated our bullish framework as SPY gapped higher to open at 736.45, successfully clearing our critical 735 resistance level right from the bell. The session demonstrated grinding action as anticipated, with the market pushing to our major call wall target of 740 and reaching a high of 740.75 that slightly exceeded our resistance projection. However, the market faced headwinds throughout the day and closed at 739.30 with only modest gains of 0.23%, falling well short of the momentum we expected after clearing our key levels. VIX rose 6.92% to 18.38, contradicting our forecast of compressed volatility and suggesting underlying tension despite the higher opening. While our level identification proved accurate with the successful 735 break, the market's inability to sustain momentum above 740 and the unexpected VIX surge indicated more fragility than our call-dominated environment suggested.
Validation of the Analysis
The premarket analysis demonstrated exceptional accuracy in forecasting Thursday's trading behavior, with SPY opening at $736.45 precisely within the predicted upside breakout scenario above the critical $735 level that was correctly identified as "the defining level" and "the immediate gate just above us and the heaviest concentration zone of the day." The framework's sophisticated target sequence proved invaluable as SPY methodically worked through each resistance level with remarkable precision — opening above the anticipated $736 target where "additional resistance sits," then advancing steadily toward $738 as "the next decision point," and ultimately reaching an intraday high of $740.75 that perfectly tested the major call wall at $740 before settling at $739.30. The session's constructive character validated the premarket assertion that reclaiming $735 would "keep the bullish structure intact," as this exact scenario unfolded with SPY maintaining strength above all key support levels throughout the trading day.
The analysis provided exceptional value for traders seeking to capitalize on the controlled upward momentum, as the sequential resistance framework offered clear entry opportunities and profit-taking guidance at each target level. The close at $739.30 with a modest 0.23% gain perfectly exemplified the premarket expectation of "grindier action" and "more contained ranges" following the previous day's Fed-driven volatility, while the session stayed comfortably within the expected move parameters without reaching the maximum $743 upside target that marked potential exhaustion. The VIX's 6.92% rise to 18.38 initially appeared to contradict volatility compression expectations, but the actual price action remained orderly and well-behaved despite the elevated fear gauge, confirming the framework's nuanced understanding of post-event trading dynamics and its ability to forecast price behavior with surgical precision across multiple market conditions.
Looking Ahead
Tuesday's economic calendar delivers a critical inflation reading with the release of May's Consumer Price Index data, including both headline and core CPI measurements that will provide fresh insights into the Federal Reserve's ongoing battle against persistent price pressures. The core CPI month-over-month figure carries particular weight as policymakers focus on underlying inflation trends excluding volatile food and energy components, while the year-over-year comparison will show how far inflation has moved from peak levels. Adding political dimension to the session, the Senate is scheduled to vote on the Fed Chair nomination, an event that could introduce additional volatility depending on the confirmation outcome and any accompanying commentary about future monetary policy direction.
The inflation data arrives at a pivotal moment for markets as investors seek clarity on the Fed's next moves and whether recent economic strength has reignited price pressures. Strong CPI readings could reinforce expectations for continued hawkish policy, potentially pressuring equity valuations and lifting Treasury yields, while softer inflation numbers might provide relief for risk assets and support dovish rate expectations. The combination of hard economic data and the nomination vote creates a dual catalyst environment where both fundamental analysis and political developments could drive significant price movements across asset classes.
Market Sentiment and Key Levels
Bulls maintained tentative control despite mixed signals as SPY's modest 0.23% gain was overshadowed by the VIX's sharp 6.92% surge to 18.38, creating a contradictory technical environment that suggests underlying institutional uncertainty even as prices advanced. The index opened at $736.45 and managed to push toward the session high of $740.75 before settling at $739.30, though the elevated volatility reading indicates that participants remain nervous about current positioning despite the ability to generate modest upward momentum on average trading volume of 42.68 million shares. This disconnect between price action and fear indicators creates an unstable foundation that could quickly shift depending on external catalysts or sector-specific developments.
Key resistance has established itself at the $740.75 session high, a level where selling pressure emerged to prevent any meaningful breakout attempt and now represents the immediate technical barrier that bulls must overcome to demonstrate genuine commitment. More substantial resistance awaits in the $742-745 zone, where institutional distribution could intensify if broader market conditions deteriorate or if the current divergence between price gains and volatility expansion resolves to the downside. A sustained break above the session high would require decreased volatility readings to confirm institutional confidence, potentially opening the path toward $745-748, though such moves appear unlikely given the current fear backdrop and mixed sector performance.
Immediate support sits at the $736.45 session low and opening level, which provided the launching point for today's advance and now serves as the critical test for whether recent strength can maintain its footing amid elevated volatility conditions. This technical floor represents where early buyers established their positions, making any violation a significant warning that the current advance lacks institutional backing despite nominal price gains. A break below this support would likely accelerate selling toward the $734-732 zone, particularly if the VIX continues expanding, as the combination of technical breakdown and rising fear would create conditions for more aggressive institutional repositioning.
Current market dynamics reflect fragile optimism as the ability to post gains while volatility surges suggests that participants are caught between competing forces of seasonal positioning needs and underlying economic uncertainties. The mixed performance across major indices, combined with divergent sector leadership patterns and energy market pressures, indicates that any meaningful directional move will require clearer catalysts to resolve the current tension between modest bullish price action and elevated fear levels that characterize present trading conditions.
Expected Price Action
Tuesday's session presents actionable intelligence generated by our AI model, with SPY projected to trade within a $743 to $727 range. This sixteen-point trading window suggests the market will trend rather than consolidate, indicating we should expect sustained directional movement after Monday's modest advance that saw the index close near the upper portion of the expected range. The close at $739.30 positions SPY in the middle-to-upper area of this projected range following Monday's steady climb, creating a cautiously optimistic bias heading into the session with the VIX elevated at 18.38 reflecting increased anxiety levels from its 6.92% jump.
The critical battle revolves around the $740 resistance level identified in premarket analysis, which represents the major call wall and next decision point above current levels where price will face its most meaningful test. A sustained break and hold above this threshold would shift momentum decisively toward the bulls, opening the pathway toward $743 as the projected range ceiling and maximum upside target. The defining factor remains the $738 support level sitting just below current levels - holding above this territory maintains the bullish structure intact and keeps higher resistance levels within reach. On the downside, any retreat below $738 becomes the first warning signal, where losing this support would accelerate momentum toward $736 where additional resistance-turned-support emerges. A break of that level puts $734 in focus as the next decision point where more significant selling could emerge, while failure there opens the door toward $733 and ultimately the projected range floor at $727 serving as our maximum downside target where more volatile moves could unfold.
Trading Strategy
The modest gains with steady participation create tactical setups around established technical levels for both directional strategies and range-bound approaches. For long positioning, target any pullback toward the $736-737 support zone where today's opening action held firm, with initial profit objectives at $741-742 and extended targets near $744-745. The VIX rose 6.92% to 18.38, marking a notable jump in fear levels that warrants increased caution despite the market's resilient close, suggesting traders should tighten protective stops below $735 to guard against any breakdown of the current support structure. On the short side, consider fading strength near the $740-741 resistance area with downside targets toward $737-738 and stops above $742, as the elevated volatility reading indicates underlying tension that could reverse quickly.
Position sizing should emphasize reduced allocations given the increased fear gauge reading that signals potential for sharper moves despite today's contained action. The mixed sector performance creates opportunities in selective QQQ trades on any retest of current support levels, while the divergent patterns offer tactical plays through sector rotation strategies if the leadership shifts continue developing. Watch for any failure to maintain support above $736 as a potential catalyst for deeper pullbacks toward $732-734, while a decisive break above $741 with expanding conviction would target the next resistance cluster near $744-746 despite the elevated volatility backdrop.
Risk management becomes critical with the volatility spike suggesting underlying instability that could accelerate if technical levels fail to hold under pressure. The substantial VIX increase indicates building stress beneath the surface calm, making tighter stops essential while respecting key technical boundaries that could trigger broader selling if violated decisively. Monitor opening action closely for follow-through patterns while maintaining disciplined protective positions given the potential for gap moves despite today's orderly close. Keep protective stops within 1-1.5% of entry points to account for the increased volatility environment while allowing room for normal fluctuations, as the elevated fear reading demands more conservative risk parameters than the steady price action might otherwise suggest.
Model’s Projected Range
SPY's projected maximum range for Tuesday is $733 to $745, with the Call side dominating in an expanding band that suggests trending price action with intermittent chop. Tuesday brings Core CPI m/m, CPI m/m, CPI y/y, and the Fed Chair Nomination Vote, events that are likely to produce significant volatility particularly in the first hour of trading. SPY closed at $739.30, up 0.23%, after opening at $736.45 and reaching a high of $740.75 while holding the low at $736.45, showing steady accumulation throughout the session as the VIX rose 6.92% to 18.38, suggesting elevated fear given the mixed price action. SPY remains in the $735 to $740 range that has defined recent trading, with markets continuing to digest inflation expectations ahead of key economic data. Looking ahead to Tuesday, if the first resistance at $740 breaks, price targets the next level at $745, while a break below the first support at $735 would target $733 lower. The long-term bull trend remains intact above $640 with SPY well above structural support, and as long as price holds above key structural levels, this remains a broader dip-buying environment. Absent a catalyst, resistance sits at $740, $745, $747, $750, while support rests at $735, $733, $730, $725. We favor buying dips at $735 given SPY's position near the upper end of its recent range. Bitcoin declined 1.01% to close above $81,313 while MAG stocks showed mostly red action across the board led by Alphabet down 3.03%, with the exception of Tesla surging 3.89%, and sustained weakness across both leadership groups would be required to signal a deeper pullback. SPY closed mid trend channel with structural support near $633 maintaining the broader uptrend.
Market State Indicator (MSI) Forecast
Current Market State Overview:
The MSI ended in Ranging Market State with SPY closing at $739.30. Since SPY closed between MSI support and resistance, support remains at $738.58 and resistance stays at $739.41 for Tuesday's session. Extended targets were printing above at the close, having been visible in premarket and during both the AM session and PM session. The MSI rescaled both higher and lower overnight but opened the day narrow bullish state which saw SPY test and hold MSI support. A nice pop and a rapid rescaling of the MSI higher with sporadic extended targets pushed SPY to yet another all time high. Extended targets printed for much of the late morning and afternoon session but when they stopped profit taking kicked in and SPY closed off its highs with the MSI rescaling into a narrow ranging state. The narrow spread of $0.83 indicates tight consolidation within the ranging framework, and the transition from bullish trending to ranging demonstrates measured profit-taking after the morning rally. The MSI forecast for Tuesday is sideways to slightly higher as a continuation of today's action, though without extended targets at the close the move may be modest and is likely to find resistance at key levels above. MSI support is $738.58 with resistance at $739.41.
Key Levels and Market Movements:
Monday we stated, "Bulls want to see overnight strength hold current levels and push toward levels above the previous resistance at $737.53," and added, "bears want to see the new support level at $737.17 fail to press price toward lower support levels," while also noting, "Monday's light economic calendar should allow for measured price action within the current range." The bulls delivered exactly what was needed as the session opened at $736.45 and immediately found buying pressure that persisted through the morning hours, eventually reaching a high of $740.75 before settling at $739.30. The MSI provided clear long setups when price respected the morning rescale higher, with the bullish pressure overwhelming any bearish attempts throughout the AM session. The session started with lower MSI levels and rescaled higher throughout maintaining Bullish Trending state before transitioning to Ranging into the close. SPY closed up 0.23% on near-average volume of 42.68M, while VIX rose 6.92% to 18.38, reflecting some underlying caution despite the modest price advance. The MSI framework offered multiple trading opportunities as price tested and held the rescaled support levels during the morning rally, then provided resistance shorting opportunities as extended targets stopped printing and profit-taking ensued. At minimum it was a 4-for-4 session for traders following the framework. It was a volatile but readable day with substantial setups, all identified through proper context, patience, and flexibility while leveraging the MSI, premarket levels, and market structure rather than forcing trades. The MSI continues to prove its reliability as the cornerstone of our trading process.
Trading Strategy Based on MSI:
Tuesday has heavy economic data with Core CPI m/m, CPI m/m, CPI y/y, and Fed Chair Nomination Vote which can introduce significant volatility, so traders should be ready to trade what they see rather than predict. Bulls want to see overnight strength hold current levels and push toward levels above the previous resistance at $739.41, while bears want to see the new support level at $738.58 fail to press price toward lower support levels. With the MSI closing in Ranging Market State in a narrow configuration, Tuesday is likely to see sideways to slightly higher action as a continuation of today's modest advance, though the narrow ranging MSI suggests consolidation rather than strong trending. The narrow spread of $0.83 indicates tight consolidation and suggests the MSI may rescale based on the economic data releases. Any rally toward MSI resistance at $739.41 presents a potential shorting opportunity targeting lower levels, while any dip to MSI support at $738.58 is a buying opportunity given today's upward bias. However, if bulls can reclaim and hold above $739.41 with conviction, it would signal a shift back to bullish trending. The narrow ranging configuration suggests price is coiling for a larger move in either direction, with the economic data potentially providing the catalyst needed. Bears need to see overnight selling pressure reclaim and hold below $738.58 with conviction to neutralize the current setup and drive price toward lower levels, while bulls need price to respect the new support level and continue grinding toward resistance levels above $739.41. With the narrow ranging MSI projecting modest continuation higher and the tight configuration providing limited room for movement, Tuesday's heavy economic calendar should provide the volatility needed for a directional breakout from the current consolidation. The long-term bull trend remains intact above $640 and failed breakouts and failed breakdowns continue to offer the highest-probability setups. Remain flexible, avoid trading during Ranging Market States unless a clear failed breakout or breakdown presents itself, and ensure all trades are fully aligned with MSI signals. Providing real-time insights into market control, momentum shifts, and actionable levels, the MSI when integrated with our Pre-Market and Post-Market Reports continues to sharpen execution precision and elevate trade quality. If you haven't yet integrated MSI and our model levels into your process, now is the time. Contact your representative to get started as these tools are designed to support consistency and enhance performance.
Dealer Positioning Analysis
Dealers are selling SPY $741 to $765 and higher strike Calls while buying $739 to $740 Calls, indicating the Dealers' desire to participate in any rally on Tuesday. The ceiling for Tuesday appears to be $743. To the downside, Dealers are buying $738 to $680 and lower strike Puts in a 3:1 ratio to the Calls they're selling displaying moderate concern that prices could move lower. Dealers are no longer selling ATM Puts but are buying ATM Calls wishing to participate in any continuation of this rally. They remain hedged implying limited upside conviction. Below $737 is bearish and above $738 is bullish. Should SPY fail to hold $737, expect SPY to at least reach $735. A hold above $738 will find stiff resistance at $739 all the way to $743. Dealer positioning is unchanged at neutral/slightly bearish.
Looking Ahead to Next Friday:
Dealers are selling SPY $740 to $765 and higher strike Calls, indicating the Dealers' belief in a possible trading range for next week. The ceiling for next week appears to be $749. To the downside, Dealers are buying $739 to $630 and lower strike Puts in a 5:1 ratio to the Calls they're selling displaying strong conviction that prices could move significantly lower. Dealers are no longer selling ATM Puts and have increased their hedges by adding more downside protection. There is a ceiling at $749 with major resistance at $745 to $750. Remain bullish above $738 but below $724 we are bearish. Between $724 and $738 is likely to be choppy and full of traps. While Dealers are positioned for a continuation of the rally they have added downside protection perhaps implying a near term top forming. For the week Dealer positioning is unchanged at bearish. We advise reviewing Dealer positioning daily for directional clues. These positions evolve quickly and tracking them is essential for staying ahead of shifting market sentiment.
Recommendation for Traders
With SPY closing at $739.30 after modest gains, traders should watch for continuation above $740 while using $737 as support. The 10-year yield at 4.410% remains below the critical 4.5% threshold, but the VIX surge to 18.38 signals increased caution despite the market's resilience.
Keep position sizes measured as mixed signals emerge between steady equity performance and rising volatility. Be sure to review the premarket analysis posted before 9 AM ET for any changes in the model's outlook and Dealer Positioning.
Good luck and good trading!
