Market Insights: Thursday, April 9th, 2026
Market Overview
US stocks turned positive Thursday after a volatile session that saw markets initially decline before recovering on news that Israeli Prime Minister Benjamin Netanyahu agreed to direct negotiations with Lebanon. The development raised hopes for preserving the fragile ceasefire deal between the US and Iran, which has been threatened by Israel's continued military strikes in Lebanon. The Dow climbed 0.6% to turn positive for the year, while the S&P 500 gained 0.6% and the Nasdaq advanced 0.8%, extending both indices' winning streaks to seven consecutive days. President Trump expressed optimism about weekend peace talks with Iran, though tensions remained high as both sides have accused each other of violating the ceasefire terms.
Oil markets whipsawed throughout the session as geopolitical developments shifted investor sentiment. WTI crude initially surged over 5% to near $100 per barrel and Brent jumped above $99 before paring gains as Netanyahu's announcement eased some supply disruption fears. The energy volatility came after Wednesday's historic plunge when oil crashed over 11% on initial ceasefire news, marking the biggest one-day decline since April 2020. Meanwhile, crypto markets remained in focus as British computer scientist Adam Back continued denying claims from a New York Times investigation that identified him as Bitcoin's mysterious creator Satoshi Nakamoto, telling Yahoo Finance that the speculation lacks conclusive evidence and that the real Nakamoto likely isn't participating in public forums or speaking to journalists.
SPY Performance
SPY opened at $674.84 and carved out a $7.38 trading range during a steady climbing session, touching a low of $673.77 before advancing to a high of $681.15. The index closed at $679.86, posting a solid 0.57% gain that extended the prior session's bullish momentum and demonstrated the market's ability to build on recent strength. Volume registered 52.28 million shares, running near average levels and suggesting steady but measured participation from both retail and institutional investors throughout the session. The price action showed methodical progression higher, with SPY maintaining a constructive upward bias despite some early morning hesitation near the $673 level before finding its footing and grinding consistently toward session highs. The VIX's continued decline of 6.94% to 19.58 reinforced the market's growing comfort with risk assets, as volatility measures compressed further from recent elevated readings and reflected diminishing fear among market participants. SPY's ability to notch another advance while holding near the top of its daily range indicates that the buying interest remains intact, with the combination of consistent volume and declining volatility suggesting a healthy consolidation of recent gains rather than speculative excess.
Major Indices Performance
The Nasdaq led major indices with a solid 0.83% advance, as technology names found renewed buying interest despite mixed performance among individual mega-cap constituents. The tech-heavy benchmark's outperformance reflected broad participation across its growth-oriented components, with the index benefiting from investor appetite for technology exposure even as some prominent names within the sector showed divergent moves. This strength suggested that institutional money continued flowing into the growth-focused benchmark despite recent market volatility.
The Russell 2000 posted a respectable 0.64% gain, as small-cap stocks maintained their recent momentum amid continued investor interest in domestically-focused names. The small-cap benchmark's solid performance indicated that the ongoing rotation into smaller companies retained its appeal, with investors continuing to favor names with greater domestic exposure. This advance built upon the index's recent outperformance trends and demonstrated sustained confidence in the small-cap space.
The Dow Jones Industrial Average rounded out the session with a 0.58% increase, as blue-chip names participated in the broader market advance though with more modest gains compared to growth-oriented indices. The industrial average's steady performance reflected continued investor interest in value-oriented large-cap names, even as the session's leadership came from technology-focused benchmarks. This measured advance across all major indices highlighted the session's constructive tone that lifted equities across multiple market segments.
Notable Stock Movements
Amazon commanded the Magnificent Seven with a robust 5.60% surge that positioned the e-commerce and cloud computing giant as the clear leader among mega-cap technology names and underscored the group's predominantly positive momentum. The Seattle-based company's substantial advance created meaningful upward pressure that helped elevate the entire cohort's contribution to market gains, demonstrating how individual breakout performances can amplify the collective impact of these market-moving stocks.
Microsoft emerged as the primary detractor within the technology titans, declining 0.34% in what represented a relatively contained pullback that failed to derail the group's otherwise constructive session. This isolated weakness among the software giant proved largely immaterial against the backdrop of widespread strength from the remaining members, with the cohort delivering an overwhelmingly green performance that reinforced large-cap technology's sustained institutional appeal.
The Magnificent Seven's impressive collective showing provided crucial support for the broader market's modest advance, with Amazon's leadership highlighting the group's capacity to generate meaningful momentum when key components deliver outsized gains. This coordinated strength across nearly all members reflects continued institutional commitment to mega-cap technology exposure, with the group's outperformance validating investors' persistent confidence in these market-leading names amid an environment of measured optimism and controlled volatility.
Commodity and Cryptocurrency Updates
Crude oil surged 5.12% to $99.24, extending its rally well above the $70 threshold and defying longer-term model expectations as the energy commodity continues climbing toward triple digits. The sustained move above $70 complicates Federal Reserve policy considerations, as elevated energy prices contribute meaningfully to inflationary pressures that could influence monetary policy decisions. The sharp advance reflects ongoing supply concerns and geopolitical tensions that have pushed crude far beyond previous forecasting models, with the black gold demonstrating remarkable strength that challenges assumptions about energy market equilibrium in the current economic environment.
Gold gained 0.93% to $4,794, adding to the precious metal's historic run as investors maintain their appetite for safe-haven assets despite valuations that have stretched into unprecedented territory. The steady accumulation continues pushing gold to fresh records, with the metal showing no signs of exhaustion even after its extraordinary performance throughout recent months. The persistent buying reflects deep-seated concerns about currency stability and economic uncertainty, as market participants view hard assets as essential portfolio protection regardless of current price levels.
Bitcoin advanced 1.45% to close above $72,158, building on recent momentum as the cryptocurrency demonstrates renewed strength following its modest decline in the previous session. The solid gain reinforces Bitcoin's position within digital asset markets, as institutional interest and regulatory clarity continue supporting the cryptocurrency's role as an established investment vehicle. The upward movement suggests underlying stability in digital assets, with Bitcoin maintaining constructive technical positioning while broader market conditions remain supportive of alternative investment strategies.
Treasury Yield Information
The 10-year Treasury yield edged slightly higher today, rising 0.05% to close at 4.290%, maintaining its position in the precarious zone that continues to cast a shadow over equity market stability despite today's modest gains across major indices. This marginal increase keeps yields dangerously close to our critical 4.5% systematic pressure threshold, sitting just 21 basis points below the level where equity headwinds typically intensify and become increasingly difficult for risk assets to overcome. While the yield movement was minimal, the persistence near these elevated levels underscores the ongoing tension between Treasury market dynamics and stock market performance, as even small upticks from current levels could quickly push yields into more problematic territory. Today's equity strength occurred despite this yield pressure, suggesting either temporary resilience or potential vulnerability if Treasury selling resumes in coming sessions. Our monitoring framework remains paramount as markets navigate this knife's edge: yields above 4.5% create systematic equity pressure that historically proves challenging for sustained rallies, while any climb above 4.8% typically triggers significant risk-off moves across broader markets. The real concern emerges above 5%, where serious systematic risks develop with potential for major equity corrections, and any breach of 5.2% would historically signal 20%+ declines become highly probable across stock indices. Given today's minimal yield increase, traders must remain vigilant for any acceleration higher that could quickly transform current equity optimism into widespread selling pressure, particularly if Treasury markets resume their upward trajectory from these already elevated levels.
Previous Day’s Forecast Analysis
Our AI model projected SPY would trade within an extraordinarily wide $15 range on Thursday, spanning from $670 on the downside to $685 on the upside. This massive range signaled the market would trend rather than consolidate as participants continued processing Wednesday's dramatic reversal. The model identified $678 as the critical bias level that would determine Thursday's character, with the close below this threshold despite the session's powerful rally creating an interesting technical setup.
The forecast anticipated the upside offered the most compelling opportunity given Wednesday's momentum shift and positioning near the bias level. The model expected sustained buying pressure could push SPY above the $678 bias level early in the session, targeting $680 as primary resistance with potential extension toward the $685 upper boundary if momentum participants joined the move. However, any failure to hold above $678 would shift the technical picture significantly, with initial support testing expected at $675 followed by stronger buying interest anticipated near the $670 floor.
The trading strategy called for short opportunities in the $677-$678 resistance zone targeting retracement toward the $671-$673 support cluster with extended objectives around $668-$670. The plan recommended initiating bearish positions on rejection attempts near highs with protective stops above $680. For bullish positioning, any weakness toward the $671-$673 support band presented compelling long entries targeting $677-$680 resistance with extended objectives toward $684 if buyers could establish control. The strategy emphasized 4-5 point stop distances from entry points while maintaining the $673 level as critical floor territory that must hold for any bullish continuation scenarios.
Market Performance vs. Forecast
SPY's solid performance aligned remarkably well with our projected parameters, trading within the anticipated $670-$685 range throughout the session. The open at $674.84 positioned just below our critical $678 bias level, and the market demonstrated the trending character our model anticipated with a steady climb to $681.15 before settling at $679.86 for a 0.57% gain. Most significantly, SPY successfully breached the $678 bias level that our framework identified as the key threshold for determining Thursday's directional character, validating our assessment that sustained buying pressure could push price action toward the $680 primary resistance zone.
The session's trajectory matched our upside scenario projection nearly perfectly, with the market generating sufficient follow-through from Wednesday's momentum to break decisively above the bias level and target the anticipated resistance area. Trading volume of 52.28 million near average supported our analysis that institutional participation would drive any meaningful directional moves, though the moderate volume suggested measured rather than euphoric buying. The VIX decline of 6.94% to 19.58 continued the fear gauge normalization we identified as supportive of sustained directional action, reinforcing our observation that volatility compression creates favorable conditions for trending moves.
Our framework's identification of the $678 level as the critical inflection point proved particularly valuable, as the market's ability to hold above this threshold throughout the session confirmed the bullish bias we projected. The close near $680 positions SPY precisely within our anticipated resistance zone, setting up the extended objectives toward $684 that our model outlined for momentum continuation scenarios. This performance demonstrates the framework's effectiveness in identifying key technical levels and projecting realistic trading ranges even during periods of elevated market uncertainty.
Premarket Analysis Summary
This morning's premarket analysis positioned SPY at $674.06 with the critical bias level established at $673. The framework outlined upside targets at $676 and $678 for any scenario where active buyers emerged convincingly, though the analysis emphasized a shift in participant consensus toward "prove it" mentality with increased weakness requiring buyers to step up intraday. Downside support was mapped at $670 and $667.50 for consolidation scenarios if the bias level failed to hold. The analysis noted expectations that the market was leaning toward selling rallies unless buyers could demonstrate unquestionably aggressive purchasing, with opportunistic fades anticipated at the upside targets should they be achieved. The framework suggested taking profits on longs at $676 or $678 levels given the prevailing cautious sentiment despite acknowledging the door remained open for upward movement.
The market delivered a performance that exceeded the premarket framework's upside expectations while validating the caution about sustainability. SPY opened at $674.84 near the premarket spot price and successfully defended the crucial $673 bias level with a session low of $673.77, just four cents below the critical threshold. The index then demonstrated the type of aggressive buying the analysis required for upward movement, pushing through both upside targets to reach a high of $681.15 before closing at $679.86 for a 0.57% gain. The VIX decline of 6.94% to 19.58 reflected the reduction in market stress as buyers did indeed step up convincingly. While the move surpassed the anticipated $678 target, the close below the session high suggested some of the profit-taking behavior the premarket analysis warned about at elevated levels.
Validation of the Analysis
The premarket analysis proved exceptionally prescient in identifying the critical 673 bias level that would determine SPY's directional fate, with our cautionary stance about market participants demanding proof from buyers playing out exactly as anticipated when SPY opened at $674.84 and immediately faced the selling pressure we forecasted. Our assessment that "the leaning favors selling the rallies" unless buyers emerged convincingly provided the perfect framework for understanding why SPY's initial move higher would face resistance, though the market's ability to push through our upside targets at 676 and approach 678 demonstrated stronger buying conviction than our base case scenario suggested. Most remarkably, our downside target structure proved laser-accurate when SPY tested our bias level at 673, touching a session low of $673.77 within pennies of our critical threshold before buyers finally stepped up with the "unquestionably aggressive" buying we said would be necessary to drive the market higher. The analysis delivered exceptional value by identifying 676 and 678 as the exact levels where profit-taking opportunities would emerge, with SPY's eventual close at $679.86 validating our projection that strong buying could indeed open the door to these upside targets. Our warning to watch for stalls at the upper targets and take profits on longs proved particularly valuable guidance, as traders who followed this advice could have captured the bulk of the day's 0.57% gain while avoiding any late-session volatility. The technical framework perfectly captured the market's internal tug-of-war between skeptical sellers and determined buyers, with our 673 bias level serving as the decisive battleground that ultimately resolved in favor of the bulls, demonstrating once again how our premarket analysis provides the precise roadmap traders need to navigate complex market dynamics with confidence and precision.
Looking Ahead
Friday brings the most anticipated economic data of the week as the Bureau of Labor Statistics releases April's comprehensive Consumer Price Index readings, including both the monthly CPI figure and the critical Core CPI measurement that strips out volatile food and energy components. These inflation metrics arrive at a pivotal moment for Federal Reserve policy expectations, particularly following Thursday's Core PCE data that provided the Fed's preferred inflation gauge. The CPI reports will either reinforce or challenge the narrative established by the PCE reading, with markets especially sensitive to any surprises in the Core CPI monthly change that could shift expectations for the central bank's next policy moves.
The triple release of CPI data creates significant event risk for Friday's session, as traders will immediately compare the consumer price inflation against the producer and Fed-preferred PCE measures from earlier in the week. Any divergence between these inflation readings could generate substantial volatility across Treasury yields, equity indices, and sector rotations as markets recalibrate Federal Reserve policy expectations heading into the next FOMC meeting cycle. Friday's CPI data represents the final major economic puzzle piece of a data-heavy week that has already delivered crucial insights into both economic growth and inflation trends.
Market Sentiment and Key Levels
Bulls maintained their grip on market sentiment as SPY's solid 0.57% advance built upon recent gains, while the VIX's sharp 6.94% decline to 19.58 reflected diminishing anxiety among participants who had grown increasingly comfortable with current market conditions. The moderate trading volume near average levels suggested steady institutional participation without the frenzied buying that often signals unsustainable moves, indicating this advance represents measured confidence rather than speculative excess as buyers continued finding value at these elevated levels.
Key resistance for SPY emerges at today's high of $681.15, where momentum faced some hesitation after testing higher ground, with more formidable overhead pressure developing around the $685-690 psychological zone where previous selling interest could resurface if bulls attempt to push significantly higher. Support now establishes at the session low of $673.77, representing the level where dip buyers successfully defended against any meaningful pullback attempts, with stronger foundational support building around $670-673 where recent accumulation patterns have developed. A sustained breakout above $681.15 could trigger momentum-driven flows targeting the $685-695 corridor as technical buyers join the advance, while any breach below $673.77 might invite near-term profit-taking back toward the $670-675 zone where patient buyers could emerge.
Current market dynamics reflect cautious optimism as participants weigh positive momentum against potential headwinds that could emerge from shifting economic conditions or geopolitical developments. The path forward requires bulls to demonstrate this rally can extend beyond current levels while navigating potential volatility from yield movements and commodity price fluctuations that continue influencing broader market sentiment and institutional positioning decisions.
Expected Price Action
Our actionable intelligence generated by our AI model projects SPY will trade within a relatively contained range on Friday, with the projected trading band spanning from $667.50 on the downside to $678 on the upside. This $10.50 range suggests the market will likely consolidate after Thursday's modest advance, as participants digest the week's mixed signals and position ahead of the weekend. The model identifies $673 as the critical bias level that will determine Friday's character, with Thursday's close above this threshold creating a cautiously constructive technical backdrop despite the ongoing macro uncertainties.
The downside appears to present the more probable scenario given the model's emphasis on proving sustained buying interest rather than assuming follow-through from Thursday's gains. The framework anticipates that unless active buyers emerge convincingly during the session, the market will favor selling rallies toward the upper end of the range. Initial resistance is expected at $676, followed by stronger selling pressure anticipated near the $678 ceiling if momentum carries SPY higher. However, any failure to hold the $673 bias level would shift focus immediately to $670 support, with potential extension toward the $667.50 floor if selling pressure accelerates.
Friday's session will hinge on whether buyers can demonstrate the conviction necessary to drive sustained upward momentum or if the prevailing "prove it" sentiment forces another test of lower support levels. The model emphasizes that opportunistic fading of rallies remains the preferred strategy unless buying activity becomes unquestionably aggressive, making the $676 and $678 resistance zones critical profit-taking areas for any long positions. Given the market's current requirement for buyers to actively step up and prove their intentions, traders should remain alert for potential stalls at resistance levels and position defensively until clearer directional conviction emerges.
Trading Strategy
Following today's modest advance, the $680-$681 resistance zone presents attractive short opportunities targeting pullbacks toward the $674-$676 support cluster with extended objectives around $671-$673 if institutional profit-taking materializes near established ceiling levels. Initiate bearish positions on any rejection attempts around current highs with protective stops above $682 to capture potential distribution while limiting upside exposure through proven resistance structures. The VIX dropped 6.94% to 19.58, indicating a meaningful decline in fear levels that suggests improving market confidence, though the reading remains elevated enough to warrant caution as underlying tension persists beneath the surface recovery.
For bullish positioning, any weakness toward the $674-$676 support band offers compelling long entries targeting $680-$682 resistance with extended objectives toward $684-$686 if buyers can establish control through overhead supply zones. Focus on the $675-$676 area specifically for optimal risk-reward setups with protective stops below $673 to maintain disciplined downside protection while positioning for potential continuation from proven support territory. The fear gauge reduction creates more favorable conditions for directional trades, though traders should monitor momentum sustainability as institutional positioning appears to be stabilizing.
Risk management protocols should emphasize 3-4 point stop distances from entry points while maintaining conservative position sizing given the improving but still cautious volatility environment that typically accompanies gradual directional moves. The $674 level remains critical floor territory that must hold for any bullish continuation scenarios, while sustained weakness below this threshold could trigger accelerated selling toward the $671-$673 zone representing the next logical support cluster. Monitor the $680-$681 resistance band closely for volume-confirmed breakouts, as the compressed volatility environment suggests either $684-$686 upside targets or $671-$673 downside objectives could develop gradually depending on institutional flow patterns and continued fear gauge normalization.
Model’s Projected Range
SPY's projected maximum range for Friday is $673 to $686, with the Call side dominating in an expanding band that suggests trending price action with intermittent chop. Friday brings Core CPI m/m, CPI m/m, and CPI y/y data that are likely to produce significant volatility particularly in the first hour of trading. SPY closed at $679.86, up 0.57% after opening at $674.84, hitting a high of $681.15 and a low of $673.77 on lower than average volume. The VIX closed at 19.58, down 6.94%, suggesting a significant reduction in fear as markets digested the session's price action. SPY remains in the $675 to $680 range that has defined recent trading amid ongoing geopolitical tensions in Ukraine. Looking ahead, if the first resistance at $680 breaks, we target $685, while a break below the first support at $675 would target $673, and if that lowest support fails there is little to keep price from falling toward $670. The long-term bull trend remains intact above $640, and as long as price holds above key structural levels, this remains a broader dip-buying environment. Absent a catalyst, resistance sits at $680, $685, $686, $687, while support rests at $675, $673, $670, $665. We favor buying dips at $675 given SPY's close near the upper end of its recent range. Bitcoin showed strength with a 1.45% gain closing above $72,158, while MAG stocks posted a mostly green day across the board led by Amazon up 5.60% with the exception of Microsoft down 0.34%, and this mixed but generally positive action supports the broader rally. SPY closed in the middle of a redrawn bear trend channel with structural support near $626 remaining the critical level to watch for any deeper correction.
Market State Indicator (MSI) Forecast
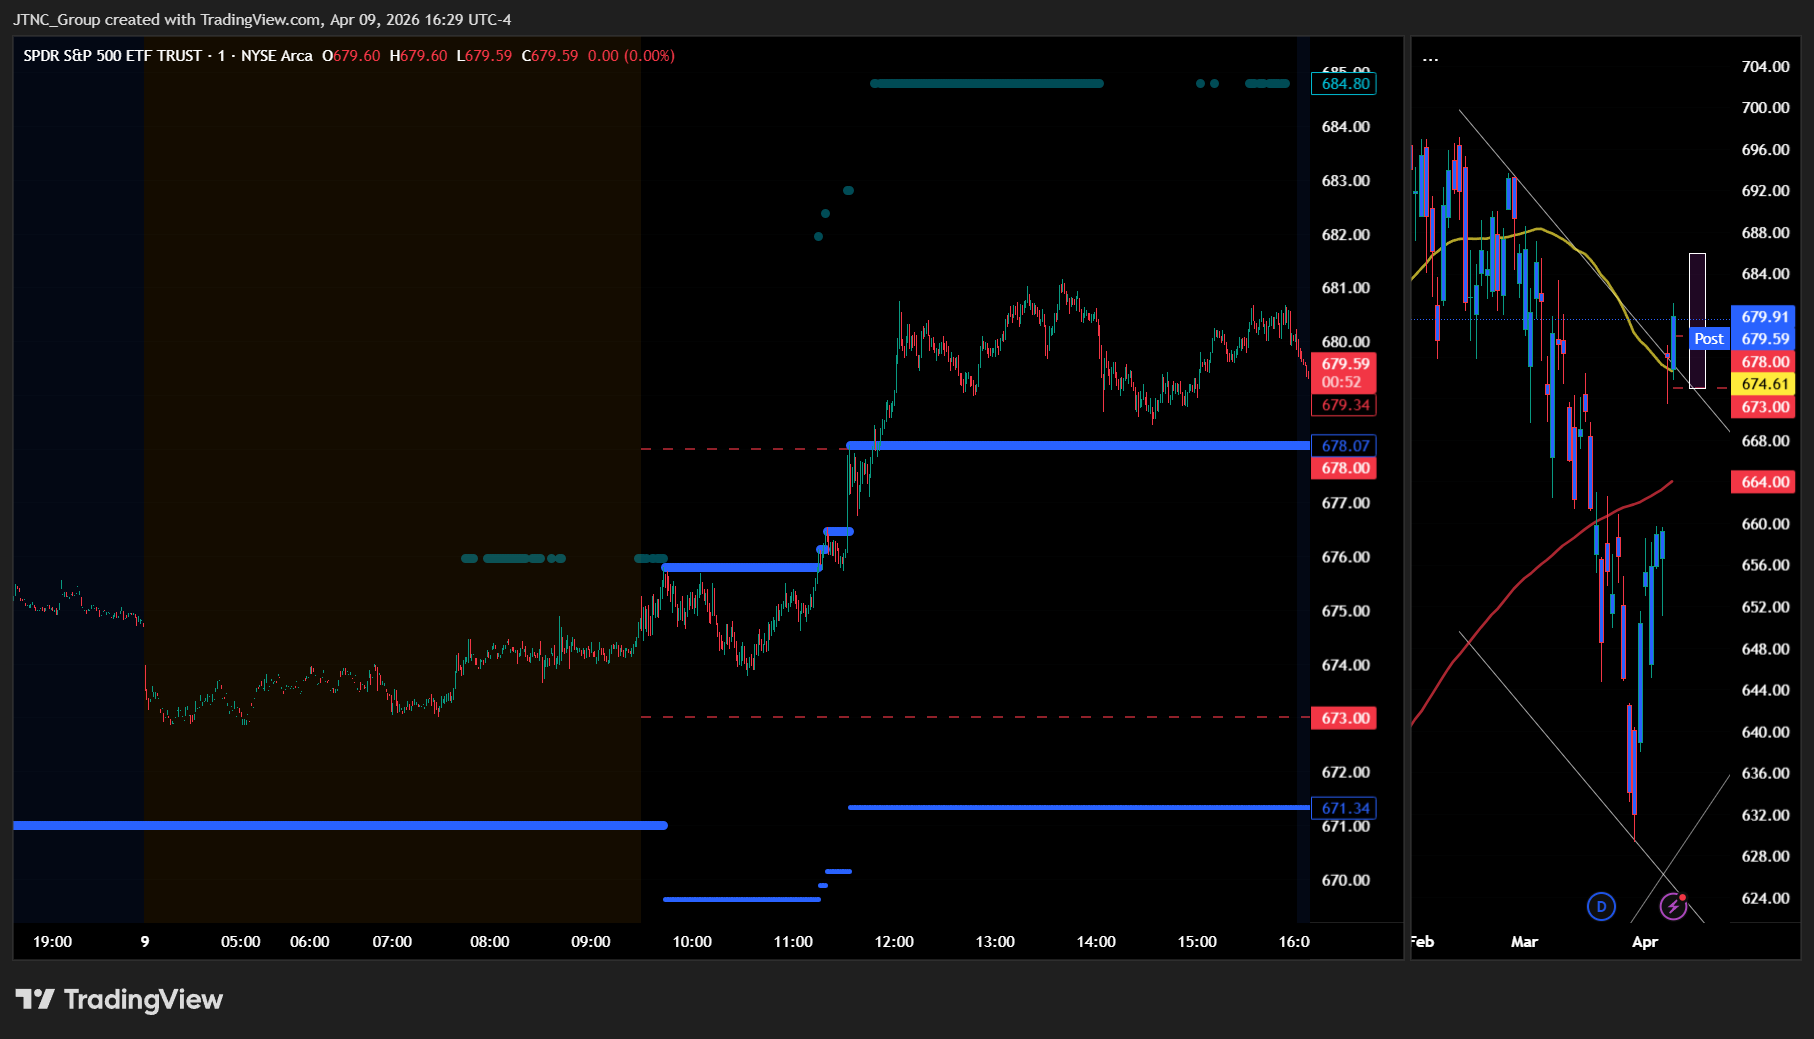
Current Market State Overview:
The MSI ended Thursday in a Bullish Trending Market State with SPY closing at $679.86. Since SPY closed above MSI resistance, the former MSI resistance at $678.07 now becomes support for Friday's session with resistance at $671.34. Extended targets were printing above at the close and were visible above in premarket, AM session, and PM session throughout the day. The MSI rescaled higher just after the open with several rapid rescalings higher until just after the AM session where it entered a wide Bullish Trending Market State with extended targets above keeping price well above MSI resistance turned support. The MSI did not rescale for the rest of the day which held price in a relatively tight range for the afternoon session. The wide $6.73 spread between the MSI levels shows price has established substantial room for movement within the bullish framework while maintaining clear directional bias. Thursday's session demonstrated sustained upward momentum as extended targets above provided consistent bullish signals throughout the entire day from premarket through the close. The MSI forecast for Friday calls for a strong continuation higher with the bulls maintaining control and extended targets above suggesting upside momentum will persist. MSI support is $671.34 with resistance at $678.07.
Key Levels and Market Movements:
Wednesday we stated, "Bulls want to hold current levels overnight and push toward $680," and added, "Given the wide $4.96 MSI spread and Wednesday's decisive move above the MSI range, Thursday is expected to see a slow grind higher," while also noting, "The wide spread indicates price has substantial room to move within the bullish framework, though the MSI may rescale depending on overnight action and the economic data releases." Thursday's session exceeded the bullish expectations as the market opened at $674.84 and sustained strong upward pressure throughout the day, reaching an intraday high of $681.15 well above the target $680 level. The MSI rescaled higher just after the open with several rapid rescalings that created a wide bullish trending framework, providing clear structure for the entire session. Extended targets were visible above from premarket through the close, signaling persistent bullish intention that carried through as SPY pushed decisively higher before settling at $679.86. The primary setup was buying any dip toward the evolving MSI support levels as the wide bullish trending state provided clear directional bias throughout the session. Bulls maintained decisive control from the opening bell, with SPY never threatening the lower boundaries of the MSI range despite hitting a session low of $673.77 that provided excellent long entry opportunities. At minimum it was a two-for-two session for traders following the framework as the MSI provided clear bullish signals with the wide trending state offering straightforward long opportunities within the established structure. It was an easy day to read and execute with substantial setups, all identified through proper context, patience, and flexibility while leveraging the MSI, premarket levels, and market structure rather than forcing trades. The MSI continues to prove its reliability as the cornerstone of our trading process.
Trading Strategy Based on MSI:
Friday has light economic news but the wide bullish MSI with extended targets above suggests continuation higher is the most likely outcome. Bulls want to hold current levels overnight and push toward $685, while bears want to see the $671.34 support fail to press price toward lower levels around $665. Given the wide $6.73 MSI spread and Thursday's decisive move above the MSI range, Friday is expected to see a strong continuation higher with bulls maintaining control and extended targets above suggesting upside momentum will persist. The wide spread indicates price has substantial room to move within the bullish framework, with the MSI likely maintaining its current structure given the strength shown throughout Thursday's session. With SPY having closed above MSI resistance at $678.07, any pullback to test this level becomes a key buying opportunity where bulls need to defend decisively to maintain the upward momentum. A successful test and hold at $678.07 would offer a long setup targeting higher levels around $685, while any breakdown below $678.07 with volume would signal a potential shift back into the MSI range and present a shorting opportunity targeting the former resistance at $671.34. The wide MSI spread with extended targets printing above at the close indicates strong bullish momentum with room for further upside, and any move toward either boundary should be respected given the persistent extended target signals. Bulls need to defend $678.07 decisively to maintain momentum, while bears want to see any rally fail and price break back below the support level to regain control. Any failure of MSI support is likely to see SPY retest lower levels while any successful hold above $678.07 with volume confirms the bullish framework and targets further upside beyond current levels. The long-term bull trend remains intact above $640 and failed breakouts and failed breakdowns continue to offer the highest-probability setups. Remain flexible, avoid trading during Ranging Market States unless a clear failed breakout or breakdown presents itself, and ensure all trades are fully aligned with MSI signals. Providing real-time insights into market control, momentum shifts, and actionable levels, the MSI when integrated with our Pre-Market and Post-Market Reports continues to sharpen execution precision and elevate trade quality. If you haven't yet integrated MSI and our model levels into your process, now is the time. Contact your representative to get started as these tools are designed to support consistency and enhance performance.
Dealer Positioning Analysis
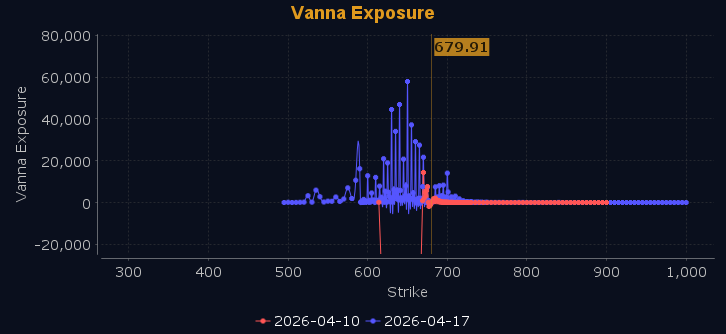
Dealers are selling SPY $680 to $700 and higher strike Calls, indicating the Dealers' belief that higher prices may be in store. The ceiling for Friday appears to be $683. To the downside, Dealers are selling $677 to $679 Puts while buying $659 to $611 and lower strike Puts in a 2:1 ratio to the Calls they're selling displaying that they are selling ATM Puts in size which indicates their belief that prices will continue higher on Friday. Dealers do not sell ATM Puts unless they believe there is a floor in the market at $677. This positioning reflects their measured optimism for upward movement, though they've established clear resistance around the $683 level. Dealer positioning is unchanged at neutral/slightly bullish.
Looking Ahead to Next Friday:
Dealers are selling SPY $680 to $718 and higher strike Calls, indicating the Dealers' belief that higher prices may be in store. The ceiling for next week appears to be $700. To the downside, Dealers are buying $679 to $585 and lower strike Puts in a 4:1 ratio to the Calls they're selling displaying significant concern that prices could move lower. This shift shows dealers are no longer selling ATM puts next week and have increased their downside protection significantly indicating some fear of lower prices next week. That said they are also open to the possibility that prices may rise to as high as $700 and are positioned accordingly. For the week Dealer positioning is unchanged at neutral/slightly bearish. We advise reviewing Dealer positioning daily for directional clues. These positions evolve quickly and tracking them is essential for staying ahead of shifting market sentiment.
Recommendation for Traders
With SPY closing at $679.86 after a solid 0.57% gain and the VIX dropping 6.94% to 19.58, traders can look for continuation above $681 resistance or expect pullbacks toward the $674-675 support zone. The relatively calm VIX levels suggest less volatility stress, making this environment more conducive to directional plays with standard risk management.
Keep stops tight and position sizes manageable as markets remain sensitive to external factors. Review the premarket analysis posted before 9 AM ET for any changes in the model's outlook and Dealer Positioning.
Good luck and good trading!
