Market Insights: Wednesday, April 9th, 2025
Market Overview
Markets exploded higher Wednesday as President Trump announced a surprising 90-day pause on most reciprocal tariffs, offering traders a long-awaited break from the relentless barrage of trade war headlines. The S&P 500 roared over 9.5%, marking its best day since 2008, while the Nasdaq soared 12%—its second-best performance on record and biggest gain since 2001. The Dow surged more than 7.8%, rocketing roughly 3,000 points higher in a stunning one-day move. Fueling the rally was a midday post from Trump on Truth Social, stating he had authorized a temporary tariff pause and cut the reciprocal tariff rate to 10%, effective immediately. While the freeze applies to most trading partners, Trump emphasized tariffs on China would rise to 125%, effective right away. He later pointed to the “yippy” reaction of the markets as part of his reasoning, even calling it “the biggest day in financial history.” Big Tech led the charge, with Tesla up nearly 23% and Nvidia soaring more than 18%, while Apple and Meta jumped around 15% each. Bond yields rose as well, with the 10-year pushing up near 4.4%. China, however, didn’t sit still, responding with its own hike in duties to 84%, effective Thursday. But for now, traders focused on the relief rather than the retaliation. Trump’s about-face capped off a whiplash-inducing week that’s shaken global markets and left traders bracing for more unpredictability ahead.
SPY Performance
SPY rocketed 9.37% higher on Wednesday to close at $543.01, rebounding sharply from the prior day’s selloff. After opening at $493.70 and dipping briefly to a low of $493.07, it exploded to an intraday high of $546.33 before settling near the top of the range. Volume came in at a staggering 218.32 million shares—four times the average—signaling just how powerful and unexpected the rally was. The session marked one of the strongest one-day comebacks in SPY history, driven almost entirely by Trump’s announcement mid-session. The break above $500 ignited further buying pressure as resistance levels were taken out one after another with little hesitation.
Major Indices Performance
The Nasdaq led all indices with an eye-popping 12.16% gain, registering its second-largest daily surge in history and its best showing since the dot-com bubble. The S&P 500 followed with a 9.5% gain, its best session since 2008, as investors cheered the temporary pause on tariffs. The Russell 2000 rallied 8.5%, while the Dow jumped 7.87%, climbing over 3,000 points. Sentiment shifted dramatically after Trump’s tariff rollback post, helping equities recapture key technical levels and restore some investor confidence. There was no hiding from the rally—every sector participated, with tech leading and even defensive names climbing. The tariff news was a game changer, at least for the day, wiping out bearish momentum and triggering a wave of short covering and dip buying across the board.
Notable Stock Movements
The Magnificent Seven delivered a truly monstrous performance Wednesday. Tesla led the group, soaring over 22% in response to renewed optimism in the risk-on environment. Nvidia followed closely, up over 18%, while Apple and Meta each surged more than 15%. The rest of the group also posted exceptional gains, all up more than 8%. The day’s price action reflected a sudden shift in risk appetite, with mega-cap tech being the first place investors turned once the worst-case tariff scenario was taken off the table. Short squeezes likely contributed to the dramatic intraday moves, further propelling the largest names higher.
Commodity and Cryptocurrency Updates
Crude oil reversed higher, climbing 5.25% to close at $62.71, finding some footing just above our previously targeted $60 level. We still expect a move to $50 and will be buyers when that threshold is approached. Gold jumped 3.67% to finish at $3,099 as safe-haven demand mixed with renewed inflation concerns after the risk-on spike. Bitcoin rallied sharply as well, rising 7.71% to close just above $83,000. We remain buyers between $77,000 and $83,000, looking to take profits above $85K. Below $77K, risk grows sharply, so we continue to advise against new entries at lower levels.
Treasury Yield Information
The 10-year Treasury yield rose 1.76% to close at 4.335%, reflecting reduced demand for safety as equities staged their historic rally. While still under the 4.5% danger zone, continued strength in yields could eventually pressure equities again. Any climb above 4.8% will renew fears of a 20%+ equity correction. For now, yields remain elevated but manageable, with risk-on behavior taking precedence over macroeconomic caution.
Previous Day’s Forecast Analysis
Tuesday’s forecast anticipated another wide-ranging, volatile session, calling for a projected SPY range of $470 to $524. The model leaned bearish, advising traders to sell rallies and warned that staying below $494 could sustain downside pressure toward $480 or even lower. Key resistance levels were identified at $496, $499, and $502, while support was pegged at $485 and $480. The strategy emphasized short trades into resistance and warned of headline-driven price spikes that could trigger ambiguous breakouts, urging traders to exercise caution during reversals and large swings.
Market Performance vs. Forecast
SPY defied Tuesday’s forecast with a historic upside surprise, blasting through resistance and closing far above the projected range. The session opened at $493.70—slightly below initial resistance—but news of the 90-day tariff pause shifted sentiment dramatically. After a brief dip to $493.07, SPY exploded higher, blowing past the model’s $502 top target and hitting $546.33 before closing at $543.01. While the model had highlighted potential snapback rallies, nothing in the forecast anticipated a 9.37% intraday surge. Resistance levels offered little resistance as buyers overwhelmed the tape. This was a rare case of the market outpacing even the model’s expansive volatility parameters, proving how unexpected policy shifts can spark massive dislocations. Traders who reacted quickly to the news and rode the rally through key breakouts had extraordinary opportunities.
Premarket Analysis Summary
In Wednesday’s premarket analysis posted at 7:52 AM, SPY was trading at $485.49 with downside pressure expected to persist unless the price could reclaim $494. The analysis projected targets above at $490, $494, $496, $499, and $502, with support below at $485 and $480. The environment was described as unstable and headline-driven, with traders advised to sell into resistance and be cautious of failed rallies. The analysis did acknowledge the potential for sharp reversals triggered by unexpected news—an alert that proved prescient given the day’s dramatic shift mid-session.
Validation of the Analysis
Despite the premarket call leaning bearish under $494, the guidance was surprisingly accurate in flagging the potential for headline-driven reversals and sharp rebounds from lower levels. The market opened near $493 and initially hovered in line with expectations—but once Trump announced the 90-day tariff pause, the dynamic changed instantly. The break above $494 triggered a series of upside levels, all of which were met and exceeded. Resistance at $496, $499, and $502 were rapidly taken out, confirming that the premarket levels were meaningful in framing potential trades. The real takeaway? The analysis once again provided a reliable framework—even in an unpredictable environment—and traders who were quick to adapt had powerful setups to act on.
Looking Ahead
Thursday brings the highly anticipated CPI report, which will be the first inflation read since the White House’s tariff pause. Any upside surprise in prices could challenge the market’s new bullish tone and reignite rate fears. While normally a big market mover, this week’s CPI will have a muted effect when compared with today’s move. With Friday’s PPI and University of Michigan sentiment and inflation data still to come, traders should be prepared for another round of volatility. The relief from the tariff pause offers temporary stability, but macro forces still loom large.
Market Sentiment and Key Levels
SPY closed at $543.01, surging well above all recent resistance levels and testing the upper boundary of its broader bear trend channel. For now, bulls are back in control, reclaiming key levels with conviction. The bears are not gone however until price closes above $585. Resistance now stands at $545, $550, and $555, while support is at $542, $540, and $535. Should SPY break above $555, the next key test lies at $560, while a fall below $530 would reopen the door for a drop back toward $500. With sentiment whipsawing on news flow, these levels will be vital to monitor in the coming days.
Expected Price Action
Our AI model projects a wide range of $525 to $565 for Thursday, reflecting an environment still prone to trending price action. The bias has flipped bullish, and any dips are likely to be bought aggressively, especially if SPY holds above $535. A break above $555 could send price toward $560 and beyond, while a failure at $540 could see a test of $535, then $530. This is actionable intelligence for a highly fluid market environment. Traders should expect continued reactivity to headlines and inflation data. If CPI comes in hot, upside targets may stall, while a tame read could fuel a move toward $570.
Trading Strategy
Traders should look to buy pullbacks to support zones between $535 and $540, targeting $545, $550, and $555. Long trades from those levels offer strong setups so long as price holds above $535. However, should SPY fail to hold $535, short trades become viable with targets at $530 and potentially $525. The VIX closed at 33, now under our critical 35 threshold, which typically signals more stable conditions and favors long trades. But with volatility still elevated, trade with reduced size and wider stops and take a day for price to settle before increasing size. In this environment, managing risk is key—don’t overcommit. Focus on intraday failed breakdowns for longs or failed breakouts for shorts near resistance.
Model’s Projected Range
The model’s maximum projected range is $525 to $567, with the Call side dominating across a broad spectrum—suggesting continued trending price action on Thursday. SPY closed at $548 after another highly volatile session, climbing 10.5% on news that tariffs are paused for 90 days. These types of moves are unprecedented, and no model can reliably forecast in such an extreme environment. Volume surged again to four times the average, underscoring the intensity behind the move. Key resistance levels now stand at $545, $550, and $555, while support lies at $542, $540, and $535. With a close above $535, the bulls have reclaimed the majority of control, though full dominance won't be secured until a break above $585. Conversely, a break below $530 could open the door for a test of $500, while a push above $555 would encounter minimal resistance until $570. As was the case yesterday, several of our systematic, automated strategies remain largely inactive due to the extreme volatility—currently trading less than 1% of our book. Tariffs and inflation will continue to dominate as primary market drivers. For the next 90 days, or until the White House provides further guidance, this issue will exert significant influence over the market. The VIX closed at 33, after spiking as high as 60. As we've stated over the past few days, a VIX close below 35 is conducive to higher prices. In the immediate term, dips should be viewed as buying opportunities as SPY moves toward the key $585 level. The broader bearish trend channel that began with the December highs remains intact, with price now trading near the upper end of that channel. While the channel permits movement in both directions, price action is expected to remain contained within it in the very short term, with material resistance near $570. Momentum is clearly favoring the bulls.
Market State Indicator (MSI) Forecast
Current Market State Overview:
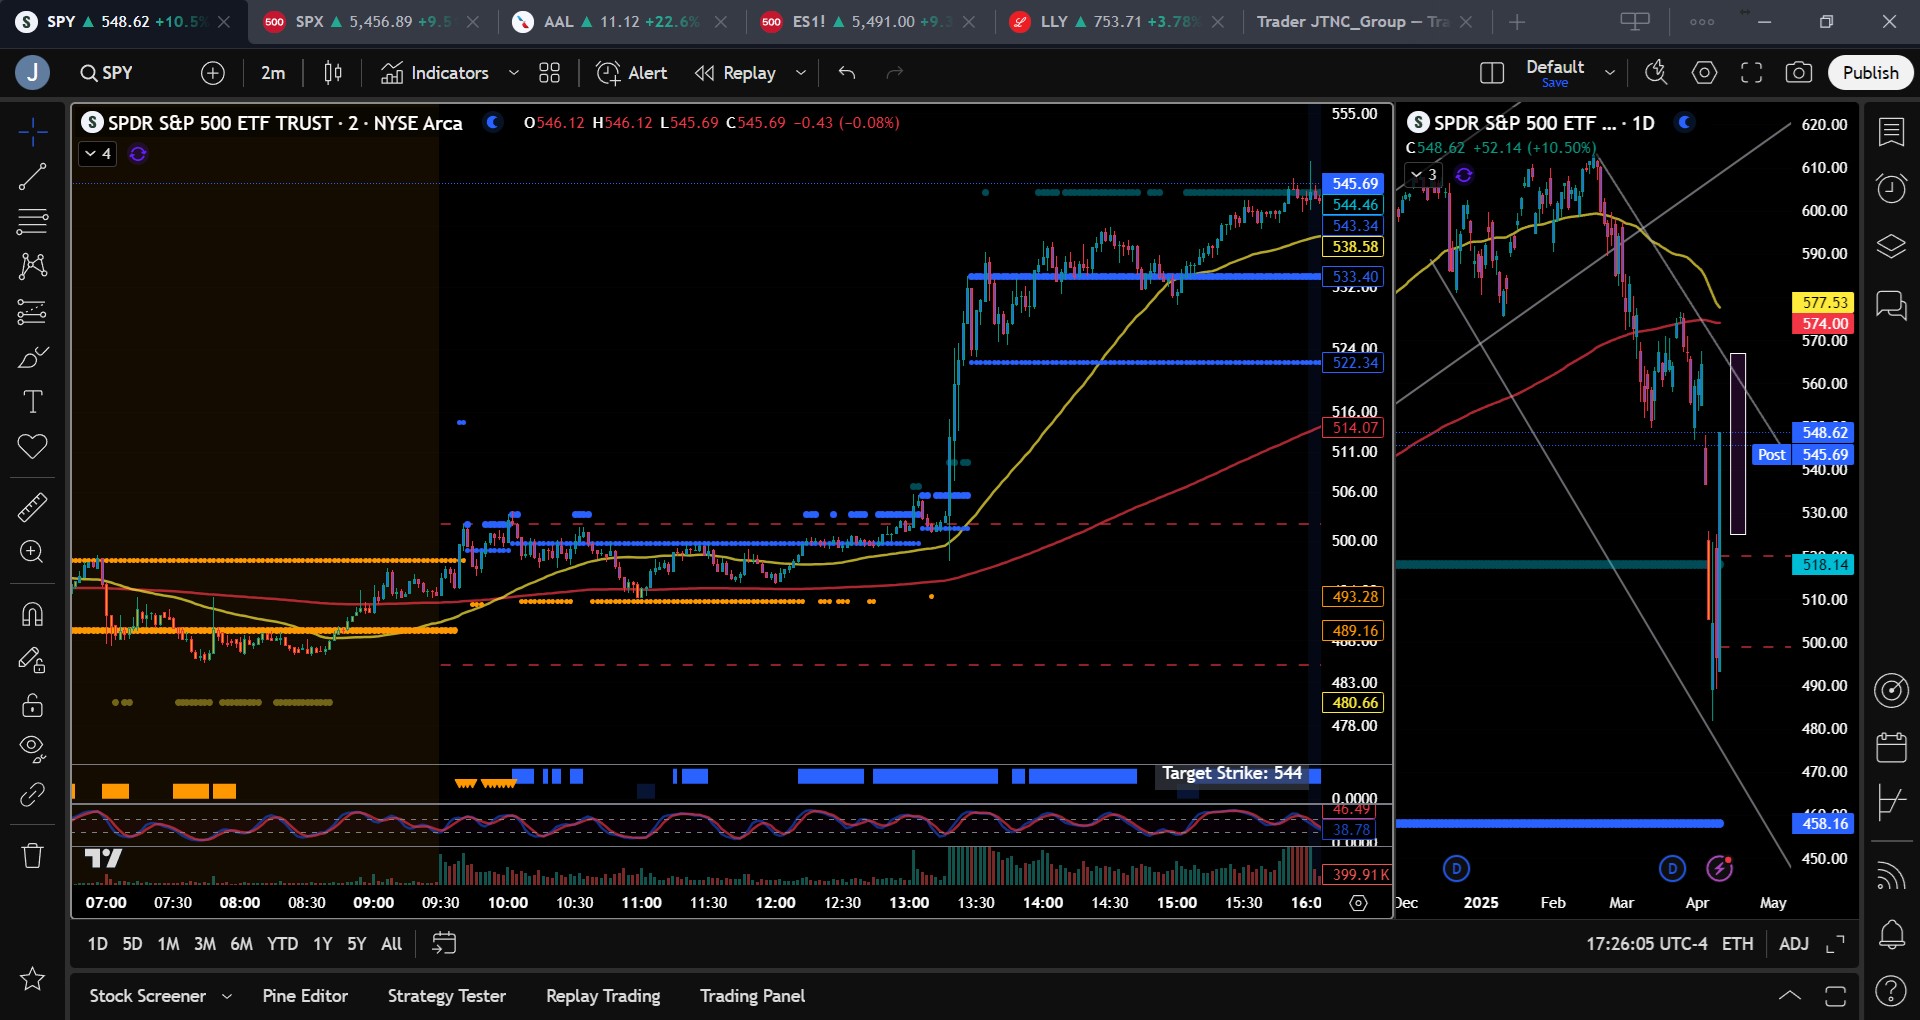
The MSI is currently in a Bullish Trending Market State, with price holding well above resistance-turned-support. Extended targets are printing to the upside, and the MSI range is wide—indicating a strong, but not overly aggressive, bullish trend heading into Thursday. Overnight, price climbed off the lows of $485 to open at $495.52. The MSI initially rescaled to a ranging state, then shifted into a very narrow bullish state. SPY remained constrained within this narrow MSI range, oscillating between bullish and ranging states until 1:15 PM, when the White House announced a pause on tariffs. SPY surged on the news, and the MSI immediately rescaled into a massive Bullish Trending Market State, with extended targets above. Notably, those extended targets began printing around 1:00 PM—before the official announcement—suggesting that major market participants were positioning ahead of the news. The MSI caught this shift early, signaling the onset of one of the most powerful sessions the market has seen in its history. By 1:28 PM, the MSI had settled into its current bullish state, and while the upward momentum briefly slowed—alongside a pause in extended target printing—it resumed after 2 PM. SPY continued its push into the close, ending near the day’s highs. At present, MSI support is marked at $533.40, with additional support lower at $522.34.
Key Levels and Market Movements:
On Tuesday, we stated: “The market remains highly sensitive to any developments out of the White House.” We also noted: “Price action can flip minute to minute, making any directional bias nearly irrelevant. This is exactly when you must trade what you see—using the tools we provide.” Finally, we pointed out: “Once full-blown capitulation hits, a sharp rebound toward $535 or beyond is likely.” Today was one for the record books. But like yesterday, we had a plan—and we stuck to it. At the open, with a bit of relief in the overnight session after testing Monday’s lows, we initiated a short on the narrow MSI double top at $502, aiming for a first target at MSI support of $500. That came quickly, so we looked for a second target at $493, which was also hit fairly swiftly. We then moved our stop to breakeven, holding 10% of the position to see if the MSI would rescale to a bearish state—something that would support further downside. It didn’t, and by 1 PM, our 10% runner was stopped out at breakeven. We considered calling it a day given the narrow range, but with the MSI in a very tight bullish state, something unusual happened—it rescaled higher and began printing extended targets above. Historically, we know there’s over a 70% probability of success when entering from MSI support toward MSI resistance. With extended targets in play and price trading at a premarket resistance level that had turned into support, we went long at $501 at 1:10 PM, targeting $505.50. Then the news hit. Price spiked sharply, hitting our first target in a flash. As extended targets continued to print and the MSI rescaled higher, we waited for price to settle, eyeing a second target near $535—a level highlighted in yesterday’s newsletter and part of today’s plan. Sure enough, price reached $535, now acting as MSI resistance. With 90% of our trade booked, we held the remaining 10% into the close to see how far the market would run. We exited at $548, capping off a remarkable session with one short and one long—both fabulous trades. This week has been extreme, with profits that typically take days, if not weeks, to accrue. Once again, the key was simple: have a solid plan, follow it with discipline, and let the MSI and model levels guide each decision. The MSI shows who’s in control, when that control shifts, and where key actionable support and resistance lie—empowering precise entries and exits. Paired with our model levels and daily strategy, it keeps us aligned with dominant market forces. MSI delivers this level of precision consistently—helping traders avoid danger, stay in sync with momentum, and take profits with confidence. We strongly recommend incorporating the MSI into your trading toolkit. When combined with a structured plan, it becomes a powerful driver of long-term performance.
Trading Strategy Based on MSI:
Thursday brings CPI—a typically market-moving event—but in the current environment, the tariff situation is far more impactful. The market remains highly sensitive to any developments out of the White House, and it's important to remember: a 90-day pause is not the end of tariffs. It’s just a pause. While today’s short squeeze came close to breaking historic records, the broader issue of tariffs remains unresolved. With China tariffs still slated to rise to 125%, there are significant macro risks looming over both the market and the global economy. The bulls have now taken control from the bears, with SPY closing above $535. Holding above that level opens the door for a move to $570 and then $585. However, a break below $535 would likely invite the bears back in, with potential to retrace a large portion of today’s rally. That said, external forces remain the key driver, so traders must focus on trading what they see, not solely relying on the model’s levels. As we saw today, news can instantly render those static levels irrelevant. Fortunately, the MSI updates in real time, offering actionable intelligence to keep you aligned with the market’s evolving dynamics. Learn how to use it properly, and you'll never be caught relying on outdated plans. For Thursday be cautious around CPI at 8:30 AM. Traps are common after these releases, and we’ll be watching for signs of a failed breakdown or breakout. If the market clears CPI smoothly and the MSI maintains its current state, expect a drift higher. Another 10% rally is unlikely unless more favorable news emerges from the White House. Our lean is for the market to move higher overnight, allowing us to let price unfold and watch for the bulls to defend $535. A retracement to as low as $525 would still be within bullish control. If $525 breaks, however, SPY could slide quickly back to $500 or lower. Above $535, bulls will first target $550, then $555, with eyes ultimately on $585. While the bears aren’t fully sidelined, they have little to do unless price retraces a meaningful portion of today’s move. Buy dips—ideally from a failed breakdown, though double bottoms or other constructive patterns can also be valid entries. Avoid shorting if the MSI range is wide or if extended targets are printing above. Rely on the tools: the Premarket Report, which combines fresh data with AI-driven insights for real-time guidance; the MSI, for navigating intraday market structure; and our model levels, to identify high-probability targets and entries. Be nimble. Adapt. Trade what you see—not what you think. The chance of SPY dropping to $450 is now virtually zero. That’s how quickly conditions can shift. Typically, markets climb the stairs and fall down the elevator—but today was different. As conditions normalize, expect SPY’s pace to slow and the MSI range to return to a more typical width. Keep your eyes on the MSI. It offers critical, real-time insights that help you stay in sync with dominant trends. Respect extended targets—they represent momentum powered by conviction and herd behavior. Used in tandem with our model levels, the MSI keeps you on the right side of the trade. If you’re not already leveraging these tools, now is the time. Connect with your rep—they’re game changers in navigating volatility like this.
Dealer Positioning Analysis
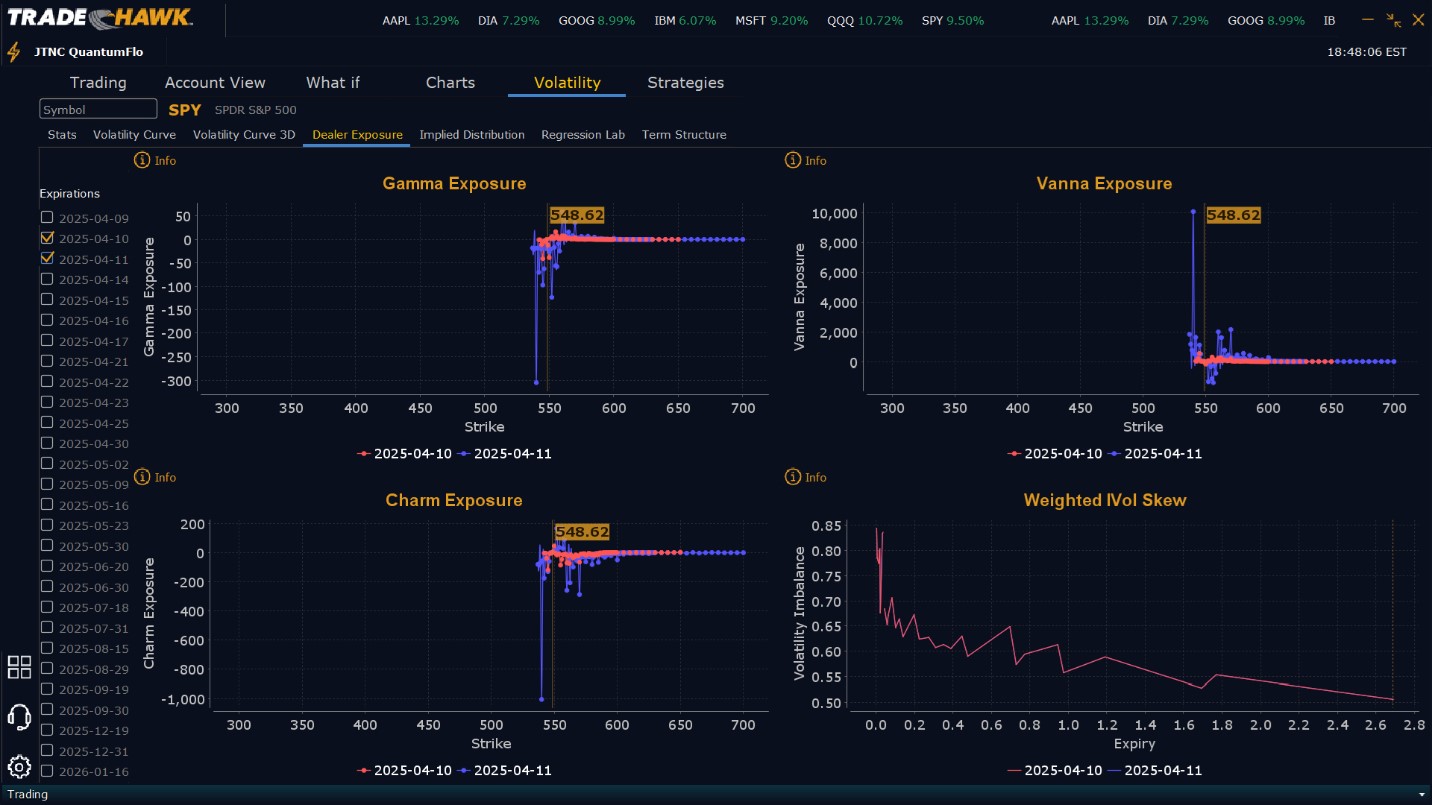
Summary of Current Dealer Positioning:
Dealers are selling $552 to $570 and higher strike Calls while also buying $549 to $551 Calls indicating the Dealers desire to participate in a continuation of today’s massive rally. To the downside Dealers are buying $548 to $535 and lower strike Puts in a 1:2 ratio to the Calls they are buying/selling, implying a bullish posture for Thursday. Given the size of today’s move, today’s positioning is likely to change materially tomorrow. This positioning has changed from neutral to bullish.
Looking Ahead to Friday:
Dealers are selling $552 to $570 and higher strike Calls while also buying $549 to $551 Calls indicating the Dealers desire to participate in any continuation of today’s massive rally this week. As we said yesterday, “Dealers have bought large quantities of Calls which reinforces this belief” and today that certainly paid off handsomely. We also stated, “Dealers continue to believe either tariffs will be negotiated or a relief rally will develop by the end of this week.” Again how true this statement was, all determined by Dealer positioning. To the downside, Dealers are buying Puts from $548 to $535 and lower in a 1:1 ratio to the Calls they’re buying/selling. This reflects a bullish outlook for the week. Dealer positioning has changed from neutral to bullish. Again Dealers will likely reload on all their options tomorrow which could change this picture materially. Dealers still hold large amounts of downside protection although they are no longer adding to it significantly. We advise reviewing Dealer positioning daily for directional clues. These positions evolve quickly, and tracking them is essential for staying ahead of shifting market sentiment.
Recommendation for Traders
After one of the wildest rallies in over a decade, traders should be prepared for either a pause or continued upside. Key levels to monitor include $535 as immediate support and $550 as near-term resistance. If SPY can hold above $535, buying dips remains a viable strategy, with upside targets at $545 and $555. However, if price breaks below $530, short setups may emerge, with potential downside targets at $525 and $515. Risk remains elevated, as reflected by a VIX reading still above 30. In this environment, it’s critical to reduce position size, use wider stops, and avoid chasing extended moves. Instead, wait for failed breakouts or breakdowns near key levels to offer clearer, lower-risk entry points. Capital preservation should be a top priority. Stay cautious, trade small, and remain flexible—your edge lies in reacting to price, not in predicting it. Focus on failed breakout or breakdown setups, especially when confirmed by the MSI, as they often present the best risk/reward opportunities. Counter-trend trades should be limited to moments when price is testing major levels and broader market conditions are in alignment. Above all, stay nimble and disciplined. Be sure to review our premarket analysis before 9:00 AM ET for the latest signals and strategic insights.
Good luck and good trading!
