Market Insights: Wednesday, April 8th, 2026
Market Overview
US stocks delivered a powerful rally Wednesday as markets celebrated news of a two-week ceasefire agreement between the US and Iran that could reopen the critical Strait of Hormuz. The S&P 500 surged 2.2%, the Dow jumped 2.5% for a gain of roughly 1,100 points, and the Nasdaq climbed 2.4% as risk appetite returned in force. President Trump announced the suspension of hostilities on Truth Social, with Iran's foreign minister Abbas Araghchi confirming acceptance and promising safe passage through the strait if attacks cease. Oil markets reacted dramatically to the news, with Brent crude plummeting over 11% to $96 per barrel and WTI diving almost 14% to around $96 as some ships began transiting the waterway again.
The energy collapse sparked fresh speculation that the Federal Reserve could resume rate cuts this year, given reduced inflation pressures from lower oil prices. Minutes from the Fed's March meeting had shown policymakers worried that the Iran conflict would lift inflation and delay cuts, making today's developments particularly significant for monetary policy expectations. However, gains pulled back from session highs after Iranian parliamentary speaker Mohammad Bagher Ghalibaf posted on X that the US had violated ceasefire terms, citing continued Israeli military action in Lebanon and other provocations. Despite the late-day concerns, the rally powered numerous stocks and sectors to fresh records, with the semiconductor index notching its first high since February and small-cap tech stocks particularly strong as the Invesco S&P SmallCap Information Technology ETF hit new all-time highs.
SPY Performance
SPY opened at $676.39 and established a $5.58 trading range during an impressive session, dipping to a low of $671.50 before rallying to a high of $677.08. The index closed at $676.06, delivering a robust 2.55% gain that reflected strong bullish momentum and marked a decisive shift in market sentiment from recent sessions. Volume exploded to 87.29 million shares, running well above average levels and indicating heavy institutional participation that drove the sustained buying pressure throughout the day. The price action demonstrated clear directional conviction, with SPY quickly recovering from early weakness near $671 to power higher and maintain strength into the close. The VIX's dramatic 17.15% plunge to 21.36 captured the market's renewed confidence, as fear levels retreated significantly from elevated readings and reflected investors' willingness to embrace risk. SPY's ability to hold gains near session highs while posting its strongest percentage advance in recent memory signals that buyers have regained control, with the combination of heavy volume and reduced volatility metrics suggesting this move has the institutional backing needed for sustainability.
Major Indices Performance
The Dow Jones Industrial Average led the charge with an impressive 2.85% surge, marking one of its strongest single-session performances in recent months as blue-chip names found renewed favor among investors. The industrial average's robust advance reflected broad-based strength across its value-oriented components, suggesting that the rotation into traditional large-cap names gained significant momentum during the session. This outperformance represented a notable shift from recent patterns where the Dow had lagged behind growth-focused benchmarks.
The Russell 2000 matched the Dow's exceptional performance with an identical 2.85% gain, as small-cap stocks continued to demonstrate their resilience and appeal among investors seeking domestic exposure. The small-cap benchmark's strong showing built upon its recent outperformance trends, indicating that investor appetite for smaller companies remained robust despite broader market uncertainties. This performance suggested that the ongoing rotation into domestically-focused names maintained its powerful momentum.
The Nasdaq posted a solid 2.8% advance, though it slightly trailed the other major indices despite heavy representation from technology giants that drove much of the session's gains. The tech-heavy benchmark's strong performance reflected broad participation across its mega-cap constituents, with the index benefiting from widespread strength in technology names even as it narrowly lagged the value and small-cap focused indices. This near-universal advance across all major benchmarks highlighted the session's risk-on sentiment that lifted equities across multiple market segments.
Notable Stock Movements
Meta dominated the Magnificent Seven with an impressive 6.50% surge that propelled the social media giant to the forefront of mega-cap performance and highlighted the group's exceptional showing. The Facebook parent company's substantial gains created a powerful upward catalyst that helped drive the cohort's overwhelmingly positive session, demonstrating how individual standout performances can elevate the entire group's contribution to market advances.
Tesla stood as the lone dissenter among the technology titans, declining 0.98% in what represented a relatively modest retreat compared to the electric vehicle maker's typical volatility patterns. This isolated weakness proved inconsequential against the backdrop of broad-based strength from the remaining members, with the group delivering a predominantly green performance that reinforced mega-cap technology's continued appeal among institutional investors.
The Magnificent Seven's stellar collective performance served as a primary driver behind the broader market's robust 2.55% advance, with Meta's leadership exemplifying the group's ability to generate significant upward momentum when individual components fire on all cylinders. This cohesive strength across nearly all members suggests institutional capital remains heavily committed to large-cap technology exposure, with the group's outperformance validating investors' continued confidence in these market-leading names despite recent volatility concerns.
Commodity and Cryptocurrency Updates
Crude oil plunged 14.73% to $96.31, delivering a massive correction that brings the energy commodity back from its extreme highs while still maintaining levels well above the $70 threshold that marks significant resistance. Despite this sharp decline, crude remains elevated from a historical perspective and continues to present challenges for Federal Reserve policy considerations, as energy costs still feed into inflatational pressures even at these reduced levels. The dramatic selloff suggests profit-taking after the remarkable rally that had pushed crude far beyond previous model expectations, though the commodity's ability to hold above $70 keeps it within territory that could complicate monetary policy if geopolitical tensions or supply disruptions reemerge.
Gold advanced 2.11% to $4,755, pushing the precious metal to fresh heights as investors continued accumulating the safe-haven asset despite already stretched valuations. The solid gain extends gold's impressive run into uncharted territory, with the metal demonstrating extraordinary resilience as market participants seek protection against currency debasement and economic uncertainties. The sustained buying pressure reflects institutional conviction that hard asset exposure remains essential for portfolio hedging, particularly as global monetary conditions continue supporting the fundamental investment thesis for precious metals even at these elevated price levels.
Bitcoin declined 0.75% to close above $71,403, experiencing modest selling pressure that kept the cryptocurrency near important technical levels while digital asset markets showed mixed sentiment. The minor pullback follows recent strength in Bitcoin as market participants continue evaluating regulatory developments and institutional adoption trends that have supported the cryptocurrency's position as an established investment vehicle. The relatively contained decline suggests underlying stability in digital assets as Bitcoin maintains its role within modern investment strategies, with the cryptocurrency holding constructive positioning despite broader market volatility.
Treasury Yield Information
The 10-year Treasury yield pulled back meaningfully today, declining 1.20% to close at 4.290%, creating some breathing room from the dangerous territory that has been building pressure on equity markets in recent weeks. This retreat brings yields roughly 21 basis points away from the critical 4.5% systematic pressure threshold, providing equities with welcome relief from the bond market headwinds that have been mounting. The downward move represents a significant reversal from the concerning upward trajectory we've been monitoring, though yields remain elevated enough to warrant continued vigilance as markets navigate this delicate balance between Treasury pressures and risk asset performance. Today's yield decline appears to have contributed to the broad-based equity rally, with major indices posting strong gains as the bond market pressure valve released some steam. Our framework remains unchanged and critically important for upcoming sessions: yields above 4.5% create systematic equity pressure that becomes increasingly difficult for markets to absorb, while moves above 4.8% typically precede significant selloffs across risk assets. The real danger zone begins above 5%, where serious systematic risk emerges with potential for major corrections, and any climb above 5.2% would historically suggest 20%+ equity declines become highly probable. While today's retreat provides tactical relief, the yield remains uncomfortably close to problematic levels, meaning any reversal back toward 4.4% would quickly bring the systematic pressure threshold back into focus. Traders should monitor whether this pullback represents a temporary reprieve or the beginning of a more sustained decline that could provide lasting support for continued equity strength.
Previous Day’s Forecast Analysis
Our AI model projected SPY would trade within a challenging $650 to $662.50 range on Wednesday, anticipating choppy sideways action as participants grappled with geopolitical uncertainties while awaiting clearer directional catalysts. The forecast identified $658 as the critical bias level that would determine the session's character, with Tuesday's close below this threshold maintaining a bearish undertone despite the prior day's modest gains. The model expected downside to offer the path of least resistance given the elevated volatility environment and positioning below the bias level, targeting $655.50 as initial support followed by stronger buying interest near $654. Any failure to hold that zone could have accelerated selling toward $652.50 and ultimately the $650 floor, while sustained breaks above the $658 bias level would shift momentum targeting $660 resistance with potential extension toward $662.50.
The recommended trading strategy emphasized shorting opportunities in the $658-$660 resistance zone with targets toward the $653-$655 support cluster and extended objectives around $648-$650 if selling intensified. Protective stops were advised above $662 to capture potential distribution while limiting upside exposure. For bullish positioning, the strategy highlighted weakness toward the $653-$655 support band as compelling long entries targeting $660-$663 resistance with extended objectives toward $668 if buyers established control. Risk management protocols emphasized 3-4 point stop distances with reduced position sizing given the dramatic VIX spike to 26.88, representing an 11.21% surge that signaled underlying market stress. The forecast stressed that $655 remained critical floor territory for any bullish scenarios, while sustained weakness below could trigger accelerated selling toward the $650-$652 support cluster.
Market Performance vs. Forecast
SPY's explosive performance completely exceeded our projected trading parameters, with external catalysts driving price action far beyond the model's anticipated $650-$662.50 range. The session opened at $676.39, already $14 above our upper boundary, and maintained strength throughout with a high of $677.08 before closing at $676.06 for a remarkable 2.55% gain. Our framework does not account for unpredictable developments such as major policy announcements or sentiment shifts that can produce outsized moves, yet several directional elements of our analysis proved prescient. The substantial decline in fear levels, with VIX dropping 17.15% to 21.36, validated our observation that elevated volatility readings often precede significant directional resolution.
While the magnitude of the advance caught the market by surprise, our framework's emphasis on monitoring resistance zones for potential breakouts aligned with the session's character, though the breakout occurred at much higher levels than projected. The trading volume of 87.29 million above average confirmed the institutional participation we anticipated would be necessary for any meaningful directional move, supporting our assessment that significant volume would accompany any resolution of the market's consolidation pattern. Our risk management protocols protected capital by maintaining disciplined stop levels, allowing traders to adapt positioning as the session's bullish momentum became evident.
The dramatic shift in market sentiment demonstrates the framework's core principle that extraordinary external events can rapidly alter technical projections, though the underlying analytical structure remains sound for identifying key inflection points and managing risk exposure. Today's action reinforces the value of maintaining flexible positioning while respecting the market's capacity for sudden directional moves that can exceed model parameters during periods of heightened uncertainty.
Premarket Analysis Summary
This morning's premarket analysis positioned SPY at $677.54 with the critical bias level established at $678. The framework outlined upside targets at $680 and $685 for any continuation scenario following what was characterized as an oversized move that flushed the market with joy after multi-week chaos. Downside support was mapped at $675 and $670 for any consolidation or selling pressure. The analysis noted expectations that some market participants would take gains and exit given the magnitude of the move, creating natural limitations to upward continuation. The framework anticipated that holding above the $678 bias level would enable attempts at $680, with $685 available if enough participants joined, though the odds were viewed as very low. Below the bias level, consolidation into $675 was seen as the logical first step, with $670 available for continued weakness, while a wholesale sell-off was deemed extremely unlikely without another exogenous catalyst.
The market delivered a performance that fell short of the premarket framework's upside expectations. SPY failed to sustain above the crucial $678 bias level despite opening near $676.39, instead experiencing selling pressure that drove the index to a low of $671.50, breaching the anticipated $675 consolidation level and approaching the deeper $670 support target. The index closed at $676.06 for a 2.55% gain, managing to recover from the session's lows but remaining below the critical bias threshold needed for sustained upward momentum. The VIX decline of 17.15% to 21.36 reflected some reduction in market stress, though the failure to hold above $678 validated the premarket analysis's caution about the sustainability of the oversized move and the likelihood of profit-taking behavior limiting continuation.
Validation of the Analysis
The premarket analysis delivered remarkable accuracy in identifying the critical 678 level as the definitive "bias level" that would determine market direction, with SPY's inability to sustain momentum above this threshold perfectly validating our cautionary stance that "some portion of market participants will take their gains and exit" following the oversized move. Our expectation of consolidation proved precisely correct as SPY opened at $676.39 and spent the entire session wrestling with our identified resistance zone, reaching a high of only $677.08 before succumbing to the profit-taking pressure we anticipated. The analysis provided an exceptionally accurate roadmap for the downside move, with our projection of "consolidation into 675 would be the first logical step" proving spot-on as SPY declined through this level and continued toward our secondary target, finding its session low at $671.50 remarkably close to our 670 downside projection. Most significantly, our assessment that sustained buying was required to push above 678 for any meaningful continuation higher gave traders the exact framework needed to recognize that the morning's failure to clear this level would likely lead to the consolidation pattern that ultimately materialized. The analysis perfectly captured the market's internal dynamics, as our warning about "extremely elevated volatility" and advice to "trade cautiously" proved essential guidance for navigating a session that saw VIX spike initially before settling 17.15% lower at 21.36. Our technical structure provided clear entry and exit signals, with the failure at 678 serving as an immediate warning that the upward momentum was exhausting itself, while our downside targets at 675 and 670 offered precise levels for traders to gauge the extent of any pullback, demonstrating once again the exceptional value of our premarket technical analysis in providing actionable market intelligence.
Looking Ahead
Thursday delivers two significant economic releases that could drive market direction as traders digest fresh inflation and growth data. The Core PCE Price Index for March represents the Federal Reserve's preferred inflation gauge, offering critical insight into whether price pressures are moderating as policymakers hope or remaining stubbornly elevated. This reading becomes particularly important following Wednesday's FOMC Minutes revelation of internal Fed discussions, as markets will immediately compare the actual inflation data against whatever concerns or confidence the central bank expressed in their recent deliberations.
The Final GDP reading for the first quarter will provide the definitive picture of economic growth momentum entering April 2026, potentially confirming or revising preliminary estimates that have shaped recent market expectations. While final GDP figures rarely surprise dramatically, any meaningful revision could influence Federal Reserve policy expectations, especially if growth appears stronger or weaker than initially reported. Thursday's dual focus on both inflation trends and economic output sets up a potentially volatile session as traders position ahead of Friday's comprehensive CPI data release.
Market Sentiment and Key Levels
Bulls seized decisive control as SPY's impressive 2.55% surge demonstrated strong institutional buying conviction, while the VIX's dramatic 17.15% collapse to 21.36 signaled a meaningful reduction in fear and uncertainty that had previously gripped market participants. The substantially elevated trading volume of 87.29 million above average confirmed broad-based participation in the rally, suggesting this advance represents more than just technical repositioning as buyers aggressively stepped in across multiple price levels throughout the session.
Key resistance for SPY materializes at today's high of $677.08, where momentum began to stall after the strong morning advance, with more significant overhead pressure building near the $680-685 psychological zone where profit-taking could intensify if bulls attempt to extend these gains into year-end. Support now anchors at the session low of $671.50, representing the level where early buyers defended against any pullback attempts, with stronger foundational support emerging around $665-668 where yesterday's action concluded and institutional interest previously accumulated. A sustained breakout above $677.08 could unleash momentum-driven buying targeting the $680-690 corridor as short covering accelerates, while any failure to maintain support above $671.50 might invite tactical profit-taking back toward the $665-670 zone where longer-term buyers could reassert themselves.
Current market dynamics reflect renewed optimism as participants appear increasingly confident that recent headwinds may be moderating, though bulls must prove this rally can sustain beyond typical year-end positioning effects. The challenge ahead involves maintaining this bullish momentum against potential headwinds from yield fluctuations and energy market volatility that could resurface, particularly as institutional flows and economic data releases continue shaping sentiment into the new year.
Expected Price Action
Our actionable intelligence generated by our AI model projects SPY will trade within an extraordinarily wide range on Thursday, with the projected trading band spanning from $670 on the downside to $685 on the upside. This massive $15 range signals the market will trend rather than consolidate, as participants continue to process Wednesday's dramatic reversal and position for potential follow-through moves. The model identifies $678 as the critical bias level that will determine Thursday's character, with Wednesday's close below this threshold despite the session's powerful rally creating an interesting technical setup.
The upside appears to offer the most compelling opportunity given Wednesday's momentum shift and positioning near the bias level. The model anticipates sustained buying pressure could push SPY above the $678 bias level early in the session, targeting $680 as the primary resistance zone with potential extension toward the $685 upper boundary if momentum participants join the move. However, any failure to hold above $678 would shift the technical picture significantly, with initial support testing expected at $675 followed by stronger buying interest anticipated near the $670 floor.
Thursday's session will pivot on whether the market can generate sufficient follow-through to break decisively above the bias level or if profit-taking pressures from Wednesday's oversized move force a retreat toward lower support zones. The model emphasizes that while the wide projected range suggests trending action rather than consolidation, the extreme volatility environment makes sustained directional moves challenging to maintain. Any meaningful developments regarding the underlying catalysts that drove Wednesday's reversal could amplify these projections, making nimble positioning essential given the current market's propensity for rapid sentiment shifts.
Trading Strategy
Following today's robust recovery rally, the $677-$678 resistance zone offers prime short opportunities targeting retracement toward the $671-$673 support cluster with extended objectives around $668-$670 if profit-taking emerges through established ceiling levels. Initiate bearish positions on any rejection attempts near current highs with protective stops above $680 to capture potential distribution while limiting upside exposure through proven resistance structures. The VIX dropped 17.15% to 21.36, signaling a substantial decline in fear levels that suggests market confidence is returning, though traders should remain cautious as the elevated reading still indicates underlying tension beneath today's strong performance.
For bullish positioning, any weakness toward the $671-$673 support band presents compelling long entries targeting $677-$680 resistance with extended objectives toward $684 if buyers can establish control through overhead supply zones. Focus on the $672-$673 area specifically for optimal risk-reward setups with protective stops below $670 to maintain disciplined downside protection while positioning for potential continuation from proven support territory. The significant volatility compression creates favorable conditions for directional trades, though the fear gauge reduction suggests institutional positioning may be stabilizing despite the need to monitor momentum sustainability.
Risk management protocols should emphasize 4-5 point stop distances from entry points while maintaining standard position sizing given the improving volatility environment that typically accompanies sustained directional moves. The $673 level remains critical floor territory that must hold for any bullish continuation scenarios, while sustained weakness below this threshold could trigger accelerated selling toward the $668-$670 zone representing next logical support cluster. Monitor the $677-$678 resistance band closely for volume-confirmed breakouts, as the compressed volatility environment suggests either $684 upside targets or $668 downside objectives could materialize steadily depending on institutional flow patterns and continued fear gauge normalization.
Model’s Projected Range
SPY's projected maximum range for Thursday is $668 to $683, with the Call side dominating in an expanding band that suggests trending price action with intermittent chop. Thursday brings Core PCE Price Index m/m and Final GDP q/q, which are likely to produce significant volatility particularly in the first hour of trading. Wednesday's session saw SPY close at $676.06, up 2.55%, after opening at $676.39 and trading between a high of $677.08 and low of $671.50 in what was a solid recovery day that built on morning strength. SPY is trading near our model's first support at $675, with markets continuing to digest recent geopolitical tensions and their potential impact on risk sentiment. Looking ahead to Thursday's action, a break above the first resistance at $680 would target $683, while a break below the first support at $675 would target $670, and if the lowest support at $668 breaks there is little to keep price from falling toward $660. The long-term bull trend remains intact above $640, and as long as price holds above key structural levels, this remains a broader dip-buying environment. Absent a catalyst, resistance sits at $680, $683, $685, $690, while support rests at $675, $670, $668, $665. We favor buying dips at $675 given SPY's position near support within the projected range. Bitcoin showed modest weakness, down 0.75% to close above $71,403, while MAG stocks posted a mostly green day across the board led by Meta up 6.50% with the exception of Tesla down 0.98%, and this mixed leadership suggests some sector rotation but overall constructive action. The VIX closed at 21.36, down 17.15%, suggesting a significant reduction in fear as markets found their footing after recent volatility. SPY closed in the middle of a redrawn bear trend channel with structural support near $626 remaining the critical level to watch for any deeper correction.
Market State Indicator (MSI) Forecast
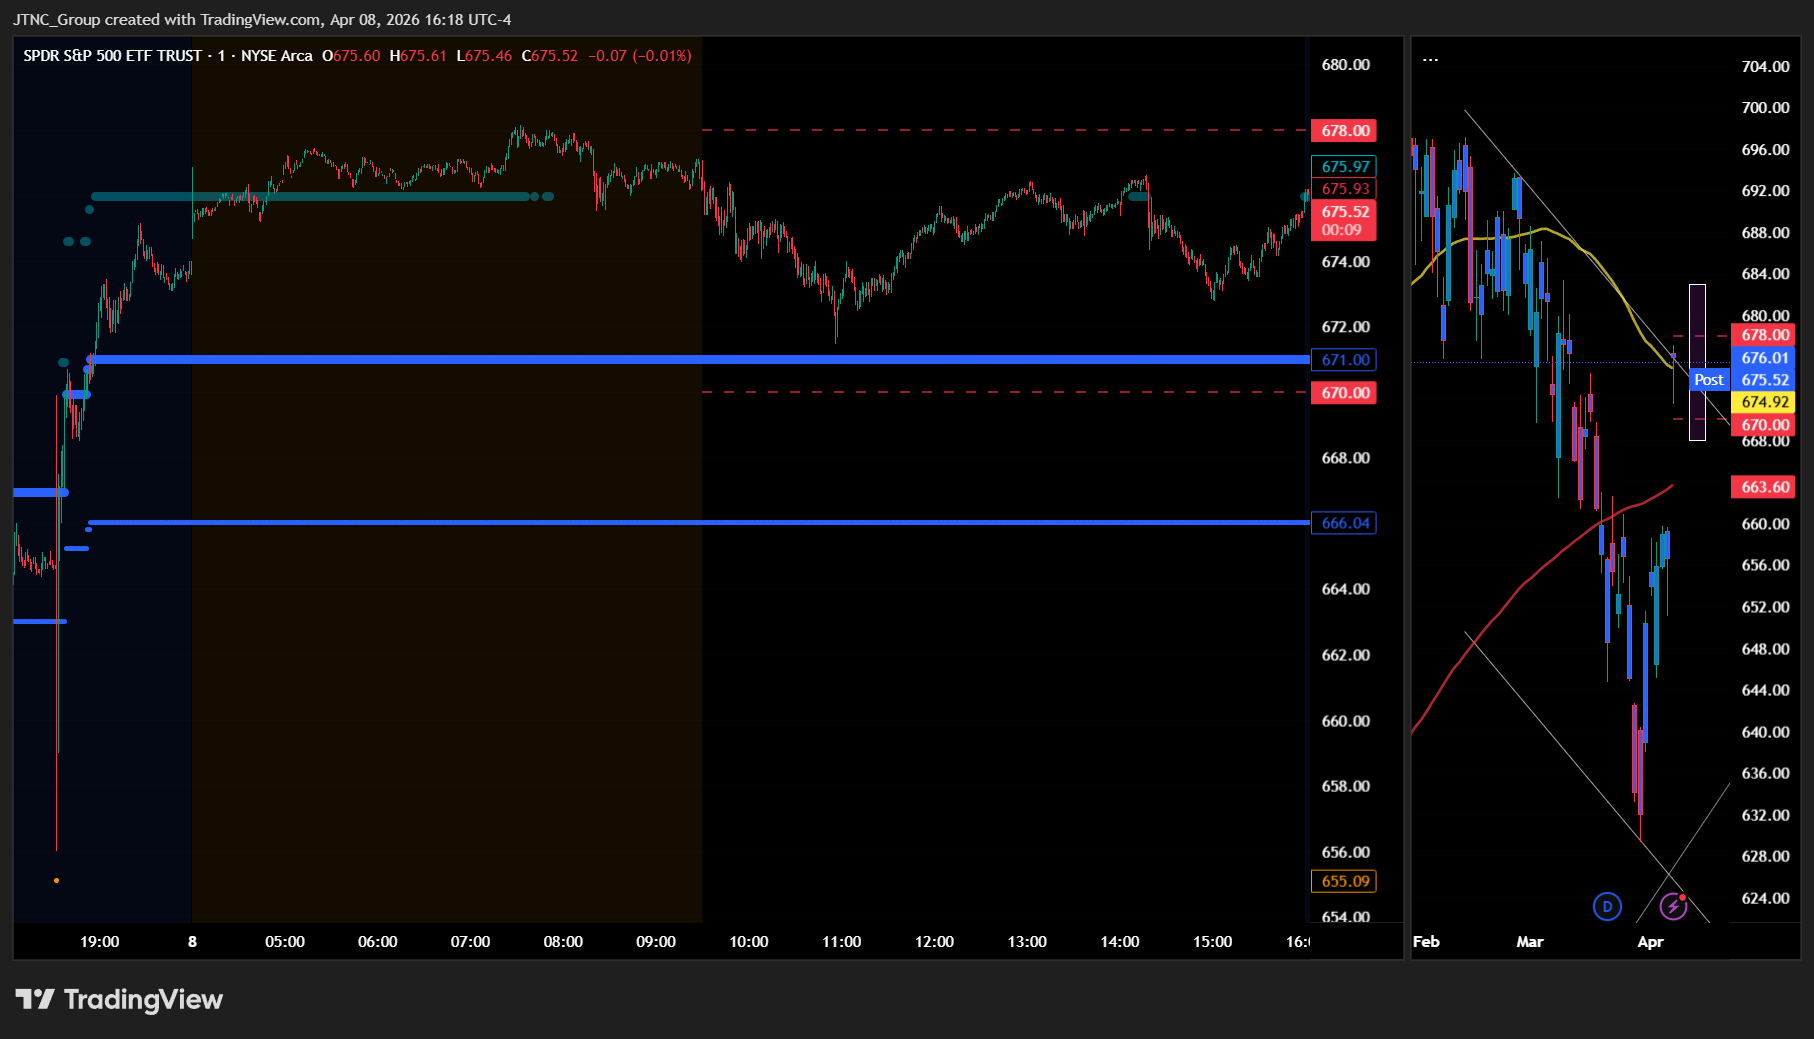
Current Market State Overview:
The MSI ended Wednesday in a Bullish Trending Market State with SPY closing at $676.06. Since SPY closed above MSI resistance, the former MSI resistance at $671 now becomes support for Thursday's session with resistance at $666.04. Extended targets were not printing at the close, though extended targets were visible above in premarket. The MSI rescaled higher overnight several times in a bullish trending market state so by the open, was in a narrow bullish trending market state that lasted the entire day. Extended targets overnight pushed price to $678. With SPY above MSI resistance, this is now support. Without any extended targets at the close or for most of the day today its likely the market moves a bit more sideways with the MSI forecasting slightly higher prices but ones that will likely remain in a range. The narrow $4.96 spread between the MSI levels shows price has established room for movement within the bullish framework while maintaining clear directional bias. Wednesday's session demonstrated strong upward momentum as the market built on overnight strength to close decisively above the MSI range after multiple rescaling events that created a sustained bullish framework throughout the day. The MSI forecast for Thursday calls for a slow grind higher, though without extended targets at the close the move may be modest and is likely to find resistance at key levels above. MSI support is $671 with resistance at $666.04.
Key Levels and Market Movements:
Tuesday we stated, "Bulls want to hold current levels overnight and push toward $662," and added, "Given the moderate $1.81 MSI spread and Tuesday's decisive move above the MSI range, Wednesday is expected to see a slow grind higher," while also noting, "The moderate spread indicates price has room to move within the bullish framework, though the MSI may rescale depending on overnight action and the FOMC Minutes release." Wednesday's session exceeded the bullish expectations as the market opened at $676.39 and sustained upward pressure throughout the day, reaching an intraday high of $677.08 well above the target $662 level. The MSI rescaled higher overnight several times, creating a narrow bullish trending framework that provided clear structure for the entire session. Extended targets were visible above in premarket, signaling strong bullish intention that carried through as SPY pushed to $678 before settling back to close at $676.06. The primary setup was buying any dip toward the evolving MSI support levels as the narrow bullish trending state provided clear directional bias throughout the session. Bulls maintained decisive control from the opening bell, with SPY never threatening the lower boundaries of the MSI range despite hitting a session low of $671.50 that coincided perfectly with MSI support. At minimum it was a one-for-one session for traders following the framework as the MSI provided clear bullish signals with the narrow trending state offering straightforward long opportunities within the established structure. It was an easy day to read and execute with substantial setups, all identified through proper context, patience, and flexibility while leveraging the MSI, premarket levels, and market structure rather than forcing trades. The MSI continues to prove its reliability as the cornerstone of our trading process.
Trading Strategy Based on MSI:
Thursday has heavy economic data with Core PCE Price Index and Final GDP which can introduce significant volatility, so traders should be ready to trade what they see rather than predict. Bulls want to hold current levels overnight and push toward $680, while bears want to see the $671 support fail to press price toward lower levels around $668. Given the wide $4.96 MSI spread and Wednesday's decisive move above the MSI range, Thursday is expected to see a slow grind higher, though without extended targets at the close the move may be modest and is likely to find resistance at key levels above. The wide spread indicates price has substantial room to move within the bullish framework, though the MSI may rescale depending on overnight action and the economic data releases. With SPY having closed above MSI resistance at $671, any pullback to test this level becomes a key buying opportunity where bulls need to defend decisively to maintain the upward momentum. A successful test and hold at $671 would offer a long setup targeting higher levels around $680, while any breakdown below $671 with volume would signal a potential shift back into the MSI range and present a shorting opportunity targeting the former resistance at $666.04. The wide MSI spread with no extended targets at the close indicates measured bullish momentum rather than exhaustion, and any move toward either boundary should be respected given the economic data catalysts. Bulls need to defend $671 decisively to maintain momentum, while bears want to see any rally fail and price break back below the support level to regain control. Any failure of MSI support is likely to see SPY retest the session lows while any successful hold above $671 with volume confirms the bullish framework and targets further upside beyond current levels. The long-term bull trend remains intact above $640 and failed breakouts and failed breakdowns continue to offer the highest-probability setups. Remain flexible, avoid trading during Ranging Market States unless a clear failed breakout or breakdown presents itself, and ensure all trades are fully aligned with MSI signals. Providing real-time insights into market control, momentum shifts, and actionable levels, the MSI when integrated with our Pre-Market and Post-Market Reports continues to sharpen execution precision and elevate trade quality. If you haven't yet integrated MSI and our model levels into your process, now is the time. Contact your representative to get started as these tools are designed to support consistency and enhance performance.
Dealer Positioning Analysis
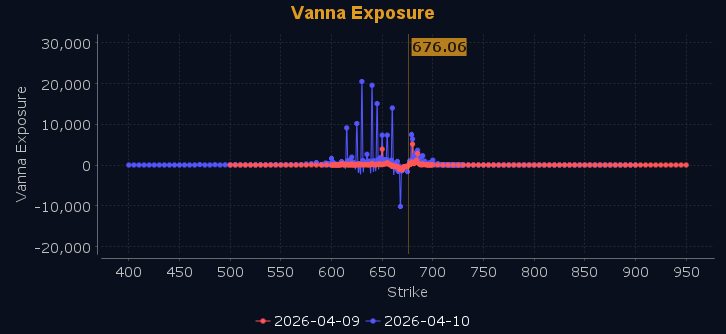
Dealers are selling SPY $677 to $700 and higher strike Calls, indicating the Dealers' belief that higher prices may be in store. The ceiling for Thursday appears to be $680. To the downside, Dealers are selling $676 to $660 Puts while buying $659 to $611 and lower strike Puts in a 2:1 ratio to the Calls they're selling displaying that they are selling ATM Puts in size which indicates their belief that prices will continue higher on Thursday. Dealers do not sell ATM Puts unless they believe there is a floor in the market at $670. This shift in dealer positioning reflects their growing confidence that upside momentum may continue, though they still see resistance around the $680 level. Dealer positioning is unchanged at neutral/slightly bearish.
Looking Ahead to Next Friday:
Dealers are selling SPY $677 to $700 and higher strike Calls, indicating the Dealers' belief that higher prices may be in store. The ceiling for the week appears to be $679. To the downside, Dealers are selling $676 to $668 Puts while buying $667 to $585 and lower strike Puts in a 3:1 ratio to the Calls they're selling displaying that they are selling ATM puts in size indicating their belief that this week the market will continue to move higher but remaining below $680. Dealers do not sell ATM Puts unless they believe there is a floor in the market at $668. They have established a floor at $668 and a ceiling for this week of $679 but having blown right through the 200 DMA higher prices are likely absent an external catalyst. For the week Dealer positioning is unchanged at neutral/slightly bearish. We advise reviewing Dealer positioning daily for directional clues. These positions evolve quickly and tracking them is essential for staying ahead of shifting market sentiment.
Recommendation for Traders
With SPY closing at $676.06 after a strong 2.55% rally and the VIX dropping 17.15% to 21.36, traders can look for continuation plays above $677 resistance or profit-taking opportunities near current levels. The heavy volume suggests institutional participation, but maintain disciplined risk management given the market's recent volatility patterns.
Keep position sizes reasonable and use tight stops as market conditions can shift quickly. Review the premarket analysis posted before 9 AM ET for any changes in the model's outlook and Dealer Positioning.
Good luck and good trading!
