Market Insights: Tuesday, April 8th, 2025
Market Overview
Markets took another blow Tuesday as the tariff war narrative intensified, pushing the S&P 500 dangerously close to bear market territory. Stocks had started the day strong, but a fresh announcement from the White House erased early optimism. By day’s end, the Dow lost 300 points, dropping 0.84%, while the S&P gave up a sharp 4% gain to finish down 1.6%. The Nasdaq was hit the hardest, down 2.2%. The trigger? A confirmed plan from the administration to move forward with escalating tariffs, hiking the total rate on Chinese goods to a whopping 104%, effective at 12:01 a.m. ET Wednesday. That news squashed any lingering hopes of a delay and sent equities tumbling into the close.
Tuesday’s price action was extreme—yet again. This is only the fourth time in history markets have seen three straight sessions of 6%+ volatility: joining the infamous club of 1987, the 2008 financial crisis, and the COVID-19 pandemic lows. Adding to the fire, press secretary Karoline Leavitt said, “President Trump has a spine of steel and he will not break,” echoing the administration’s hard stance. Even as buyers tiptoed back into the market in the morning, bolstered by Treasury Secretary Scott Bessent’s comments about positive developments in talks with Japan, that optimism was short-lived. China’s response? “We will fight to the end.” With both sides digging in, Wall Street’s fears grew louder. Leaders like Jamie Dimon and Larry Fink voiced concern, and even Elon Musk offered public critiques. It’s becoming clear that without a major shift in tone, volatility will continue to dominate the landscape.
SPY Performance
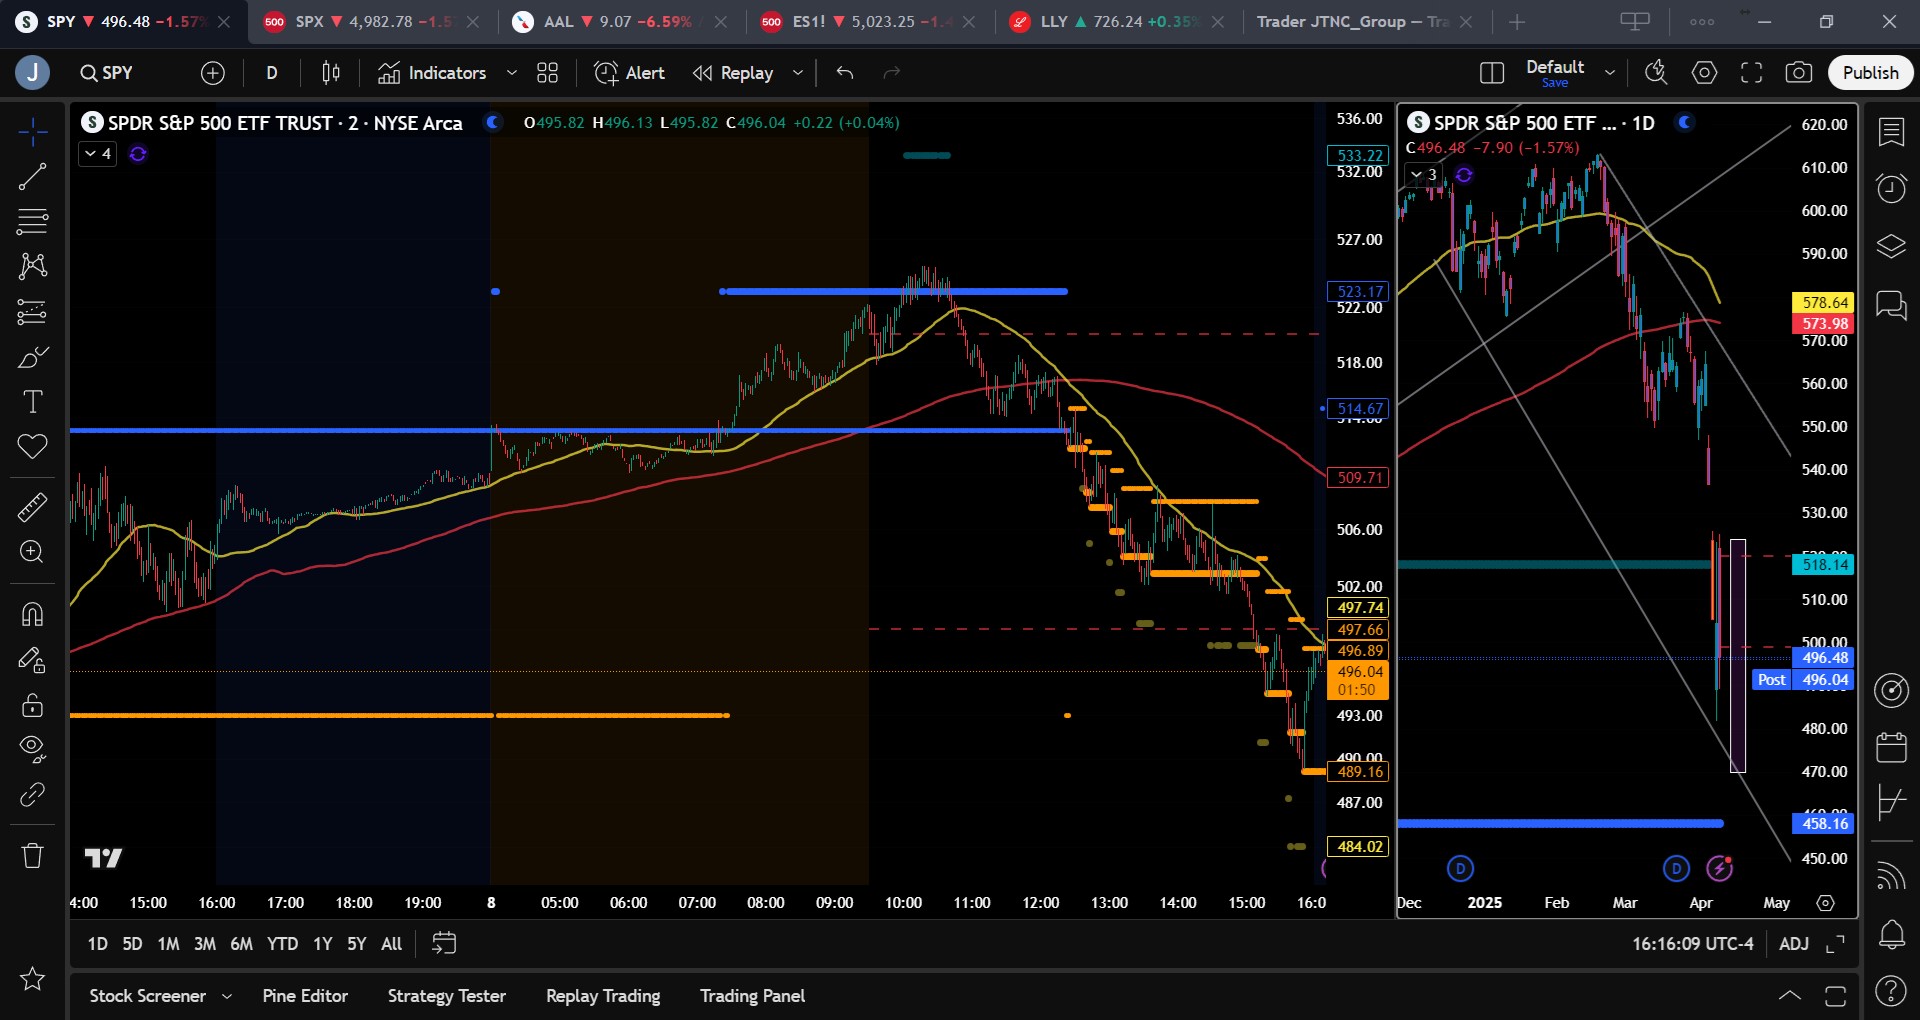
SPY closed Tuesday down 1.53% to finish at $496.68 after an absolutely wild trading day. Opening at $521.98, it briefly touched $524.98 before plunging as low as $489.17, reflecting a staggering intraday swing of over $35. Volume came in at 153.99 million shares—triple the average—proving once again how shaken this market remains. Despite early attempts at a breakout, sellers took firm control by midday, dragging SPY well below the critical $500 level. Though some stabilization occurred into the close, the bears kept their grip tight.
Major Indices Performance
All major indices were deep in the red, led lower by the Nasdaq, which shed 2.15% as tech was hit hard. The Russell 2000 followed, down 2.63%, reinforcing the ongoing risk-off sentiment in smaller caps. The S&P 500 lost 1.6% after giving up substantial early gains, while the Dow was the relative outperformer but still fell 0.84%—down just over 300 points. Early strength was wiped out by the confirmation of the 104% China tariff hike. No sectors found shelter, and even typically defensive names couldn’t escape the broad-based selling as investors braced for more pain ahead.
Notable Stock Movements
The Magnificent Seven were hammered again Tuesday, with Tesla leading the losers down more than 5%. Apple followed closely, off 4.79%, continuing to feel the heat from both China exposure and supply chain strain. The rest of the group struggled too, with only Netflix managing a barely positive close. These sharp declines underscore growing fears that tech is particularly vulnerable in a trade war environment. With rising rates, fading consumer demand, and geopolitical tension, megacap stocks are increasingly being used as liquidity sources—sold first, despite their longer-term potential.
Commodity and Cryptocurrency Updates
Crude oil tumbled another 3.43% to close at $58.65, breaking below our long-forecasted $60 level. Momentum continues to favor lower prices, and we now see potential for a dip to $50, where we would be buyers. Gold rose slightly, up 0.82% to $2,998, reflecting a mix of safe-haven interest and technical consolidation. Meanwhile, Bitcoin rallied 2.53% to close just above $76,900, outperforming most assets. We continue to buy between $83,000 and $77,000 and take profits above $85,000—but caution against buying below $77K as the downside risk grows.
Treasury Yield Information
The 10-year Treasury yield climbed 3.01% to close at 4.282%, reversing Monday’s sharp drop. While it remains under the danger threshold of 4.5%, any move above that could put more pressure on equities. Our model suggests the critical levels remain 4.8% and 5%, beyond which a 20%+ equity correction becomes highly likely. With inflation data and Fed commentary on deck this week, this yield will be critical to monitor.
Previous Day’s Forecast Analysis
Monday’s forecast projected a wide SPY range of $480 to $530, highlighting a bearish bias with possible sharp rallies. The model pointed to resistance at $508, $512, and $517, with major support at $500 and $498. It warned that any drop below $500 could send SPY quickly toward $485. The forecast clearly stated that bulls needed to reclaim $512 or risk losing control—and favored selling rallies over buying dips, especially in a high-volatility environment.
Market Performance vs. Forecast
Tuesday’s action delivered on the forecast in dramatic fashion. SPY opened at $521.98 and surged to $524.98 early, well within the projected resistance zone, before collapsing to $489.17—almost a full test of the lower edge of the model’s $480–$530 range. It ultimately settled at $496.68. Resistance at $508 and $512 held, while the sharp rejection from above $520 aligned with the projected short setups. The massive intraday swing and failed breakout at key levels offered strong trade opportunities for bears, validating the model’s emphasis on fading strength and watching for downside momentum below $500.
Premarket Analysis Summary
In Tuesday’s premarket analysis posted at 7:24 AM, SPY was trading at $513.15 with a bullish tilt so long as it held above $512. The projected upside targets were $517 and $520, with a note that headline-driven spikes could push price slightly beyond those levels. On the downside, support was expected at $512 and $510, with lower targets at $501.50 and $499 if sellers regained control. The guidance leaned toward long entries from support levels while cautioning that a break below $510 could lead to confused, choppy trading.
Validation of the Analysis
Tuesday’s session perfectly showcased the value of the premarket analysis. SPY opened above $521, reached $524.98—well beyond the $520 stretch target—and then sharply reversed. Once it lost the $512–$510 zone, sellers took full control, sending it straight through all downside levels to a low of $489.17. This aligned with the premarket note that failing to hold $510 could trigger a sharp selloff. Traders watching for failed breakouts above $520 or break below $510 had actionable setups that proved highly effective. The forecast once again provided highly accurate and timely insight.
Looking Ahead
Wednesday brings the FOMC Minutes, offering a glimpse into the Fed’s thinking amid rising inflation and ongoing tariff shocks. These minutes could shed light on whether the central bank will intervene if market turmoil escalates or stay the course. With CPI on Thursday and PPI plus sentiment data Friday, traders should expect renewed volatility starting midweek. Market positioning ahead of these events will be crucial, and reactions could be swift.
Market Sentiment and Key Levels
SPY closed at $496.68, sitting well below major resistance and testing the lower band of its descending bear channel. Market sentiment remains deeply bearish, with bulls once again failing to hold early gains. Resistance levels are now at $500, $503, $506, and $510, while support sits at $496, $494, and $490. A break below $488 could accelerate losses to yesterday’s lows and beyond. Until SPY reclaims at least $525 with conviction, bears maintain full control of momentum.
Expected Price Action
Our AI model forecasts a wide trading range of $470 to $524 for Wednesday, pointing to a continued trending environment. The bias remains bearish, and rallies are likely to be sold unless bulls can clear $510 and sustain above $512. Should SPY break above $512, a move toward $517 becomes possible, though gains will likely be capped. On the downside, a break below $488 could set up a swift test of $475, with a deeper target at $450 now on the radar. This is actionable intelligence in a high-volatility environment, and traders should expect sharp, reactive moves with limited follow-through unless macro news shifts sentiment.
Trading Strategy
Traders should expect another volatile session and prepare for two-sided price action. Long trades may work if SPY can reclaim $500 and hold above $503, targeting $506 and $510—but caution is warranted given the prevailing downtrend. Shorts remain the higher probability setup below resistance at $503 and $506, with targets at $496, $494, and $488. If price breaks $488, watch for a slide toward $475. With the VIX now at 52 and possibly spiking to 70 soon, volatility is extreme. Reduce size, widen stops, and avoid overexposure until markets stabilize. This is a time for disciplined trading, not heroics.
Model’s Projected Range
The model’s maximum projected range is $470 to $524, with the Put side dominating across a widespread, suggesting trending price action on Wednesday. SPY closed at $496 after another highly volatile session, with intraday price swings exceeding $35. These extreme moves are exceptionally difficult to predict or trade effectively. Volume surged to three times the average, underscoring the intensity of the move. Key resistance levels now sit at $500, $503, $506, and $510, while support lies at $496, $494, and $490. A break below $488 could pave the way for a retest of yesterday’s lows—and potentially lower levels. Conversely, a push above $512 faces minimal resistance until $517. However, the model has low confidence in these levels holding, given the severity of current external pressures on the market. As was the case yesterday, several of our systematic, automated strategies remain largely inactive, trading less than 1% of our book. Tariffs and inflation continue to dominate as primary market drivers, and there is little sign the downtrend will ease without clear policy guidance or negotiation from the current administration. The VIX closed at 52, and a spike to 70 in the coming days would not be surprising. Until the VIX closes below 35, we anticipate continued downward pressure. As such, all rallies should be sold, as bulls currently have no meaningful control over the market. SPY came close yesterday to testing the next major downside target at $475—a level that could be reached within the next day or two. Our model is currently forecasting a potential additional 10% drop, implying a target around $450. While this is a moving target and difficult to model precisely, it is a viable downside scenario. There is also a gap from 11/13/2023 at $442 that would likely be filled in such an environment. Given the current setup, we do not recommend buying dips. The broader bearish trend channel originating from the December highs has once again broken lower and has been redrawn accordingly. SPY is now trading along the lower boundary of this steeper, more volatile bearish formation. While the channel allows for movement in both directions, price action is expected to remain contained within it in the near term. Momentum is clearly in the bears’ favor.
Market State Indicator (MSI) Forecast
Current Market State Overview:
The MSI is currently in a Bearish Trending Market State, with price closing at resistance. There are no extended targets below. The MSI range is wide indicating a strong bear trend. But without extended targets, perhaps the market is looking for a base from which to move higher. Overnight price rallied and the MSI rescaled to a wide Bullish Trending Market State which briefly saw extended targets above after the open. This didn’t last long as price ran into major MSI resistance at $523.18 and soon thereafter, extended targets stopped printing. SPY then mean reverted and fell off a cliff with the MSI rescaling several times lower to a Bearish Trending Market State. While the ranges were not exceptionally wide, extended targets printed below for most of the afternoon session indicating the herd was participating in the sell off. Finally just before the close, extended targets stopped printing and SPY bounced off MSI support at $489.16 to close at MSI resistance. Currently MSI resistance is $497.66 and support is at $489.16.
Key Levels and Market Movements:
On Monday, we stated: “With dramatic swings happening minute to minute, having a directional lean is almost pointless. This is when you must trade what you see using the tools we provide.” We also said, “The bears remain firmly in control and will likely continue selling every rally attempt,” and reiterated, “Our core strategy remains: sell rallies into MSI resistance or major model levels—ideally between $520–$530.” Today was another challenging session, marked by extreme intraday volatility. But just like yesterday, we had a plan—and we stuck to it. As the relief rally extended into the open, we waited for extended targets to stop printing before initiating a short. Price was above a key premarket resistance level, sitting right at MSI resistance and within our ideal $520–$530 short zone. By 10:42 am, a less-than-perfect failed breakout presented and the rally stalled, with price cascading lower through every key level. We entered short at MSI resistance at $523, targeting MSI support at $513. SPY reached that level just after noon, at which point we moved our stop to breakeven and held for a deeper move. With the MSI beginning to rescale lower and printing fresh extended targets, the trade strengthened further. We looked to the premarket model and identified $499 as a viable second target, where we took another 20% of our position off. By 3 PM, with two major targets already hit, we held the remaining 10% until the MSI finally stopped printing extended targets ten minutes before the close. We exited at $493, capping off a massive trade that netted $148 per 10 shares—a gain of over 2.8% for the day. While we certainly don’t expect to do this every session, that kind of return—annualized—equates to over 500%. Interestingly, today’s trailing position generated more net profit than our first target, even though 70% of the position was taken off earlier. This is exactly why we trade this way: locking in gains incrementally, then giving the runners a chance to deliver outsized returns risk-free. This was an exceptional trade in a volatile, high-risk session that could easily shake even seasoned traders. But once again, the key was simple: have a solid plan, follow it with discipline, and let the MSI and model levels guide each decision. The MSI shows who’s in control, when that control shifts, and where key actionable support and resistance lie—empowering precise entries and exits. Paired with our model’s levels and daily strategy, it keeps us aligned with dominant market forces. MSI delivers this level of precision consistently—helping traders avoid danger, stay aligned with momentum, and take profits with confidence. We strongly recommend incorporating the MSI into your trading toolkit. When paired with a structured plan, it can be a powerful driver of long-term performance.
Trading Strategy Based on MSI:
Wednesday brings the release of FOMC minutes—typically a market-moving event—but in the current environment, the tariff situation is far more impactful. The market remains highly sensitive to any developments out of the White House. With China tariffs set to double unless Beijing rolls back the 34% tariffs announced Friday, there's a real chance the administration follows through, potentially triggering another violent market reaction. Today’s brief relief rally faded just as quickly as it appeared—unsurprising, given that nothing has fundamentally shifted in the broader macro picture. These are truly unprecedented conditions, among the most extreme and volatile in modern times. Price action can flip minute to minute, making any directional bias nearly irrelevant. This is exactly when you must trade what you see—using the tools we provide. Tuesday’s strategy remains in play: sell all rallies unless $535 is reclaimed. If yesterday’s lows break, there’s little technical support to halt a deeper slide. As we said Friday, “until the VIX closes below 35, we are not looking to catch a falling knife.” We expect more two-way trading on Wednesday. Like today, we’ll only consider long setups on failed breakdowns, and only if $480 continues to hold. The primary strategy remains: sell rallies into MSI resistance or major model levels—ideally between $520–$530. The bear trend remains intact, and the path of least resistance is still to the downside. Without a major external catalyst, we anticipate continued selling pressure. If $480 breaks, $475 becomes the next key level, and below that, $450 becomes a viable bear target. As we mentioned Friday, once full-blown capitulation hits, a sharp rebound toward $535 or beyond is likely—but until then, discipline is key. Lean on the tools: The premarket report integrates the latest data and AI-driven analysis to provide the most accurate, real-time guidance. Intraday, the MSI remains essential for navigating this chaos. If it stays bearish and continues printing extended downside targets, we’ll stay sidelined on longs. But if a surprise rally sparks another short squeeze, we’ll adapt—trading what we see, not what we think. Our model now projects a greater than 50% chance of SPY reaching $450, marking a 30%+ correction. While the market is overdue for a pause, there’s no clear sign of lasting stability. Bears remain firmly in control, likely continuing to sell into every rally attempt. Keep a close eye on the MSI. It offers critical, real-time insights that help traders stay in sync with dominant trends. Respect extended targets—they reflect powerful herd behavior and momentum driven by conviction. Used alongside our model levels, the MSI keeps you on the right side of the trade. If you’re not already leveraging these tools, now is the time. Connect with your rep—they’re game changers in navigating volatility like this.
Dealer Positioning Analysis
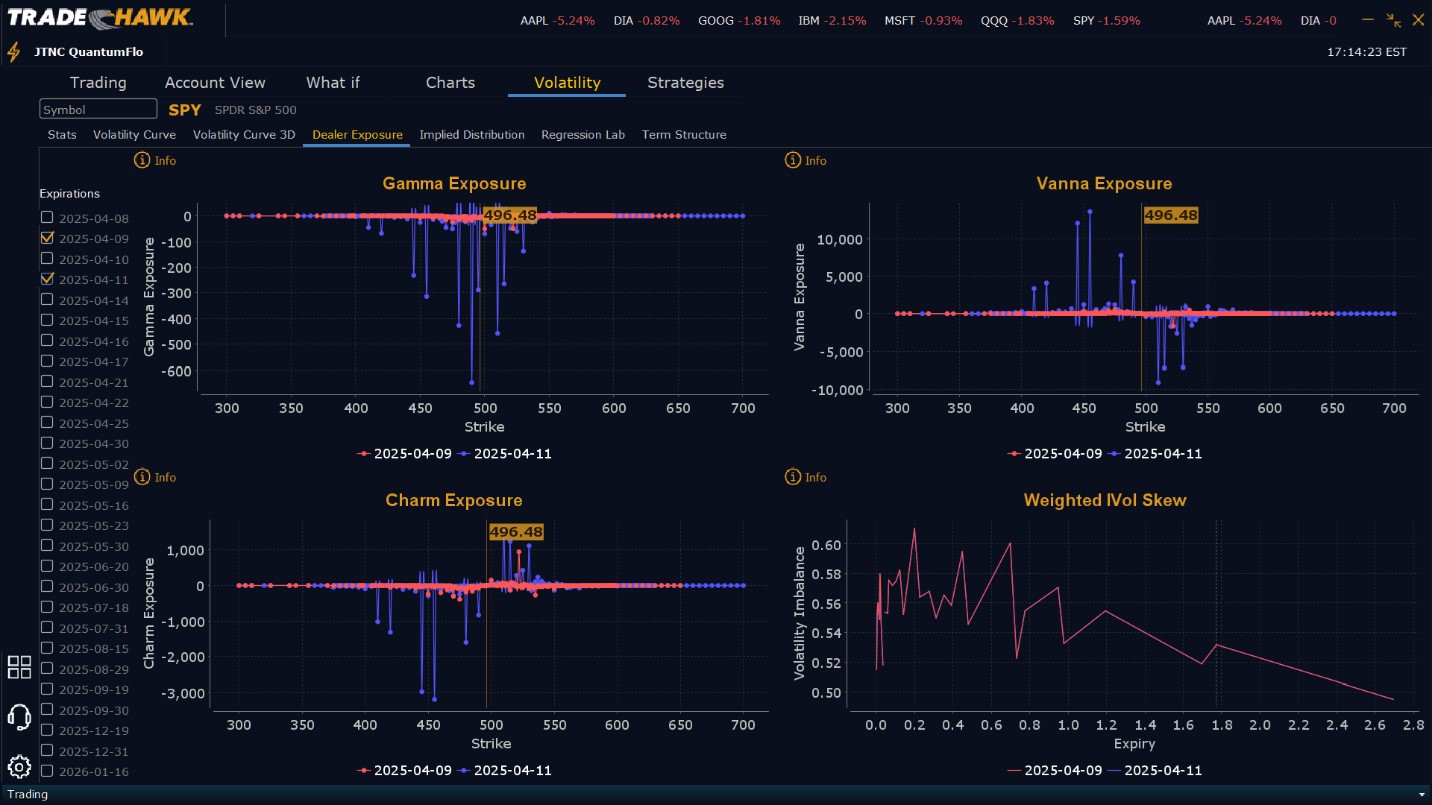
Summary of Current Dealer Positioning:
Dealers are selling $497 to $550 and higher strike Calls while also buying $500 and $522 Calls indicating the Dealers desire to participate in any rally above $500 and again, above $522. They also seem to believe no matter what happens, price will not move beyond $535 on Wednesday. To the downside Dealers are buying $496 to $450 and lower strike Puts in a 1:1 ratio to the Calls they are buying/selling, implying a neutral posture for Wednesday. This positioning is unchanged from today remaining neutral to neutral.
Looking Ahead to Friday:
Dealers are selling $532 to $570 and higher strike Calls, while buying $497 to $531 Calls signaling their desire to participate in any relief rally this week. Dealers have bought large quantities of Calls which reinforces this belief. Dealers continue to believe either tariffs will be negotiated or a relief rally will develop by the end of this week. To the downside, Dealers are buying Puts from $496 to $410 and lower in a 3:2 ratio to the Calls they’re buying/selling. This reflects a neutral outlook for the week. Dealer positioning has changed from slightly bullish to neutral. Dealers hold large amounts of downside protection and are adding to it every day. But seemingly they are positioning for the possibility of a short covering rally later this week. We advise reviewing Dealer positioning daily for directional clues. These positions evolve quickly, and tracking them is essential for staying ahead of shifting market sentiment.
Recommendation for Traders
The market once again moved in a massive range—rallying hard early, only to drop just as quickly. Major resistance was confirmed at $520, and with bulls needing to reclaim $535 to have any real shot at a sustained move higher, the odds remain firmly stacked against a bullish breakout without a significant external catalyst. Relief rallies can occur at any time, but we continue to advise selling into strength as they develop. If you choose to trade the long side, do so with small size and tight stops. Our model still suggests the selloff isn’t over, now targeting a move to $450—or slightly lower. It views current volatility as the early stages of an escalating trade war, with further retaliatory moves expected. Looking ahead to Wednesday: a break below $480 could quickly lead to $475, and possibly much lower as downside momentum accelerates. While a brief consolidation or bounce toward $520 is possible, we continue to favor selling into strength over fighting the prevailing downtrend. Bulls should remain on the sidelines unless $535 is decisively reclaimed—something that appears unlikely in the near term. In this environment, capital preservation is key. Stay cautious: trade small, protect the downside, and remain flexible. Your edge here lies in reacting to price, not trying to predict it. Focus on failed breakout or breakdown setups near key technical levels—especially when confirmed by the MSI. These often offer the best risk/reward opportunities. Counter-trend trades should be limited to moments when price is testing major levels and broader conditions align in your favor. Stay nimble. Stay disciplined. The bears remain in control—for now—but sentiment can shift quickly. As always, check our premarket analysis before 9:00 AM ET for updated levels and actionable signals.
Good luck and good trading!
