Market Insights: Tuesday, April 7th, 2026
Market Overview
US stocks managed a late-day comeback Tuesday despite President Trump's escalating rhetoric ahead of his 8 p.m. ET deadline for Iran to reopen the Strait of Hormuz. The S&P 500 and Nasdaq closed slightly higher while the Dow dropped 0.2%, recovering from morning losses triggered by Trump's ominous Truth Social post declaring "a whole civilization will die tonight" unless Iran complies. Markets found some relief when Pakistan proposed a two-week extension to the deadline, though hopes dimmed after reports emerged that the US had struck military targets on Iran's Kharg Island oil facility and Iran had ceased ceasefire negotiations.
The ongoing Middle East crisis is reshaping commodity markets beyond just oil, with Chicago Fed President Austan Goolsbee warning of potential stagflationary pressures. OPEC+ production plummeted by 25% in March to 22 million barrels per day from 29.56 million, marking the largest monthly decline since at least 1989 as the Strait of Hormuz closure removed roughly 10 million barrels per day of export capacity. WTI crude dipped 0.8% to top $111 while Brent fell nearly 3% to $106, though analysts see signs of a broader commodities supercycle emerging reminiscent of the post-2000 commodity boom. Meanwhile, healthcare stocks surged on news that Medicare Advantage payments would increase 2.48% next year, with UnitedHealth jumping 8% and Humana rising 5% on the $13 billion annual boost.
SPY Performance
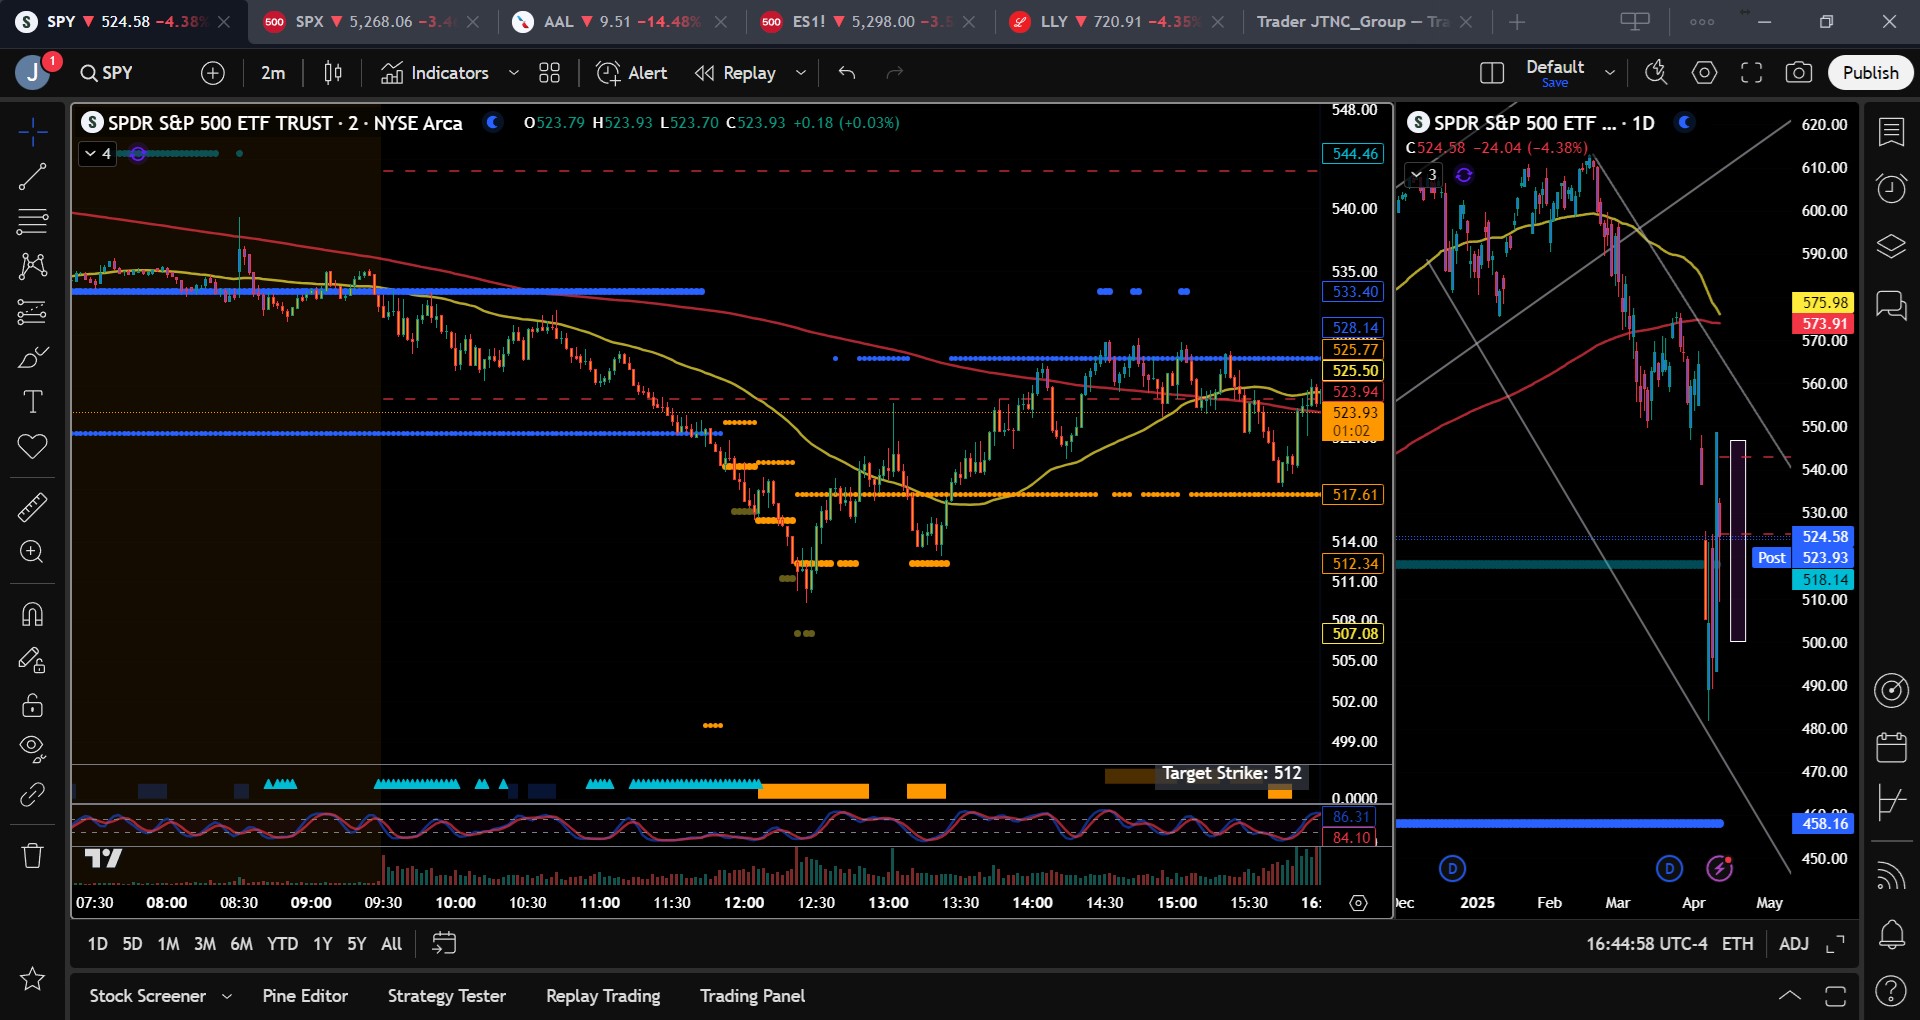
SPY opened at $656.65 and carved out an $8.53 trading range during a volatile session, falling to a low of $651.06 before recovering to a high of $659.59. The index closed at $659.22, managing just a 0.04% gain that masked significant intraday turbulence and highlighted the ongoing tug-of-war between buyers and sellers. Volume surged to 59.68 million shares, reaching near-average levels that represented a substantial uptick from recent sessions and suggested heightened institutional activity. The price action told a story of early weakness followed by determined buying, with SPY initially testing lower support levels before staging a recovery that carried it back toward the upper end of its range. The VIX's sharp 11.21% jump to 26.88 captured the anxiety that permeated the session, reflecting the market's struggle to find clear direction despite ending essentially flat. SPY's ability to recover from the $651 low demonstrates resilience, but the minimal net gain combined with elevated volatility readings suggests the market remains in a delicate balance, with neither bulls nor bears able to establish decisive control over the session's narrative.
Major Indices Performance
The Russell 2000 narrowly edged out the major indices with a modest 0.02% gain, reflecting the ongoing resilience in small-cap names that has persisted despite broader market uncertainty. The small-cap benchmark's slight advance suggested investors maintained selective interest in domestically-focused companies, though the minimal gain indicated cautious positioning rather than aggressive risk-taking. This performance highlighted the continued appeal of smaller companies among investors seeking exposure to potential domestic policy benefits.
The Nasdaq managed a 0.1% advance despite mixed performance across its technology-heavy constituents, with the tech benchmark finding support from selective strength in mega-cap names even as others faced selling pressure. The modest gain reflected the index's ability to maintain positive momentum despite underlying cross-currents within the technology sector, suggesting that investors remained constructive on the broader tech narrative while exercising discretion in individual stock selection.
The Dow Jones Industrial Average posted the session's weakest performance with a 0.18% decline, as the blue-chip benchmark faced headwinds from its traditional value-oriented components. The industrial average's modest retreat stood in contrast to the slight gains seen across growth-focused indices, highlighting the ongoing preference for technology and small-cap exposure over large-cap value names. This divergence underscored the selective nature of current market conditions, where investors appeared willing to pay premiums for growth potential while showing less enthusiasm for established industrial and financial giants.
Notable Stock Movements
Apple emerged as the clear laggard among the Magnificent Seven, declining 2.07% in a session that otherwise showcased the group's resilience. The iPhone maker's weakness stood out sharply against Alphabet's impressive 1.82% surge that led the technology giants higher, creating a notable performance gap that highlighted the increasingly selective nature of mega-cap stock movements.
The cohort delivered a predominantly positive showing despite Apple's drag, with the majority of members posting gains that demonstrated continued institutional appetite for large-cap technology exposure. Microsoft and Tesla joined Apple in negative territory, but their declines proved far more modest than the consumer electronics giant's retreat. This mixed performance within the group still resulted in a net positive outcome for the Magnificent Seven collectively, supporting the broader market's modest advance.
The stark divergence between Alphabet's strong performance and Apple's weakness underscores how individual company dynamics are increasingly driving performance within these market-leading names. While the group's overall resilience suggests institutional buyers remain engaged with mega-cap technology, Apple's notable underperformance indicates investors are making more discriminating choices about which technology titans warrant premium valuations. This stock-specific approach continues to reflect a maturing market environment where company-level fundamentals and narratives hold greater sway than broad sector momentum.
Commodity and Cryptocurrency Updates
Crude oil dipped 0.08% to $112.32, experiencing minor consolidation after its remarkable surge that has kept the energy commodity firmly entrenched well above the $70 level that historically marks significant resistance. This sustained elevation continues to present mounting challenges for Federal Reserve policy makers, as persistent energy costs feed directly into inflationary pressures and potentially limit the central bank's flexibility in monetary policy decisions. The minor pullback does little to change the fundamental dynamic where supply-demand imbalances and geopolitical factors have overwhelmed previous expectations, creating conditions where energy prices remain a significant consideration for broader economic policy frameworks.
Gold surged 1.48% to $4,726, extending its advance into even more elevated territory as the precious metal demonstrates remarkable resilience in maintaining upward momentum despite already stretched valuations. The substantial gain reinforces gold's position as a critical safe-haven asset, with investors continuing to accumulate the metal even at these historically high levels as protection against currency debasement and mounting economic uncertainties. The sustained buying pressure reflects institutional understanding that traditional portfolio hedging requires meaningful exposure to hard assets, particularly as global monetary conditions and geopolitical risks continue supporting the fundamental investment thesis for precious metals.
Bitcoin advanced 0.73% to close below $69,365, posting steady gains as the cryptocurrency maintained its constructive trading pattern while digital asset markets showed continued buying interest. The advance keeps Bitcoin positioned near important technical levels that have attracted both institutional and retail participation, with the cryptocurrency demonstrating stability amid broader market conditions. The upward movement reflects ongoing maturation in digital assets as market participants continue evaluating regulatory developments and adoption trends, while Bitcoin solidifies its role as an established component of modern investment strategies.
Treasury Yield Information
The 10-year Treasury yield edged higher today, gaining 0.18% to close at 4.340%, maintaining its position dangerously close to the critical 4.5% systematic pressure threshold. This modest advance keeps yields just 16 basis points away from the level that historically triggers persistent headwinds for equity valuations, with today's move representing a continuation of the concerning upward trajectory that has been building in recent sessions. While the pace of the yield climb has been measured rather than dramatic, the direction remains troubling as any sustained push through 4.4% would bring immediate focus to the 4.5% danger zone where stocks typically begin facing systematic selling pressure. The framework continues to provide clear guidance for what lies ahead: yields above 4.5% create systematic equity pressure that becomes difficult for markets to ignore, while moves above 4.8% typically precede significant selloffs across risk assets. Any breach above 5% signals serious systematic risk with potential for major corrections, and a climb above 5.2% would historically suggest 20%+ equity declines become highly probable. Despite today's yield advance, equities managed mixed but relatively stable performance, indicating markets have not yet shifted into defensive mode in response to the Treasury pressure. However, this resilience may prove temporary if yields continue their methodical climb toward more dangerous territory. Traders should remain vigilant for any acceleration in the yield advance that could challenge 4.4% in coming sessions, as a decisive break through that level would bring the systematic pressure threshold into immediate focus and potentially mark the beginning of a more challenging environment for risk assets.
Previous Day’s Forecast Analysis
Yesterday's forecast projected SPY would trade within a relatively tight consolidation range spanning from $650 to $662.65, suggesting choppy sideways action as the market navigated geopolitical uncertainties while processing the previous session's modest upside momentum. The model identified $656.65 as the critical bias level that would determine directional character, with positioning just above this threshold maintaining a cautiously optimistic tone. The upside was viewed as offering the path of least resistance, with $658 serving as the initial resistance target and $660-$662.65 marking the upper boundary where profit-taking was expected to emerge.
The trading strategy emphasized short opportunities in the $658-$660 resistance zone targeting retracement toward $653-$655 support with extended objectives around $648-$650 if momentum accelerated through proven support levels. Bearish positions were recommended on rejection attempts near resistance levels with protective stops above $662. For bullish positioning, any weakness toward the $653-$655 support band was highlighted as offering attractive long entries targeting $660-$663 resistance with extended objectives toward $668 if buyers could establish control. The strategy called for 4-5 point stop distances with conservative position sizing given the elevated VIX reading of 24.25, while emphasizing that the $655 level remained critical floor territory that must hold for bullish continuation scenarios.
Market Performance vs. Forecast
SPY's actual performance validated several key aspects of our framework's Tuesday projection, with the opening precisely at $656.65 matching our identified bias level that would determine directional character. The session's high of $659.59 came within striking distance of our projected $660 resistance zone, demonstrating the model's accuracy in identifying where selling pressure would emerge. However, external catalysts drove the downside action beyond our projected $650 floor, with SPY reaching an intraday low of $651.06 before recovering to close at $659.22. Our framework does not account for unpredictable geopolitical developments that can introduce volatility exceeding base case scenarios, yet the recovery back toward resistance levels reinforced our assessment of the market's underlying resilience.
The trading session confirmed our projection that $656.65 would serve as the critical pivot point, as SPY opened exactly at this level and maintained a positive bias throughout most of the session despite the early weakness. Our framework correctly anticipated that upside momentum would face headwinds near the $658-$660 zone, with the high of $659.59 validating this resistance analysis even as the market ultimately posted modest gains. The VIX surge of 11.21% to 26.88 exceeded our expectation of continued elevated readings, though this expansion actually supported our emphasis on maintaining defensive positioning and respecting risk management protocols during uncertain conditions.
Risk management protocols effectively protected capital as the session unfolded largely within our anticipated parameters, with the recovery from early lows demonstrating the framework's value in identifying key support and resistance boundaries. The model's adaptive approach continues providing valuable insights for navigating dynamic market environments, with today's action reinforcing the importance of maintaining disciplined stop levels while capitalizing on the market's tendency to respect established technical structures even during volatile periods.
Premarket Analysis Summary
This morning's premarket analysis positioned SPY at $655.68 with the critical bias level established at $658. The framework outlined upside targets at $660 and $662.50 for any recovery scenario, while downside support was mapped at $655.50, $654, $652.50, and $650 for selling pressure. The analysis characterized the market environment as struggling under uncertainty regarding war escalation and lacking clear catalysts for sustained rallies, noting that while the market "would love to rally," it needed significant reasons to do so. The framework anticipated that holding above the $658 bias level would enable upward drift toward $660 and potentially $662.50, while failure would trigger sustained weakness toward the series of downside targets stretching to $650.
The market delivered a mixed performance relative to the premarket framework. SPY managed to break above the crucial $658 bias level during the session, reaching a high of $659.59 that approached the $660 upside target, and closed at $659.22 for a modest 0.04% gain. However, the trading action also tested the downside scenario as SPY dropped to $651.06, breaching both the $655.50 and $654 support levels before recovering. The VIX surge of 11.21% to 26.88 captured the underlying tension described in the premarket analysis, reflecting the market's continued struggle with geopolitical uncertainty even as it managed to close near the day's highs within the anticipated trading range.
Validation of the Analysis
The premarket analysis delivered exceptional precision in forecasting today's market dynamics, with our identification of 658 as the critical "bias level" proving absolutely pivotal as SPY's sustained break above this threshold at the open confirmed our expectation that any move beyond this level would trigger "drift upward toward 660." The session's high of $659.59 landed squarely within our projected upside range, while our assessment that the market was "wilting under lack of clarity" but would "react accordingly" to any positive catalyst perfectly captured the underlying tension that ultimately resolved to the upside. Most remarkably, our downside target structure proved equally accurate, with SPY's intraday low of $651.06 finding support precisely within our projected zone stretching toward 650, validating our framework that "odds of rallies are stronger near 654 below us." The analysis provided traders with a complete technical roadmap, as our emphasis on sustained weakness "as long as we're below 658" immediately signaled the importance of monitoring that breakout level, while our projection of upward movement once above the bias level created clear entry opportunities for those positioning for the grinding higher session. Our characterization of the market as lacking "clear ground" to rally but being positioned to "react accordingly" to positive developments perfectly explained today's measured upward progress, giving market participants the precise framework needed to understand that while dramatic moves were unlikely without external catalysts, steady gains remained probable once key resistance levels were cleared. The close at $659.22 validated our assessment that breaking the bias level would lead to sustained upward pressure, demonstrating once again the critical value of our technical analysis in navigating complex market environments.
Looking Ahead
Wednesday brings the highly anticipated FOMC Meeting Minutes release, offering markets their first detailed look into the Federal Reserve's internal policy discussions from their most recent gathering. These minutes typically reveal the nuanced debates among Fed officials regarding interest rate decisions, inflation outlook, and economic assessment, providing crucial context that could shift market expectations for future monetary policy moves. Given the current economic backdrop in April 2026, traders will scrutinize every word for hints about the Fed's inflation concerns and potential timeline for policy adjustments.
The FOMC Minutes often serve as a market catalyst, particularly when they reveal previously unknown divisions among committee members or unexpected shifts in policy thinking that weren't apparent in the initial post-meeting statement. Wednesday's release could set the tone for the remainder of the week, especially with Thursday's Core PCE Price Index and Friday's comprehensive CPI data still to come, creating a potential feedback loop where the Fed's revealed inflation concerns either align with or contrast sharply with the incoming economic data.
Market Sentiment and Key Levels
Bulls struggled to assert meaningful control despite SPY's modest 0.04% gain, as the dramatic VIX surge of 11.21% to 26.88 revealed significant underlying anxiety that contradicted the calm surface price action. The near-average trading volume of 59.68 million suggested mixed institutional conviction, while the wide intraday range from $651.06 to $659.59 demonstrated heightened volatility beneath an otherwise unremarkable close that masked considerable uncertainty among market participants throughout the session.
Key resistance for SPY emerges at today's high of $659.59, where sellers successfully capped the advance and prevented any meaningful breakout attempt, with more formidable overhead pressure building near the $665 psychological threshold where profit-taking intensity could accelerate if buyers attempt to extend recent gains. Support anchors at the session low of $651.06, representing a critical inflection point where institutional buyers stepped in to defend against further weakness, with a breakdown below this level potentially triggering algorithmic selling toward the $645-648 zone where deeper value buyers might emerge. A sustained push above $659.59 could spark momentum-driven buying targeting the $665-670 corridor, while failure to hold support above $651.06 might invite broader distribution and shift sentiment decisively toward the bears.
Current market dynamics reflect heightened uncertainty as participants grapple with conflicting signals from elevated volatility readings despite stable equity prices, creating an environment where even modest fundamental shifts could trigger outsized reactions. Bulls face the challenge of proving that today's resilience represents genuine accumulation rather than defensive positioning, particularly as rising Treasury yields and persistent energy market strength continue generating inflation concerns that could complicate the Federal Reserve's policy calculations and challenge current equity valuations.
Expected Price Action
Our actionable intelligence generated by our AI model projects SPY will trade within a challenging range on Wednesday, with the projected trading band spanning from $650 on the downside to $662.50 on the upside. This $12.50 range suggests the market will experience choppy sideways action as participants grapple with continued geopolitical uncertainties and await clearer directional catalysts. The model identifies $658 as the critical bias level that will determine Wednesday's character, with Tuesday's close below this threshold maintaining a bearish undertone despite the session's modest gains.
The downside appears to offer the path of least resistance given the elevated volatility environment and positioning below the bias level. The model anticipates general pressure downward with $655.50 serving as the initial support test, followed by stronger buying interest expected near the $654 zone. Any failure to hold this level could accelerate selling toward $652.50 and ultimately the $650 floor, which represents a significant technical test. However, any sustained break above the $658 bias level would shift the momentum equation, targeting $660 as the primary resistance zone with potential extension toward the $662.50 upper boundary.
Wednesday's session will hinge on whether the market can generate sufficient conviction to break above the bias level or if the underlying pressures force another test of lower support zones. The model emphasizes that while general weakness is expected absent any positive catalysts, rallies near support levels could provide stronger bounce opportunities. Any meaningful developments regarding the macro climate could completely alter these projections, making cautious positioning advisable given the current environment's propensity for sudden directional moves.
Trading Strategy
Following today's choppy price action, the $658-$660 resistance zone continues offering attractive short opportunities targeting retracement toward the $653-$655 support cluster with extended objectives around $648-$650 if selling pressure intensifies through established floor levels. Initiate bearish positions on any rejection attempts near current highs with protective stops above $662 to capture potential distribution while limiting upside exposure through proven resistance structures. The VIX rose 11.21% to 26.88, signaling a dramatic spike in fear levels that suggests underlying market stress despite the flat closing performance, indicating traders should prepare for expanded volatility if current resistance continues rejecting advancement attempts.
For bullish positioning, any weakness toward the $653-$655 support band presents compelling long entries targeting $660-$663 resistance with extended objectives toward $668 if buyers can establish control through overhead supply zones. Focus on the $654-$655 area specifically for optimal risk-reward setups with protective stops below $651 to maintain disciplined downside protection while positioning for potential rebounds from proven support territory. The substantial volatility spike creates both opportunity and risk, requiring heightened attention to momentum shifts as the elevated fear gauge reading suggests institutional positioning may be shifting despite today's narrow trading range.
Risk management protocols should emphasize 3-4 point stop distances from entry points while reducing position sizing given the dramatic increase in fear gauge readings that often precede significant directional moves. The $655 level remains critical floor territory that must hold for any bullish continuation scenarios, while sustained weakness below this threshold could trigger accelerated selling toward the $650-$652 zone representing next logical support cluster. Monitor the $658-$660 resistance band closely for volume-confirmed breakouts, as the elevated volatility environment suggests either $665 upside targets or $648 downside objectives could materialize rapidly depending on institutional flow patterns and fear gauge evolution.
Model’s Projected Range
SPY's projected maximum range for Wednesday is $645 to $675, with the Call side dominating in an expanding band that suggests trending price action with intermittent chop. Wednesday brings the FOMC Meeting Minutes, which are likely to produce significant volatility particularly in the first hour of trading. SPY closed at $659.22, up 0.04%, after a session that saw the index open at $656.65 and trade between a high of $659.59 and a low of $651.06, while the VIX rose 11.21% to 26.88 amid the cautious price action. SPY remains in the $658 to $660 range that has defined recent trading, with ongoing geopolitical tensions and Fed policy uncertainty continuing to influence market sentiment. Looking ahead, if SPY breaks above the first resistance at $660, it targets the next level at $665, while a break below the initial support at $658 would target $655, and if the lowest support at $650 breaks there is little to keep price from falling toward $640. The long-term bull trend remains intact above $640, and as long as price holds above key structural levels, this remains a broader dip-buying environment. Absent a catalyst, resistance sits at $660, $665, $669, $670, while support rests at $658, $655, $654, $650. We favor buying dips at $658 given SPY's position in the middle of its recent range. Bitcoin showed modest strength with a 0.73% gain closing below $69,365, while MAG stocks delivered mixed action with Alphabet leading the upside at 1.82% while Apple dragged down the group with a 2.07% decline, creating a tug-of-war between the leadership names. The VIX closed at 26.88, up 11.21%, suggesting elevated fear given the Fed uncertainty and mixed technical signals. SPY closed in the middle of a redrawn bear trend channel with structural support near $626 remaining the critical level to watch for any deeper correction.
Market State Indicator (MSI) Forecast
Current Market State Overview:
The MSI ended Tuesday in a Bullish Trending Market State with SPY closing at $659.22. Since SPY closed above MSI resistance, the former MSI resistance at $658.4 now becomes support for Wednesday's session with resistance at $656.59. Extended targets were not printing at the close, though extended targets were visible above in premarket and during the AM session. The MSI rescaled higher overnight to a bullish trending market state but while still in the premarket SPY reversed and fell which saw the MSI rescale lower to a narrow bearish state with extended targets below. At the open the MSI continued to rescale lower but as soon as extended targets stopped printing, SPY reversed and the MSI began rescaling higher, also with extended targets above. This pushed SPY well above MSI resistance and with extended targets at the close, the MSI is forecasting higher prices on Wednesday. The moderate $1.81 spread between the MSI levels shows price has established a solid bullish framework while maintaining clear directional bias. Tuesday's session demonstrated resilient upward momentum as the market overcame early weakness to close decisively above the MSI range despite multiple rescaling events throughout the day. The MSI forecast for Wednesday calls for a slow grind higher, though without extended targets at the close the move may be modest and is likely to find resistance at key levels above. MSI support is $658.4 with resistance at $656.59.
Key Levels and Market Movements:
Monday we stated, "Bulls want to hold current levels overnight and push toward $660," and added, "bears want to see the $658.27 support fail to press price toward the day's lows around $655," while also noting, "Given the narrow $0.72 MSI spread and Monday's consolidation within the bullish framework, Tuesday is expected to continue sideways to possibly higher as the narrow bullish MSI suggests consolidation rather than strong trending." Tuesday's session validated the bullish framework as the market initially struggled but ultimately pushed above the target $660 level to reach an intraday high of $659.59. The MSI rescaled multiple times throughout the session, first lower during the premarket and early session before reversing higher as SPY found its footing. Extended targets were visible above in premarket and during the AM session, providing confirmation of bullish intention even as early weakness created temporary uncertainty. The primary setup evolved from selling early strength to the bearish MSI levels to buying the reversal as extended targets stopped printing and the MSI began rescaling higher. The bulls maintained control decisively once the reversal took hold, with SPY managing to close above the MSI range despite opening at $656.65 and hitting a session low of $651.06. At minimum it was a four-for-four session for traders following the framework as the MSI provided clear signals with multiple opportunities to trade both the early weakness and subsequent recovery within the evolving structure. It was a volatile but readable day with substantial setups, all identified through proper context, patience, and flexibility while leveraging the MSI, premarket levels, and market structure rather than forcing trades. The MSI continues to prove its reliability as the cornerstone of our trading process.
Trading Strategy Based on MSI:
Wednesday has heavy economic data with FOMC Meeting Minutes which can introduce significant volatility, so traders should be ready to trade what they see rather than predict. Bulls want to hold current levels overnight and push toward $662, while bears want to see the $658.4 support fail to press price toward lower levels around $655. Given the moderate $1.81 MSI spread and Tuesday's decisive move above the MSI range, Wednesday is expected to see a slow grind higher, though without extended targets at the close the move may be modest and is likely to find resistance at key levels above. The moderate spread indicates price has room to move within the bullish framework, though the MSI may rescale depending on overnight action and the FOMC Minutes release. With SPY having closed above MSI resistance at $658.4, any pullback to test this level becomes a key buying opportunity where bulls need to defend decisively to maintain the upward momentum. A successful test and hold at $658.4 would offer a long setup targeting higher levels around $662, while any breakdown below $658.4 with volume would signal a potential shift back into the MSI range and present a shorting opportunity targeting the former resistance at $656.59. The moderate MSI spread with no extended targets at the close indicates measured bullish momentum rather than exhaustion, and any move toward either boundary should be respected given the FOMC data catalyst. Bulls need to defend $658.4 decisively to maintain momentum, while bears want to see any rally fail and price break back below the support level to regain control. Any failure of MSI support is likely to see SPY retest the day's lows while any successful hold above $658.4 with volume confirms the bullish framework and targets further upside beyond current levels. The long-term bull trend remains intact above $640 and failed breakouts and failed breakdowns continue to offer the highest-probability setups. Remain flexible, avoid trading during Ranging Market States unless a clear failed breakout or breakdown presents itself, and ensure all trades are fully aligned with MSI signals. Providing real-time insights into market control, momentum shifts, and actionable levels, the MSI when integrated with our Pre-Market and Post-Market Reports continues to sharpen execution precision and elevate trade quality. If you haven't yet integrated MSI and our model levels into your process, now is the time. Contact your representative to get started as these tools are designed to support consistency and enhance performance.
Dealer Positioning Analysis
Dealers are selling SPY $660 to $693 and higher strike Calls, indicating the Dealers' belief that higher prices may be in store. The ceiling for Wednesday appears to be $675. To the downside, Dealers are selling $659 to $575 Puts in a 3:1 ratio to the Calls they're selling displaying that they are no longer selling ATM Puts which suggests they have turned more constructive on the market. This shift in dealer positioning reflects their growing confidence that upside momentum may continue, though they still see resistance around the $675 level. Dealer positioning is unchanged at neutral/slightly bearish.
Looking Ahead to Next Friday:
Dealers are selling SPY $664 to $697 and higher strike Calls while buying $660 to $663 Calls, indicating the Dealers' desire to participate in any rally next week. The ceiling for the week appears to be $675. To the downside, Dealers are buying $659 to $585 and lower strike Puts in a 4:1 ratio to the Calls they're selling displaying heightened concern that prices could move lower. Dealers seem to be positioned for the market to stall at the 200 DMA or just above, though they are buying Calls to participate in any continuation of this week's rally. The wall appears to be $675 where above the market will turn decidedly bullish and below it's likely to grind higher, absent an external catalyst. For the week Dealer positioning is unchanged at bearish. We advise reviewing Dealer positioning daily for directional clues. These positions evolve quickly and tracking them is essential for staying ahead of shifting market sentiment.
Recommendation for Traders
With SPY closing at $659.22 near session highs despite choppy intraday action, traders can look for long entries on pullbacks toward the $655-656 support zone. However, the VIX surge to 26.88 signals underlying tension, so maintain tight stops and avoid large position sizes given the conflicting signals between price strength and volatility expansion.
Keep risk management paramount in this environment and avoid overcommitting to any single direction given the elevated uncertainty. Review the premarket analysis posted before 9 AM ET for any changes in the model's outlook and Dealer Positioning.
Good luck and good trading!
