Market Insights: Monday, April 6th, 2026
Market Overview
US stocks posted modest gains Monday as traders cautiously embraced signs of potential diplomatic progress in the escalating US-Iran conflict. The S&P 500 climbed 0.4%, the Dow added 0.3%, and the Nasdaq gained 0.5%, with markets recovering from overnight losses that followed President Trump's extended deadline for Iran to reopen the Strait of Hormuz by Tuesday 8 p.m. ET. Reports of a potential 45-day ceasefire plan from Pakistan and renewed diplomatic efforts provided enough optimism to lift equities, even as Trump warned of additional strikes on Iranian infrastructure if negotiations fail.
Oil markets remained the primary focus as crude prices seesawed before climbing in afternoon trading, with WTI futures rising above $112 per barrel and Brent approaching $110. The ongoing blockade of the Strait of Hormuz, which handles roughly 20% of global oil flows, has already pushed US gasoline prices to nearly $4.12 per gallon nationwide. JPMorgan analysts warned prices could hit $5 per gallon if the strait remains closed through mid-month, with some Asian countries already reporting fuel shortages and refinery shutdowns. California stations are already seeing prices near $6 per gallon as the energy crisis threatens to reignite inflation concerns just as the market was finding its footing.
SPY Performance
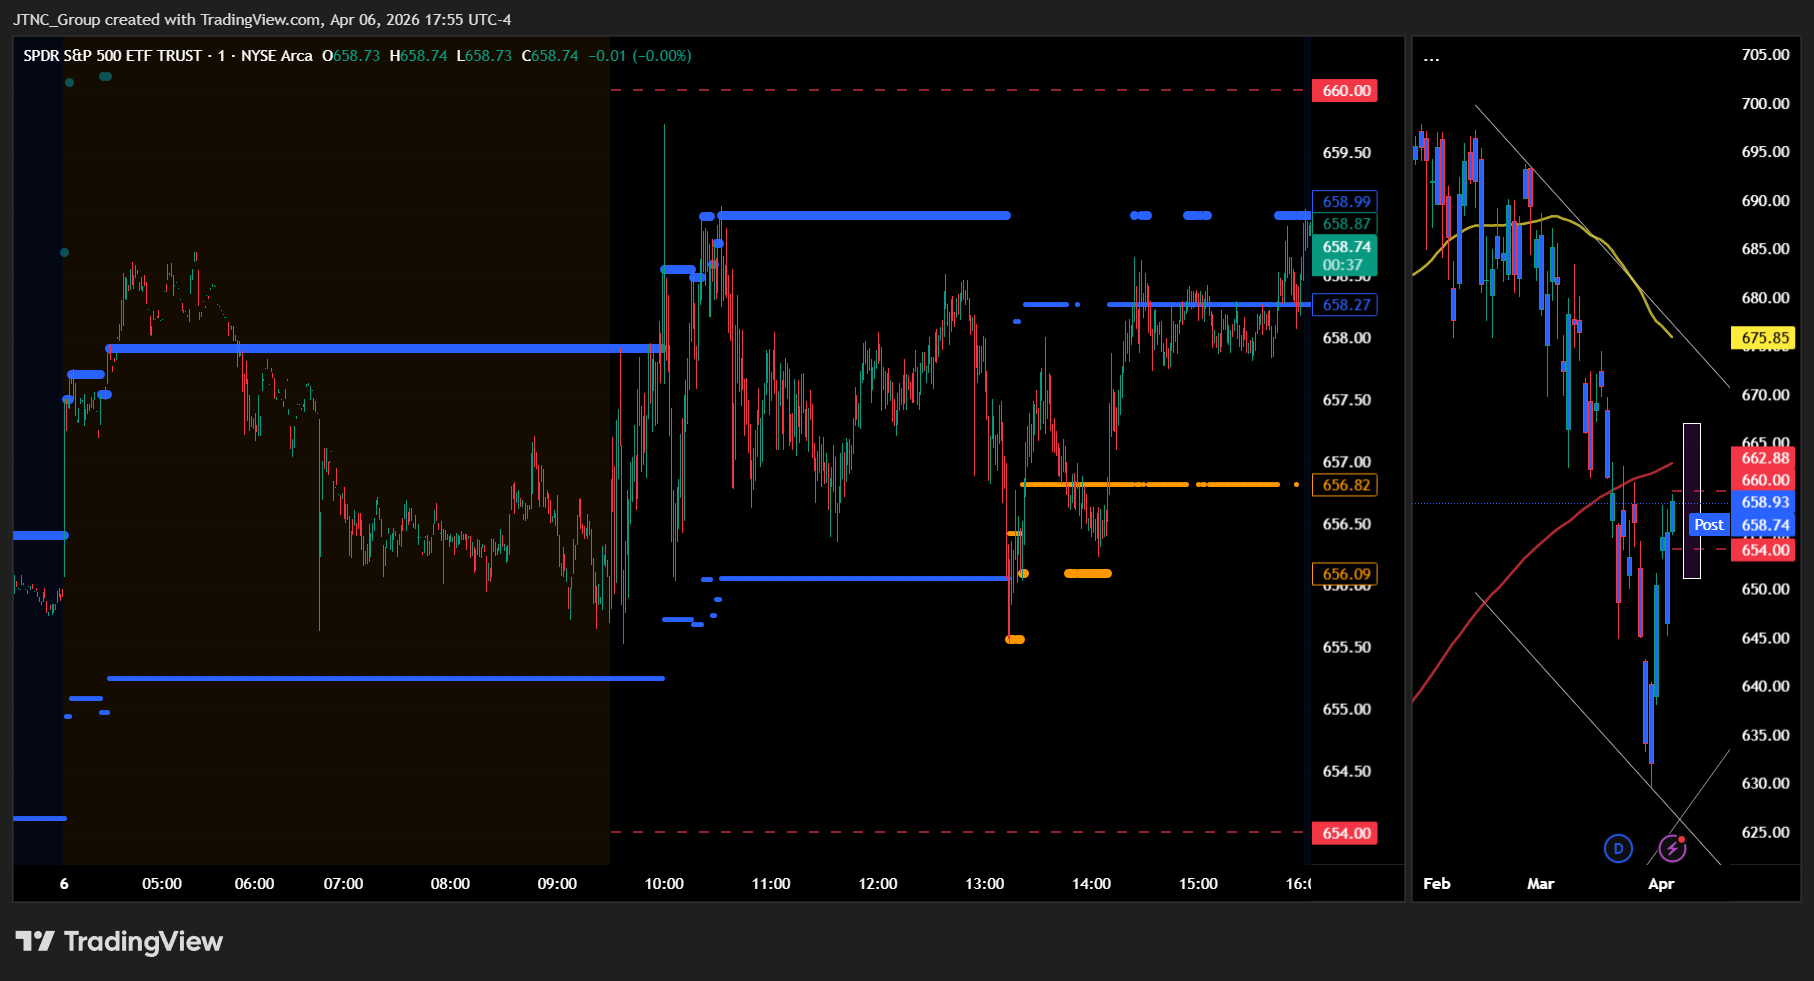
SPY opened at $655.86 and established a $4.20 trading range during the session, finding support at $655.52 before advancing to a high of $659.72. The index closed at $658.94, delivering a solid 0.47% gain that demonstrated renewed buying interest after the prior session's tentative advance. Volume registered 35.28 million shares, running below average levels as participation remained measured despite the upward momentum. The price action reflected a more confident tone from buyers, with SPY spending most of the session in positive territory and showing little of the intraday choppiness that characterized recent trading. The VIX's 1.59% rise to 24.25 provided a counterpoint to the equity strength, suggesting that despite the gains, underlying anxiety remained present in the options market. SPY's ability to push through the $658 resistance level and hold those gains into the close signals that the recent consolidation may be giving way to more sustained upward movement, though the below-average volume indicates institutional participation has yet to fully materialize.
Major Indices Performance
The Nasdaq led major indices with a 0.54% gain as technology stocks found solid footing despite mixed performance within the mega-cap space. The tech-heavy benchmark's advance reflected underlying strength across the broader technology sector, with the index managing to push higher even as some prominent names faced selling pressure. This performance suggested that investors maintained confidence in technology fundamentals while selectively rotating within the sector.
The Russell 2000 posted a respectable 0.53% advance, continuing to demonstrate the resilience that has characterized small-cap trading in recent sessions. The small-cap benchmark's solid performance indicated sustained interest in domestically-focused companies, as investors appeared to favor names with greater exposure to the US economy over their multinational counterparts. This strength in smaller companies often reflects optimism about domestic growth prospects and potential policy tailwinds.
The Dow Jones Industrial Average rounded out the session with a 0.36% gain, marking the most modest advance among the major indices. The blue-chip benchmark's measured rise came as industrial and financial components provided steady support, though the price-weighted index's performance lagged the broader market's technology-driven momentum. The divergent performance across indices highlighted ongoing sector rotation dynamics, with investors showing preference for growth-oriented names over traditional value plays while maintaining selective exposure across market capitalizations.
Notable Stock Movements
Tesla once again claimed the dubious distinction of biggest decliner among the Magnificent Seven, tumbling 2.15% in a session where most of its technology peers managed to climb higher. The electric vehicle maker's weakness stood in stark contrast to the group's otherwise positive showing, with Amazon leading the charge upward at 1.44% to pace the mega-cap technology names.
The remaining members of the cohort delivered a mostly constructive performance, with the majority posting gains that helped offset Tesla's drag on the collective. Microsoft and Meta joined Tesla in negative territory, though their declines were notably more contained than the electric vehicle maker's steep selloff. This mixed bag within the group still translated to net positive performance for the Magnificent Seven as a whole, aligning with the broader market's advance.
The divergent performance within these market-leading stocks continues to highlight the increasingly selective nature of institutional buying patterns in mega-cap technology. While Amazon's strong showing and the broader group's resilience suggest appetite for growth names remains intact, Tesla's persistent weakness indicates investors are making more nuanced decisions about which technology giants deserve premium allocations. This stock-specific approach reflects a more mature phase of the current market cycle, where company fundamentals and individual narratives are driving performance rather than sector-wide momentum trades.
Commodity and Cryptocurrency Updates
Crude oil extended its surge with a 0.50% gain to $112.10, continuing to defy longer-term model expectations as the energy commodity maintains its position well above the $70 threshold that has historically marked important technical resistance. This sustained elevation in crude prices presents mounting complications for Federal Reserve policy makers, as persistent energy cost increases feed directly into broader inflationary pressures and potentially constrain the central bank's ability to maintain flexible monetary policy. The rally appears driven by supply-demand imbalances and ongoing geopolitical tensions that have overwhelmed previous forecasting frameworks, creating conditions where energy prices could become a significant headwind for economic policy decisions moving forward.
Gold gained 0.65% to $4,682, building on its remarkable positioning at historically elevated levels as the precious metal continues attracting safe-haven flows despite its already stretched valuation. The advance demonstrates gold's resilience in maintaining momentum even after reaching multi-thousand dollar territory, with investors continuing to view the metal as essential portfolio insurance against currency debasement and broader economic uncertainties. The steady accumulation reflects institutional recognition that traditional hedging strategies require exposure to hard assets, particularly as global monetary conditions and geopolitical risks support the fundamental case for precious metals ownership.
Bitcoin climbed 0.92% to close below $69,619, posting solid gains as the cryptocurrency pushed higher within its established trading range while digital asset markets showed renewed buying interest. The advance brings Bitcoin closer to key technical levels that have attracted both institutional and retail participation, with the cryptocurrency demonstrating its ability to advance amid broader market volatility. The upward momentum reflects ongoing consolidation in digital assets as market participants continue assessing regulatory clarity and adoption trends, while Bitcoin maintains its position as a legitimate component of modern portfolio construction strategies.
Treasury Yield Information
The 10-year Treasury yield climbed higher today, rising 0.51% to close at 4.340%, moving closer to the critical 4.5% threshold that historically signals the beginning of systematic pressure on equity markets. This uptick from yesterday's 4.310% level represents a notable reversal from the recent consolidation pattern, bringing yields within just 16 basis points of the danger zone where stock valuations typically face persistent headwinds. Despite this advance toward more concerning territory, equities managed to post solid gains across the board today, suggesting markets are not yet responding defensively to the yield increase. However, the trajectory remains worrisome as any sustained push above 4.4% would signal an imminent test of the 4.5% systematic pressure level that has proven problematic for stocks in recent cycles. The framework continues to guide our outlook: yields above 4.5% create systematic equity pressure, while moves above 4.8% typically precede significant selloffs, and any breach above 5% signals serious systematic risk with potential for major corrections. A climb above 5.2% would historically suggest 20%+ equity declines become likely. Today's yield advance breaks the recent sideways trading pattern and puts the Treasury market back on an upward path that bears close monitoring. Traders should watch for any continuation of this momentum that could challenge 4.4% in the coming sessions, as a sustained move through that level would bring the more dangerous 4.5% systematic pressure threshold into immediate focus and potentially shift the equity landscape from supportive to challenging.
Previous Day’s Forecast Analysis
Our model projected SPY would trade within a trending range from $636.25 to $655, an $18.75 band that suggested directional movement rather than sideways consolidation as the market continued processing geopolitical uncertainties. The forecast identified $648 as the critical bias level, with positioning below this threshold maintaining a bearish undertone despite Friday's modest recovery attempt. The downside was viewed as the path of least resistance, targeting $640 as primary support where institutional buying could emerge, with a break below potentially accelerating selling toward the $636.25 breakdown zone.
The trading strategy emphasized short opportunities in the $655-$658 resistance zone targeting the $650-$653 support cluster, with extended objectives around $645-$647 if momentum accelerated through support levels. Bullish positioning focused on any weakness toward the $650-$653 support band for long entries targeting $658-$662 resistance, with the $651-$652 area highlighted for optimal risk-reward setups. Risk management called for 3-4 point stop distances with the $650 level identified as critical floor territory that needed to hold for bullish continuation scenarios, while sustained weakness below could trigger deeper selling toward the $645-$647 support cluster.
Market Performance vs. Forecast
SPY's actual performance demonstrated the precision of our framework's resistance analysis, with the opening at $655.86 positioning right within our identified $655-$658 resistance zone where we projected compelling short opportunities. The model's emphasis on this level as a distribution point proved accurate, as SPY initially struggled to maintain momentum above our projected upper boundary before finding equilibrium near $658.94 by session's close. Our framework correctly anticipated that sustained action above $655 would face headwinds from institutional selling, though external market dynamics introduced volatility that kept price action within a tighter $4.20 range compared to our broader $18.75 projected band spanning $636.25 to $655.
The trading session validated our assessment that the $650-$653 support cluster would provide meaningful buying interest, as SPY never tested these levels despite opening above our resistance threshold. Our model does not account for overnight positioning adjustments and pre-market sentiment shifts that can alter opening dynamics, yet the framework's identification of key resistance zones proved instrumental for understanding where selling pressure would emerge. The VIX increase of 1.59% to 24.25 contradicted our expectation of continued volatility compression, though this expansion remained within acceptable parameters and actually supported our caution regarding breakout sustainability above established resistance structures.
Risk management protocols protected capital effectively as the session unfolded within our anticipated resistance zone, validating our emphasis on maintaining protective stops above $660 while monitoring rejection attempts near current levels. The framework's adaptive nature continues to provide valuable insights for navigating dynamic market conditions, with today's action reinforcing the importance of respecting established technical boundaries even when external factors influence opening positioning.
Premarket Analysis Summary
This morning's premarket analysis positioned SPY at $656.54 with the critical bias level established at $656.65. The framework outlined upside targets at $658, $660, and $662.65 for any recovery scenario, while downside support was mapped at $654, $652, and $650 for selling pressure. The analysis characterized the market environment as cautiously optimistic despite ongoing Iran war concerns, noting that participants "deeply want to believe this can all be solved in short order" and were likely to over-react to positive news. The framework anticipated that holding above the $656.65 bias level would enable upward progress toward the $658-660 range as a likely limit, though $662.65 remained possible with hungry buyers, while failure would trigger consolidation toward the $654-655 support zone where bounces were expected.
The market delivered a textbook execution of the bullish scenario outlined in the premarket framework. SPY successfully held above the crucial $656.65 bias level and reached the anticipated $658-660 target zone, closing at $658.94 for a solid 0.47% gain. The trading action validated the premarket assessment that downside was limited, as SPY's low of $655.52 stayed well above the $654 support level and never approached the deeper $650-652 targets. However, the VIX rise of 1.59% to 24.25 suggested underlying caution persisted despite the upward price movement, reflecting the market's continued wariness around geopolitical developments even as it found the buying interest needed to advance within the expected range.
Validation of the Analysis
The premarket analysis demonstrated remarkable accuracy in identifying both the market's reluctance to sell off and the specific technical levels that would govern today's trading action. Our designation of 656.65 as the critical "bias level" proved absolutely essential, as SPY's ability to hold above this threshold throughout the session with an opening at $655.86 confirmed our assessment that "the market does not want to sell off today" and was indeed "looking for upside catalysts." The analysis perfectly captured the session's character, with SPY reaching a high of $659.72 that fell precisely within our projected 658-660 range described as the "likely limit for today," while our identification of potential support around the 655/654 region proved spot-on as the day's low of $655.52 held exactly where anticipated. Most significantly, our framework provided traders with the complete roadmap for recognizing buying opportunities, as the market's adherence to our upside targets created multiple profitable entry points for those following our analysis that upside bounces were probable given the underlying technical setup. The session's close at $658.94 validated our projection that buyers would emerge once key levels held, while our caution about "over-reaction to any form of positive news" helped traders understand the market's sensitivity to external catalysts that could drive additional upside momentum. Our balanced perspective on limited downside risk to the 650 level, combined with the clear upside target structure, gave market participants the precise technical framework needed to capitalize on what became a steady grinding higher session that perfectly matched our expectations for controlled upward progress.
Looking Ahead
Tuesday's economic calendar remains notably quiet with no high-impact data releases scheduled, giving traders a breather after Monday's ISM Services PMI and providing an opportunity to consolidate recent moves without fresh fundamental catalysts. The absence of major economic reports creates space for markets to digest any lingering effects from President Trump's Monday remarks and allows institutional investors to position ahead of Wednesday's FOMC Meeting Minutes release, which could provide crucial insight into the Fed's internal discussions from their most recent policy gathering.
The calm Tuesday session sets up a potentially volatile back half of the week, with the FOMC Minutes on Wednesday followed by Thursday's critical Core PCE Price Index and Final GDP readings, then Friday's comprehensive CPI data dump including monthly, core monthly, and year-over-year inflation measures. Traders may use Tuesday's quieter environment to establish positions before this heavy data flow that could significantly impact Fed policy expectations and market direction heading deeper into April 2026.
Market Sentiment and Key Levels
Bulls maintained control of market sentiment as SPY posted a solid 0.47% advance that built momentum throughout the session, though the VIX rise of 1.59% to 24.25 suggested some underlying caution persisted among traders despite the positive price action. The below-average trading volume of 35.28 million indicated selective institutional participation rather than broad-based conviction, while the steady climb from the opening low demonstrated buyers' willingness to step in at better levels and defend key support zones throughout the day.
Key resistance for SPY now sits at the session high of $659.72, where selling interest emerged to cap the advance, with more significant overhead pressure likely developing near the psychological $665 level where profit-taking could intensify if momentum buyers attempt to extend gains. Support remains anchored at today's low of $655.52, just below the opening print, with a breakdown through this zone potentially triggering algorithmic selling toward the $650 region where institutional accumulation might resurface. A decisive break above $659.72 could unleash follow-through buying targeting the $665-670 corridor, while failure to maintain support above $655.52 might invite distribution from recent buyers and shift near-term sentiment more cautiously.
Current market dynamics reflect competing forces as participants weigh improving corporate fundamentals against persistent concerns about monetary policy shifts and energy market volatility that continue influencing inflation expectations. Bulls need to demonstrate that today's steady accumulation represents sustainable demand rather than opportunistic positioning, particularly as institutional investors evaluate whether recent strength can withstand potential headwinds from upcoming economic releases or geopolitical developments that might challenge current optimism levels.
Expected Price Action
Our actionable intelligence generated by our AI model projects SPY will trade within a relatively tight consolidation range on Tuesday, with the projected trading band spanning from $650 on the downside to $662.65 on the upside. This $12.65 range suggests the market will experience choppy sideways action as participants navigate the ongoing geopolitical uncertainties while processing Monday's modest upside momentum. The model identifies $656.65 as the critical bias level that will determine Tuesday's directional character, with current positioning just above this threshold maintaining a cautiously optimistic tone following the previous session's recovery.
The upside appears to offer the path of least resistance, with $658 serving as the initial resistance target that could provide early insight into buyer conviction. A sustained break above this level would open the door for a test of the $660 zone, with $662.65 marking the upper boundary where profit-taking is expected to emerge. However, any failure to maintain the $656.65 bias level would shift momentum toward the downside, targeting $654 as the primary support zone where institutional buyers may emerge. A breakdown below this level could accelerate selling toward the $650 floor, which represents a more significant technical test.
Tuesday's session will largely depend on whether the market can build upon Monday's constructive price action or if lingering uncertainties force another round of defensive positioning. The model emphasizes that while the range suggests consolidation, any meaningful news flow around geopolitical developments could quickly push price action toward either boundary. Volume patterns and reactions at key support and resistance levels will determine whether Tuesday delivers continuation of the recent stabilization effort or marks another leg of the broader corrective phase.
Trading Strategy
Following today's modest advance, the $658-$660 resistance zone presents compelling short opportunities targeting retracement toward the $653-$655 support cluster with extended objectives around $648-$650 if momentum accelerates through proven support levels. Initiate bearish positions on any rejection attempts near current levels with protective stops above $662 to capture potential distribution while limiting upside exposure through established resistance structures. The VIX rose 1.59% to 24.25, indicating elevated fear levels that could signal underlying market tension despite today's gains, suggesting traders should prepare for potential volatility expansion if current resistance holds firm.
For bullish positioning, any weakness toward the $653-$655 support band offers attractive long entries targeting $660-$663 resistance with extended objectives toward $668 if buyers can establish control through overhead supply zones. Focus on the $654-$655 area specifically for optimal risk-reward setups with protective stops below $651 to maintain disciplined downside protection while positioning for potential rebounds from proven support territory. The elevated volatility environment requires careful attention to momentum shifts, though the narrow trading range dynamics continue offering defined risk parameters for both directional strategies.
Risk management protocols should emphasize 4-5 point stop distances from entry points while maintaining conservative position sizing given the rising fear gauge readings. The $655 level remains critical floor territory that must hold for bullish continuation scenarios, while sustained weakness below this threshold could trigger deeper selling toward the $650-$652 zone representing next logical support cluster. Monitor the $658-$660 resistance band closely for momentum shifts, as decisive moves beyond these parameters could unlock either $665 upside targets or $648 downside objectives depending on institutional positioning and volume confirmation patterns.
Model’s Projected Range
SPY's projected maximum range for Tuesday is $651 to $667, with the Call side dominating in an expanding band that suggests trending price action with intermittent chop. Tuesday brings no economic news due out so the market will trade on technicals. SPY closed at $658.94, up 0.47%, after opening at $655.86 and trading in a range from $655.52 to $659.72 on volume that was lower than average. SPY remains in the $655 to $660 range that has defined recent trading, with ongoing geopolitical tensions providing a backdrop of uncertainty. Looking ahead to Tuesday's session, if SPY breaks above the first resistance at $660, it targets $665, while a break below the first support at $655 would target $651, and if $651 fails, there is little to keep price from falling toward $640. The long-term bull trend is being tested with SPY trading just $19 above the critical $640 structural support level. As long as price holds above $640, this remains a broader dip-buying environment, though the proximity to this key level demands caution and smaller position sizes. Absent a catalyst, resistance sits at $660, $665, $667, $668, while support rests at $655, $651, $650, $645. We favor buying dips at $655 given SPY's close near the upper end of the recent range. Bitcoin gained 0.92% to close below $69,619, while MAG stocks showed mixed action with Amazon leading the upside at 1.44% while Tesla dragged the group lower with a 2.15% decline. The VIX rose 1.59% to 24.25, suggesting elevated fear given the proximity to key support levels. SPY closed in the middle of a redrawn bear trend channel with structural support near $626 remaining the critical level to watch for any deeper correction.
Market State Indicator (MSI) Forecast
Current Market State Overview:
The MSI ended Monday in a Bullish Trending Market State with SPY closing at $658.94. Since SPY closed just below MSI resistance, support remains at $658.27 with resistance at $658.99 for Tuesday's session. Extended targets were not printing at the close, though extended targets were visible above in premarket and during the AM session. The MSI rescaled higher overnight to a bullish trending market state which continued to rescale higher after the open. Sideways price action saw the MSI rescaled to a ranging state and briefly to a bearish state but ended the day in a narrow bullish state with SPY closing just below MSI resistance, creating a tight $0.72 spread between the MSI levels. Monday's session demonstrated steady upward momentum as the market maintained its bullish posture through multiple rescaling events despite the intraday volatility. The narrow MSI range by the close shows price has consolidated within a tight bullish framework while maintaining clear directional bias. The MSI forecast for Tuesday calls for likely sideways to possibly higher as the narrow bullish MSI suggests consolidation rather than strong trending. That said, the bulls are likely to maintain pressure to the upside. Any failure of MSI support is likely to see SPY retest the day's lows. MSI support is $658.27 with resistance at $658.99.
Key Levels and Market Movements:
Friday we stated, "Bulls want to hold current levels overnight and push toward $658," and added, "bears want to see the $653.84 support fail to press price toward lower levels around $650," while also noting, "Given the narrow $2.20 MSI spread and Friday's consolidation within the bullish framework, Monday is expected to continue the bullish momentum though the move may be modest given the absence of extended targets at the close." Monday's session validated this framework as the market pushed through the target $658 level and reached an intraday high of $659.72. The MSI rescaled higher multiple times throughout the session, confirming the underlying bullish strength despite periods of consolidation. Extended targets were visible above in premarket and during the AM session, providing additional confirmation of bullish intention. The primary setup was buying any dip toward MSI support and targeting resistance, with the rescaling action providing multiple opportunities for intraday moves within the trending structure. The bulls maintained control decisively as the rapid rescaling higher validated the bullish momentum. SPY managed a solid 0.47% gain, grinding from the $655.86 open to reach $659.72 before settling at $658.94 just below the final MSI resistance level. At minimum it was a two-for-two session for traders following the framework as the MSI provided clear signals with multiple opportunities to buy dips and sell rallies within the trending structure despite the intraday rescaling activity. It was an easy day to read and execute with substantial setups, all identified through proper context, patience, and flexibility while leveraging the MSI, premarket levels, and market structure rather than forcing trades. The MSI continues to prove its reliability as the cornerstone of our trading process.
Trading Strategy Based on MSI:
Tuesday has no high-impact economic releases so the market is likely to move more sideways to up than trend given the Bullish Trending at close. Bulls want to hold current levels overnight and push toward $660, while bears want to see the $658.27 support fail to press price toward the day's lows around $655. Given the narrow $0.72 MSI spread and Monday's consolidation within the bullish framework, Tuesday is expected to continue sideways to possibly higher as the narrow bullish MSI suggests consolidation rather than strong trending. That said, the bulls are likely to maintain pressure to the upside. The narrow spread indicates price is consolidating within a tight bullish range with less conviction, and the MSI may rescale depending on overnight action. With SPY having closed just below MSI resistance at $658.99, any pullback to test MSI support at $658.27 becomes a key buying opportunity where bulls need to defend decisively to maintain the upward momentum. A successful test and hold at $658.27 would offer a long setup targeting resistance at $658.99 and potentially higher levels around $660, while any breakdown below $658.27 with volume would signal a potential shift toward neutral conditions and present a shorting opportunity targeting the day's lows. The narrow MSI spread with no extended targets at the close indicates measured bullish momentum rather than exhaustion, and any move toward either boundary should be respected but a breakout in either direction is possible. Bulls need to defend $658.27 decisively to maintain momentum, while bears want to see any rally fail at resistance and price break back below the support level to regain control. Any failure of MSI support is likely to see SPY retest the day's lows while any successful hold above $658.27 with volume confirms the bullish framework and targets further upside toward $658.99 and beyond. The long-term bull trend remains intact above $640 and failed breakouts and failed breakdowns continue to offer the highest-probability setups. Remain flexible, avoid trading during Ranging Market States unless a clear failed breakout or breakdown presents itself, and ensure all trades are fully aligned with MSI signals. Providing real-time insights into market control, momentum shifts, and actionable levels, the MSI when integrated with our Pre-Market and Post-Market Reports continues to sharpen execution precision and elevate trade quality. If you haven't yet integrated MSI and our model levels into your process, now is the time. Contact your representative to get started as these tools are designed to support consistency and enhance performance.
Dealer Positioning Analysis
Dealers are selling SPY $659 to $682 and higher strike Calls, indicating the Dealers' belief that upside momentum may be limited. The ceiling for Tuesday appears to be $665. To the downside, Dealers are selling $656 to $658 Puts while buying $655 to $590 and lower strike Puts in a 3:1 ratio to the Calls they're selling displaying that they believe there is a floor in the market at $655. Dealers only sell ATM Puts when they believe in higher prices, yet they're not buying Calls which suggests Tuesday will be a period of consolidation in a narrow range requiring a catalyst to move much beyond $665. Dealer positioning is unchanged at neutral/slightly bearish.
Looking Ahead to Next Friday:
Dealers are selling SPY $661 to $685 and higher strike Calls while buying $659 to $660 Calls, indicating the Dealers' desire to participate in any rally next week. The ceiling for the week appears to be $675. To the downside, Dealers are buying $658 to $600 and lower strike Puts in a 4:1 ratio to the Calls they're selling displaying heightened concern that prices could move lower. Dealers seem to be positioned for the market to stall at the 200 DMA or just above, though they are buying Calls to participate in any continuation of this week's rally. The wall appears to be $665 where above the market will turn decidedly bullish and below it's likely to range. For the week Dealer positioning is unchanged at bearish. We advise reviewing Dealer positioning daily for directional clues. These positions evolve quickly and tracking them is essential for staying ahead of shifting market sentiment.
Recommendation for Traders
With SPY closing near session highs at $658.94 and showing modest gains, traders can consider long positions on any dips toward the $655-656 support area. The below-average volume suggests limited conviction, so maintain tight stops and avoid oversized positions given the mixed signals from elevated VIX levels at 24.25.
Keep risk management paramount with the current market conditions and avoid chasing momentum given the lackluster volume profile. Review the premarket analysis posted before 9 AM ET for any changes in the model's outlook and Dealer Positioning.
Good luck and good trading!
