Market Insights: Friday, April 4th, 2025
Market Overview
Markets were crushed again Friday, capping off one of the worst two-day stretches since the pandemic as retaliatory Chinese tariffs and sobering commentary from Fed Chair Powell sent investors fleeing. The Dow cratered over 2,200 points, shedding 5.5% and officially entering correction territory. The S&P 500 dropped nearly 6%, finishing off its worst week since 2020, while the Nasdaq officially entered a bear market with a 5.8% decline. Friday’s meltdown was triggered after China fired back with 34% tariffs on all U.S. products, matching Trump’s levies announced Wednesday. The escalation confirmed fears that tit-for-tat retaliation is the path forward, dashing any near-term hopes for negotiation. Traders dumped risk assets and piled into bonds, driving the 10-year yield down to 3.9%, close to its October lows. Powell acknowledged for the first time that tariffs were "higher than anticipated" and admitted it was "too soon to say" what the rate path should be going forward. Traders responded by pricing in up to five rate cuts this year as fears of an economic downturn gained steam. Meanwhile, Trump stoked tensions further on Truth Social, claiming China “played it wrong” and doubling down on his promise that his policies “will never change.” Despite a strong jobs report showing 228,000 jobs added in March and unemployment ticking up slightly to 4.2%, markets barely noticed. The economic headlines were entirely eclipsed by fears of a deepening trade war that could drag the U.S. into recession.
SPY Performance
SPY suffered another brutal session, plummeting 5.77% to close at $505.74 after opening at $523.65. It briefly pushed to a high of $525.87 before collapsing to a low of $505.06. Trading volume exploded to 183.64 million shares—more than triple the average—signaling full-blown panic and capitulation selling. Friday’s session pushed SPY well below the August lows and confirmed that the 200-day moving average has now flipped into strong resistance. The ETF ended the day deep in bear market territory and far below critical support zones that traders had been watching all week.
Major Indices Performance
The Nasdaq led the decline with a 5.82% plunge, officially entering a bear market as tech stocks got obliterated for the second straight session. The Dow tumbled 5.5%, losing more than 2,200 points and confirming correction territory. The S&P 500 followed closely with a 5.77% dive, putting the broad market squarely into a risk-off spiral. Surprisingly, small caps held up relatively better, with the Russell 2000 dropping 4.46%, though still deep in the red. The carnage was indiscriminate, sparked by deepening trade war fears and Powell’s warning that tariffs could fuel both inflation and slower growth. Defensive sectors failed to offer a safe haven again as sellers unloaded across the board.
Notable Stock Movements
The Magnificent Seven suffered another bloodbath, this time led by Tesla, which crashed over 10% and dragged the entire group lower. Nvidia, Apple, Netflix, and Meta all plunged more than 5%, with the rest of the group down over 3%. It was a second day of major liquidation across these megacaps, as traders continued to de-risk from high-beta names with exposure to international supply chains. The selloff wiped out hundreds of billions more in market cap and reinforced how quickly momentum can reverse when macro risks take over. No member of the group escaped the carnage, and Friday’s declines sealed two days of stunning wealth destruction.
Commodity and Cryptocurrency Updates
Crude oil collapsed another 6.86% to $62.34, accelerating its plunge as markets priced in collapsing global demand from escalating trade tensions. Our model still sees downside risk toward $60. Gold also took a hit, falling 2.08% to $3,056.75 as panic selling extended into traditional safe havens. Bitcoin held up relatively well, dipping just 1.62% to close just above $84,000. We remain buyers between $83,000 and $77,000, using Bitcoin as a long-only trading vehicle, with plans to take profits above $85K. For now, crypto appears to be showing surprising resilience amid the broader market collapse.
Treasury Yield Information
The 10-year Treasury yield fell 1.36% to close at 4.000%, nearing the critical psychological threshold that often signals mounting recession fears. The yield has now dropped nearly half a point in just two sessions, reflecting a full-blown flight to safety. While yields below 4.5% usually support equities, the speed of the decline is concerning—it implies a significant economic slowdown may already be unfolding. The fact that the yield closed right at 4% hints that the bond market expects more turbulence ahead. If yields drop below 4%, it could signal that the Fed is behind the curve as the economy weakens rapidly.
Previous Day’s Forecast Analysis
The model projected a wide trading range between $526 and $550 with a strong bearish tilt unless SPY reclaimed $545. The plan warned that any break below $530 could unleash another wave of selling, with little support down to the August lows around $510. Short trades were recommended at resistance zones like $543 and $545, with clear instructions to avoid long trades unless SPY held above $530 with a failed breakdown setup. The analysis emphasized the danger of dip-buying in this environment and advised leaning bearish into resistance and staying nimble.
Market Performance vs. Forecast
Friday’s price action delivered exactly what the model anticipated—and then some. SPY opened at $523.65 and barely held together before cascading through $520, $516, and finally collapsing under $510 to close at $505.74. This breakdown obliterated multiple key support levels and validated the model’s call that breaking below $530 would expose much deeper downside. The projected range of $526 to $550 was breached decisively, and the expected test of August lows around $510 occurred swiftly. Short trades from any resistance zones were wildly profitable, and the speed of the drop confirmed that sentiment had shifted aggressively. Traders who followed the game plan were rewarded as volatility surged and bearish momentum intensified.
Premarket Analysis Summary
In Friday’s premarket analysis posted at 8:28 AM, SPY was trading at $521.57 with a downward bias below the $524 to $525 zone. The analysis flagged $524 as the critical area SPY needed to reclaim to show strength, but warned of a bearish tilt unless that occurred. Targets below were identified at $520, $516, and an ambiguous lower level signaling room for an extended slide. The commentary urged caution and pointed to short setups on failed rallies as the most favorable approach under current market conditions.
Validation of the Analysis
Friday’s action validated the premarket forecast with almost eerie precision. SPY rejected the $524 to $525 region early in the session, then dove straight through downside targets at $520 and $516 before ultimately flushing below $510. The model’s warning that price could “simply slide” below those levels played out in textbook fashion. There were clear and actionable short opportunities from just under $524, and the massive volume spike confirmed the bearish read. Once again, the analysis nailed the day’s momentum and gave traders the levels they needed to trade with conviction.
Looking Ahead
With no major economic events scheduled for Monday or Tuesday, the next big catalyst arrives Wednesday with the release of the FOMC Minutes. CPI follows Thursday, and Friday wraps the week with PPI and University of Michigan sentiment readings—likely flashpoints given the market’s fragility and hostility toward the current administration. Traders should expect more volatility as these reports approach.
Market Sentiment and Key Levels
SPY closed at $505.74, deep below prior support and sitting near the bottom of a steepening bearish trend channel. Market sentiment remains extremely bearish after two massive down days. The bears are fully in control and have now pushed SPY well below the August lows. Key resistance now sits at $510, $513, and $519. If SPY manages to rally into these levels, expect them to act as strong sell zones. On the downside, support is thin with levels at $500, $498, and $496. Below $494, there’s little to prevent a drop to $475. Unless bulls can reclaim $520 and sustain momentum, the dominant trend remains lower.
Expected Price Action
Our AI model projects a wide trading range of $480 to $525 for Monday, indicating likely trending behavior with occasional chop. The bias remains firmly bearish unless SPY can reclaim and hold above $520. If that happens, a bounce toward $530 is possible, but any move above that is likely to be sold. A break below $500 opens the door to $496 and then $475, which is the next major magnet. Momentum clearly favors the bears, and traders should continue to lean short until evidence of capitulation or reversal emerges. Failed breakouts near resistance are high-probability short setups, while dip-buying should remain off the table unless conditions change dramatically.
Trading Strategy
Monday should be treated as a high-risk, high-volatility session, especially with the VIX now spiking to 45—well into panic territory. Traders should look to short any rallies into resistance levels at $510, $513, or $519, with targets at $500, $498, and $494. If SPY breaks below $494, the next support level is $475, where we expect heavy buying interest to emerge. Long trades should only be considered after a failed breakdown setup or a massive reversal supported by volume and a calming VIX. Use wider stops given the volatility, and reduce position size to avoid getting shaken out by intraday swings. The elevated VIX reflects peak fear, and while it could eventually trigger a bottom, price must prove it first. A VIX close below 35 may signal a bottom is near and buying long dated (three month) Puts on VIX is a high probability strategy which will capitalize on any relief rally that may develop. Stay disciplined, avoid chasing trades, and let the market come to you.
Model’s Projected Range
The model’s maximum projected range for Monday is $479.25 to $531, which is extremely wide and suggests strong trending price action with intermittent chop. The Put side remains dominant, reinforcing the bearish bias. SPY closed at $505, marking the lows of the day in yet another bloodbath for investors. Key resistance levels now stand at $510, $513, and $519, while support is found at $500, $498, and $496. Below $494, support is virtually nonexistent. Between $505 and $510, there's a dense wall of resistance, which intensifies significantly above $510. At present, there is little to suggest that price action can sustain a rally beyond this level. SPY is nearing bear market territory and remains well below its 200-day moving average. Inflation concerns and tariff pressures are driving sentiment, with little indication that the current decline will slow or reverse. Volume surged to more than three times the daily average, while the VIX spiked to 45—classic signs of capitulation, which may offer some support later next week. However, for now and likely into Monday’s premarket, rallies should be sold. The bulls have lost control, and bears have clearly asserted dominance by pushing SPY below the August lows. The next significant target is $475, which could act as a magnet if price breaks below $495. As noted yesterday, this is not a dip-buying environment. The bear trend channel from the December highs has been redrawn, and SPY is now hugging the lower edge of a steepening, broad bearish channel. While this allows for some two-way movement, the structure is expected to contain price action in the near term. Momentum remains firmly in bearish hands for the foreseeable future.
Market State Indicator (MSI) Forecast

Current Market State Overview:
The MSI is currently in a Bearish Trending Market State, with price closing at MSI support. There are extended targets printing below. The MSI range is wide indicating a strong bear trend. Overnight price fell over $10 in a tariff sell-off that continues to be unrelenting. The MSI rescaled lower and widened with extended targets below, indicating a very strong bear trend. By noon the MSI once again began a series of rescalings lower with extended targets below which continued into the close. Price continued to trade lower only slowing at MSI support. Currently MSI resistance is $521.19 and support is at $505.50.
Key Levels and Market Movements:
On Thursday, we stated: “The path appears set toward the August lows around $510.” We also said, “For Friday, the best trade setups will likely come from selling rallies,” and warned that “Below $530, support is virtually nonexistent.” With that in mind, when SPY opened Friday well below $530 in the premarket, our plan was clear: short any rally up to $530, knowing there was little standing in the way of lower prices. The premarket report also highlighted a break of $524 as a key short trigger, and when a head-and-shoulders pattern formed near $524.75—right at MSI resistance—we took our shot. Our initial target was $516, a level tested during the premarket session. Once price reached that zone, we took off 70% of our position, locking in a strong early gain. The level held briefly, and price bounced back to retest MSI resistance near $523. Confident in the broader trend, we reloaded the short, looking for another leg down to $516—which came quickly again. With extended downside targets in play and nothing but resistance overhead, we held our runners, anticipating the MSI would rescale lower. By 1 PM, it did, and we hit our second target at $508.75, trimming another 20%. With just 10% of the position left—and SPY already breaking below the August lows—we decided to hold into the close in case the market fully unraveled. About an hour before the close, the MSI rescaled once more, and we exited the final piece at $505.75. And with that, we wrapped up an incredible week. While most investors were licking their wounds after the bloodbath, we booked more profits this week than we usually do in two or three weeks. Two for two, a result of building a solid trading plan, following it with discipline, and allowing the MSI and model levels to guide each decision. The MSI shows who’s in control, when control shifts, and highlights actionable support and resistance levels for precise entries and exits. When combined with our model’s levels and daily strategy, it consistently keeps us aligned with dominant market forces. The MSI provides this level of precision day in and day out—helping traders avoid trouble, stay in sync with momentum, and take profits with confidence. We strongly recommend incorporating the MSI into your trading toolkit. When paired with a well-structured plan, it can meaningfully enhance your long-term success.
Trading Strategy Based on MSI:
Monday brings no material economic data, but the tariff situation remains volatile. There’s a real risk that other countries could announce retaliatory tariffs, adding more fuel to the fire. This is a very dangerous time to be long. Fed Chair Powell has acknowledged that the risks from tariffs have likely been underestimated. He also stated the Fed will reassess its position as the situation develops. With the August lows now breached, there's little technically stopping SPY from falling significantly further. Friday’s volume was three times the average, and with the VIX above 45, we may be approaching capitulation—or we may not. Under typical conditions, a VIX spike and volume surge would prompt us to look for a bottom and potential relief rally. But these are not typical conditions. Until the VIX closes below 35, we are not looking to catch a falling knife. We’re not sure if we’re in the second inning or the seventh inning of this bear market. But there’s no bull case until SPY reclaims $535 or higher. While long setups may emerge as a bottom begins to form, we will only go long under very specific conditions: either MSI flips bullish, or—if bearish—the range is narrow and there are no extended targets below. In either case, we will only consider longs on failed breakdowns. For now, the strategy remains: sell rallies into MSI resistance or major levels defined by our model. That includes shorting any move up toward $520–$530 or getting short again if $505 breaks. A massive gap was created today that will eventually get filled, likely with a 300-point green day. But in the immediate term, this bear trend is intact and the path of least resistance remains lower. Absent a major external catalyst, we expect continued selling pressure into Monday, with targets at $500 and possibly $495. The psychological 5000 level on the S&P is now in range, and the bears will likely push toward it early in the week. Below $494, there's little standing in the way of a move to $475. SPY is already down 18% from its highs. Could it drop another 10% to $450? Absolutely. Will it drop with the same speed and intensity we saw over the last two sessions? Probably not. Once full capitulation occurs, the market will likely rip back toward $535—and possibly beyond—but timing that move is extremely difficult. Our models are designed around what is "typical" market behavior, not black swan events. That’s why it's critical to rely on the premarket report for the most accurate, updated guidance—it incorporates the latest data and AI analysis just before the open. Until then, the best trade setups will likely continue to come from selling strength—ideally into $530 resistance. Long opportunities will only be considered if there's a break below today’s lows followed by a sharp reversal. A failed breakdown in that scenario could offer a high-probability long. But if the MSI remains bearish and continues printing extended downside targets, we’ll stay sidelined on longs. Any surprise rally could trigger a sharp short squeeze, so continue to trade what you see and stay flexible as new data comes in. The model’s projected low is $475, marking a 20%+ correction. The market is overdue for a pause, but until we see signs of stability, the bears remain in full control and will likely sell every rally attempt. Watch the MSI closely—it continues to provide vital insight and helps traders stay aligned with the dominant trend. Respect extended targets—they often mark strong herd behavior and high-conviction momentum. Use the MSI in combination with our model levels to stay on the right side of the move. If you’re not already leveraging these tools, connect with your rep—they’re absolute game changers in navigating volatile, high-risk markets like this.
Dealer Positioning Analysis
Summary of Current Dealer Positioning:
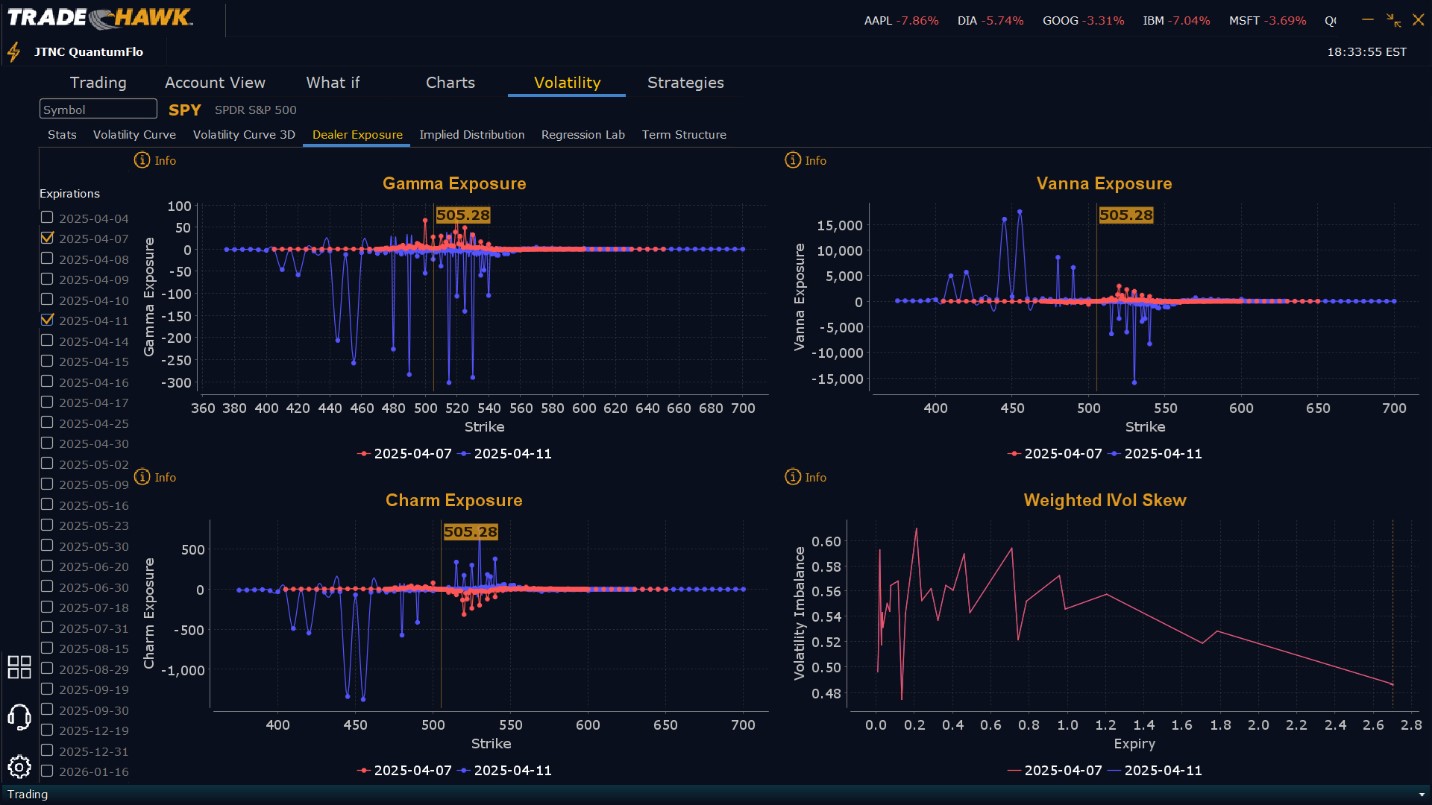
Dealers are selling $506 to $540 and higher strike Calls while also selling very small quantities of $500 Puts indicating the Dealers belief $500 may hold as a low on Monday. It’s a small position so take this with a grain of salt. Dealers do not sell close to the money Puts without having a strong belief that prices will not fall further. Clearly Dealers believe any upside is also limited to $520 but with the sale of Puts, Dealers are displaying some belief that the market may resist further declines. To the downside Dealers are buying $505 to $483 and lower strike Puts in a 1:3 ratio to the Calls/Puts they are selling, implying a bullish posture for Monday. This positioning has changed from more bullish to very bullish. But like yesterday, on the surface this positioning is misleading. Dealers are selling huge quantities of Calls very close to the money which tells us that they do not believe price will move beyond $510 to $515. We would not interpret much from the ratio for Monday and instead simply look at the volume of Calls being sold vs. Puts being sold. Calls dominate which means no matter what happens, Dealers do not see price moving higher, even if it stalls at $500.
Looking Ahead to Next Friday:
Dealers are actively selling Calls from $543 to $570 and beyond, while buying $506 to $542 Calls signaling their desire to participate in any relief rally next week. Dealers have bought large quantities of Calls which reinforce this belief. Perhaps Dealers believe tariffs will be negotiated and price will rally later next week. To the downside, Dealers are buying Puts from $505 to $445 and lower in a 1:1 ratio to the Calls they’re buying/selling. This reflects a neutral to slightly bullish outlook for next week. Dealer positioning has shifted from bullish to slightly bullish/neutral. Dealers have increased their protection levels we haven’t seen in a long time. Their positioning certainly shows an openness to the possibility that price could rally next week. We've emphasized all week that our model is pointing to worsening financial conditions and that investors should purchase downside protection. Once again that advice was salient today. At some point the market will put in a two or three day relief rally, which will give all those who did not head this warning to secure downside protection. We advise reviewing Dealer positioning daily for directional clues. These positions evolve quickly, and tracking them is essential for staying ahead of shifting market sentiment.
Recommendation for Traders
Today’s 5.84% plunge ranks among the most significant single-day declines in market history. While October 19, 1987—Black Monday—still holds the record with a staggering 20.47% drop, there have been more than fifteen instances in the past four decades where markets fell between 4.8% and 7%. Today was another grim entry on that list. What was labeled by the administration as "Liberation Day" lived up to its name—liberating investors from trillions in market value. Unfortunately, our model indicates this may not be the end of the selloff. It sees the current volatility as just the early innings of an escalating trade war, with more retaliatory moves likely to come. The April 2nd tariffs could mark the beginning—not the resolution—of a prolonged and potentially dangerous standoff. Historically, trade wars have at times been precursors to actual conflicts, elevating the risks beyond just the economic realm. While we support efforts to achieve a fairer global trade landscape, we believe diplomacy requires precision. The current approach feels less like using a scalpel and more like swinging a chainsaw—risky, blunt, and potentially reckless. Looking ahead to Monday, a break below $505 opens the path toward $495, and possibly even $475, as downside momentum continues. While a brief consolidation or a relief rally to $520 is possible, we remain in favor of selling into strength rather than fighting the prevailing downtrend. Bulls remain sidelined until $535 is convincingly reclaimed—an outcome that appears unlikely in the near term. Capital preservation remains paramount. We urge traders to stay cautious: trade small, carry downside protection, and remain flexible. In this environment, your edge comes from reacting to price—not predicting it. Focus on failed breakout or failed breakdown setups at key technical levels, especially those confirmed by the MSI. These tend to offer the best risk/reward profiles. Counter-trend trades should only be considered when price is testing major levels and broader conditions support the move. Stay nimble. Stay disciplined. The bears are firmly in control—for now—but sentiment can shift quickly. As always, check our premarket analysis before 9:00 AM ET for updated levels and actionable signals.
Good luck and good trading!
