Market Insights: Thursday, April 3rd, 2025
Market Overview
Markets experienced a brutal selloff Thursday, their worst single-day drop since the pandemic in 2020, after President Trump’s “Liberation Day” tariffs sent a shockwave across global financial markets. The Dow collapsed by more than 1,700 points, marking its fifth-largest point drop in history. The S&P 500 cratered nearly 5%, and the tech-heavy Nasdaq plunged 6% as investors reacted violently to the sweeping nature of the tariffs. The move came a day after Trump unveiled a two-step plan imposing a baseline 10% duty on all U.S. trading partners, with much steeper levies for specific countries. China was hit the hardest with a 54% effective rate, throwing tech giants like Apple into turmoil. Apple lost over 9% as supply chain concerns mounted, while Nvidia and other chipmakers also dropped sharply, highlighting fears of deepening trade tensions. The tariffs, which impact roughly 185 countries, have now driven the U.S. to its highest effective tariff rate in more than a century. Trump dismissed the market reaction, saying it would eventually “boom,” but markets aren’t buying it yet. Retailers such as Nike and Target saw double-digit losses, and global markets followed suit, with Europe’s STOXX 600 dropping over 2.5% and Japan’s Nikkei sinking 2.7%. The 10-year Treasury yield tumbled to 4.05% as a flight to safety took hold, and the U.S. dollar slumped to its lowest level since last October.
SPY Performance
SPY was slammed for a 4.79% loss, closing at $537.47 after opening at $544.97. The ETF reached a high of $547.97 before plunging to a session low of $536.91. Trading volume soared to 111.76 million shares, nearly double the average, reflecting the magnitude of the selloff. Thursday’s session wiped out any hope of a tariff “nonevent,” sending SPY deep below its 200-day moving average and confirming the bears' grip on the market.
Major Indices Performance
Small caps took the worst of the damage, with the Russell 2000 plunging 6.47% to lead the decline. The Nasdaq followed with a devastating 5.97% drop, weighed down by massive losses across big tech. The S&P 500 fell 4.79%, while the Dow gave up 3.98% or nearly 1,700 points, in one of its worst point losses on record. The steep losses came as traders digested the far-reaching implications of Trump’s tariffs, which sparked concerns over global growth, corporate earnings, and supply chain stability. Defensive sectors didn’t provide shelter, as the selloff was broad-based and relentless throughout the session.
Notable Stock Movements
The entire Magnificent Seven was hammered, led by staggering losses in Apple, Amazon, and Meta, each down more than 9%. These megacap names, once seen as safe havens, bore the brunt of trade and tech anxiety. Nvidia also fell sharply, losing over 7% on worries over its exposure to China and the AI supply chain. Netflix managed to fare “better,” closing down just 2%, but every name in the group ended deep in the red. The collapse across this elite group erased hundreds of billions in market cap, underscoring how quickly sentiment can shift when macro conditions deteriorate.
Commodity and Cryptocurrency Updates
Crude oil plummeted 6.96% to settle at $66.72, as markets priced in the likely hit to global demand from the trade war escalation. Our model sees continued downside for oil, potentially toward $60. Gold also slipped 1.18% to $3,128 despite the market turmoil, as panic selling spilled into safe-haven assets. Bitcoin declined 4.32% to close just below $82,000. While we remain long-only between $77,000 and $83,000, today's close near the lower end of that range suggests caution until conditions stabilize.
Treasury Yield Information
The 10-year Treasury yield dropped 3.53% to close at 4.047%, its lowest level since October 2024. The move reflects intense risk-off sentiment and a dash for safety following the tariff bombshell. Yields remain below the critical 4.5% threshold that typically pressures equities, but the sharp fall may be signaling deeper economic concerns. If yields continue sliding toward 4% or lower, it would confirm broader fears of slowing growth, further intensifying bearish momentum in stocks.
Previous Day’s Forecast Analysis
The model projected a wide trading range of $540 to $560 with a bearish bias unless $565 was reclaimed and held. SPY was expected to drift lower on failed breakouts and a break below $558 was flagged as an early warning of deeper losses. Key support levels were outlined at $552 and $548, with downside targets expanding toward $540 and $538. The strategy emphasized short trades below $558 and warned against any bullish setups unless the $565 level was overtaken. The outlook was bearish and advised staying nimble in a volatile, macro-driven environment.
Market Performance vs. Forecast
Thursday’s price action followed the bearish forecast to a T. SPY opened at $544.97 and collapsed as expected, crashing through multiple support levels and never threatening the $565 mark. The session low of $536.91 and close at $537.47 showed just how accurate the model’s projected range of $540 to $560 was. Short trades initiated under $558 proved highly effective, with key levels at $552, $550, and $548 failing to hold. The model called for heightened volatility and a trending session, which is exactly what transpired following the previous evening’s tariff bombshell. Traders who followed the roadmap were well-positioned for the selloff.
Premarket Analysis Summary
In Thursday’s premarket analysis posted at 10:26 AM, SPY was trading at $546.10 with a bias level identified below at $543. The model called for choppy, early attempts at a rebound with limited follow-through and favored long setups from strong support like $543 toward targets at $549, $550, and $552. However, it warned that a failure to hold $543 would likely send prices down to $540 or even $538. The outlook leaned cautiously bullish in the short term, expecting some effort at stabilization, but flagged major risks if support levels failed.
Validation of the Analysis
Thursday’s brutal price action validated the premarket forecast with painful precision. SPY opened near $545 and failed to hold the key $543 level, plunging immediately to the $540 and $538 downside targets. The breakdown aligned exactly with the model’s warning that a breach of $543 could trigger a rapid move lower. The attempt to mount a recovery fizzled fast, and short trades from above $543 quickly became the only viable play. The premarket analysis once again proved to be a reliable blueprint, delivering clear and actionable levels that played out amid extraordinary market turmoil.
Looking Ahead
Friday brings the all-important Jobs Report and a closely watched appearance by Fed Chair Powell. After Thursday’s historic collapse, markets are in desperate need of stability. However, it’s hard to imagine a scenario where economic data or Powell’s remarks fully soothe investor nerves. The job numbers will likely shape expectations for Fed policy into the summer, and any signs of labor market weakness could intensify fears of stagflation. Conversely, a strong jobs print may rekindle inflation concerns. Either way, Friday promises more volatility and another pivotal session in a rapidly shifting macro landscape.
Market Sentiment and Key Levels
SPY closed at $537.47 and is now entrenched below the lower end of a broad bearish trend channel that began in December. Market sentiment is sharply bearish after the tariff-driven rout and there’s no indication that bulls have any control. Major resistance now sits at $540, $543, and $545, with $550 a more distant level. Support lies at $535 and $530, but if $530 fails, a swift drop to $510—the August lows—becomes the base case. The inability to hold even the most basic support levels confirms that bears are fully in charge and sentiment is likely to remain negative unless Friday delivers an unexpected reprieve.
Expected Price Action
Our AI model projects a maximum trading range of $526 to $550 for Friday, offering actionable intelligence pointing to potential trending behavior with pockets of choppy reversals. The model remains firmly bearish unless SPY reclaims $545. If that happens, look for a potential retest of $550. However, if the market breaks below $530, there is virtually no support to prevent a fast move toward the August low at $510. Any bounce is likely to be sold into aggressively, and failed rallies near $543 or $545 could be ideal short setups. Traders should expect volatility and lean bearish unless a major catalyst reverses sentiment.
Trading Strategy
Traders should focus on short setups near resistance levels like $543, $545, and $550. A failed breakout from any of these zones should be met with quick downside plays toward $535, $530, and possibly $525. Long setups are viable only if SPY holds above $530 and prints a clear failed breakdown—otherwise, avoid bottom-fishing. The VIX has spiked to @ 30 which, while elevated, does not yet signal capitulation. While we continue to advise reducing position size and using wider stops to avoid getting shaken out by intraday volatility, watch for the VIX to spike above 35 intraday and then CLOSE below 35. This should indicate an at least temporary floor in the market. The bears have complete control and risk is skewed to the downside. Watch how SPY reacts around $543 and $530 for clues on direction.
Model’s Projected Range
The model’s maximum projected range is $525.75 to $551.25, with the Put side dominating—a wide but narrowing spread that suggests trending price action on Friday, interspersed with periods of chop. SPY closed at $538, near the lows of the day, capping off a brutal session for investors. Key resistance levels are now at $540, $543, and $545, while support rests at $535 and $530. Below $530, support is virtually nonexistent. Above $545, resistance extends toward $550. SPY also closed below its 200-day moving average and near the session low amid a relentless tariff- and inflation-driven selloff that began the moment the new tariffs were announced. There’s little point in discussing where bulls need to push price to regain control; they have none. The bears are firmly in charge and appear poised to drive the market toward the August lows at a minimum. Critical levels like $540 failed to hold, and this zone now flips to strong resistance. A break below $530 opens the door to a move toward the August low around $510. Dip buying is off the table for now; today’s price action made it clear the market cannot absorb the weight of the new tariffs. SPY is trading near the lower bounds of a broad bearish trend channel that began in December. While this channel permits movement in either direction, price action is likely to remain contained within it. For the foreseeable future, momentum belongs to the bears.
Market State Indicator (MSI) Forecast
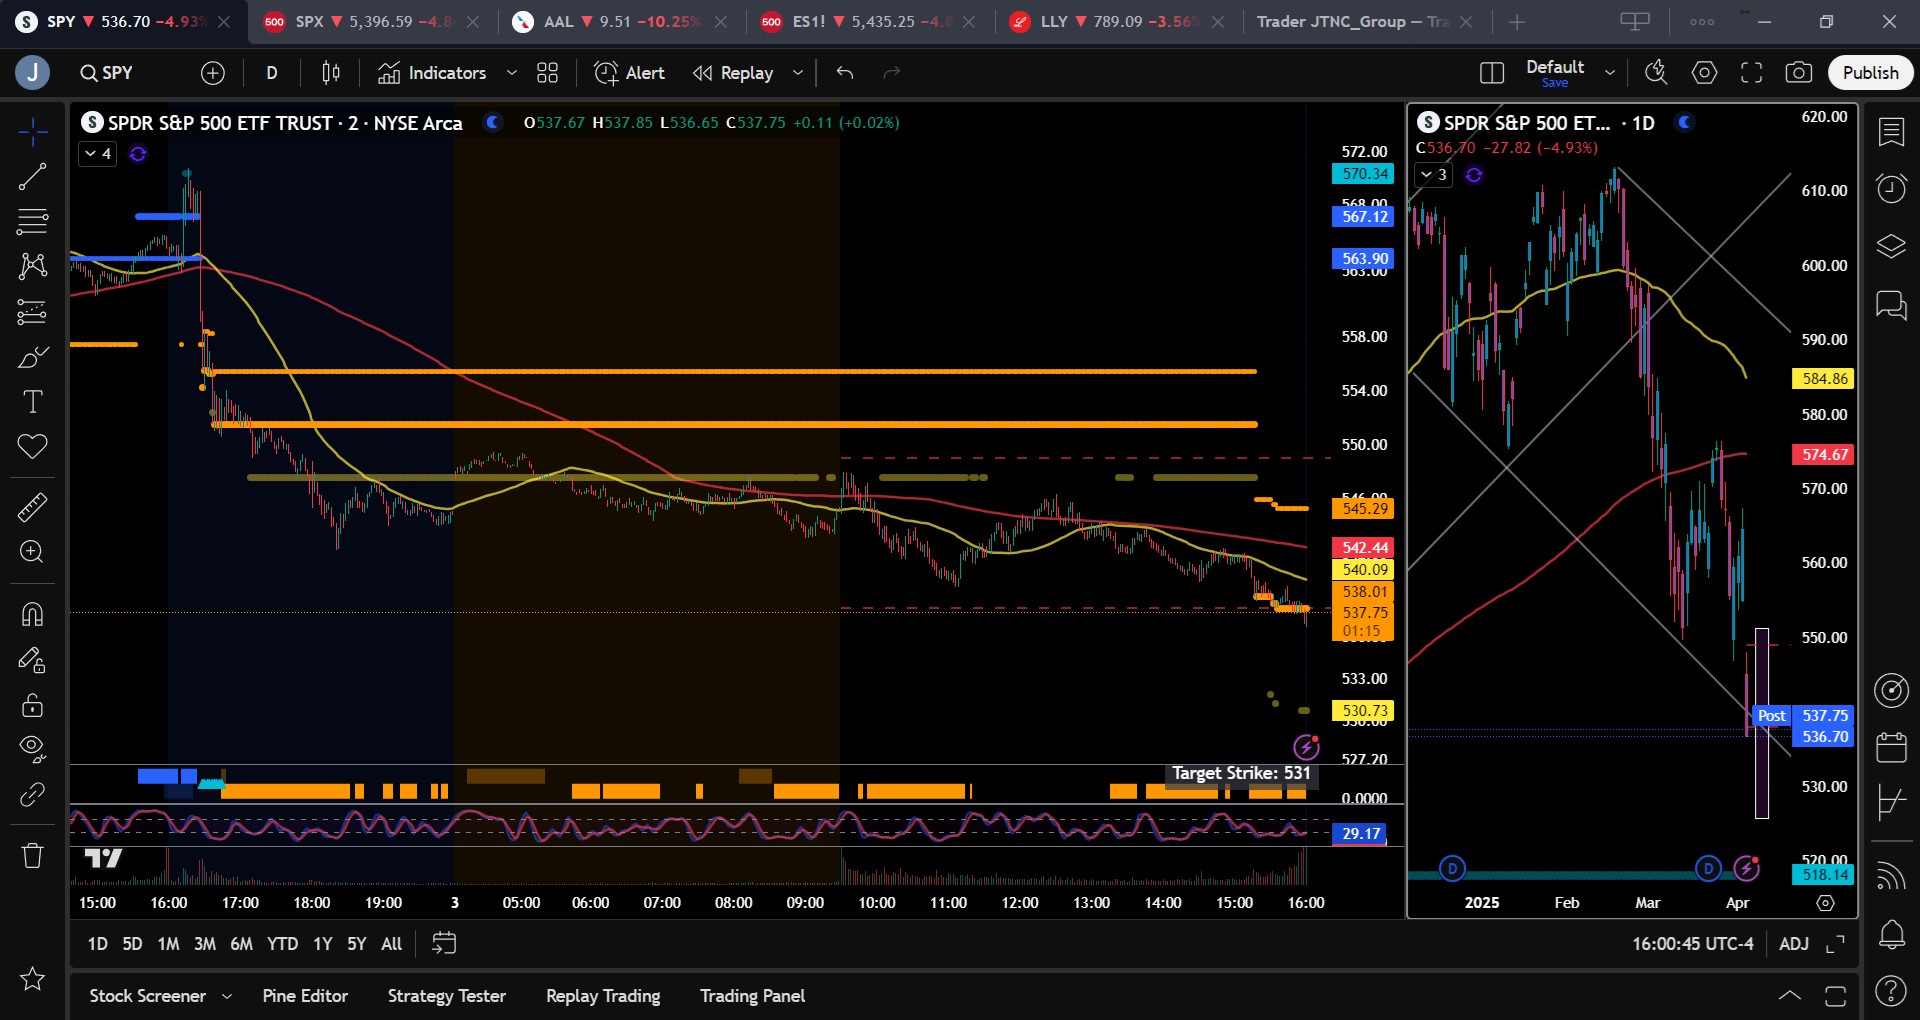
Current Market State Overview:
The MSI is currently in a Bearish Trending Market State, with price closing at MSI support. There are extended targets printing below. The MSI range is average indicating a strong bear trend. Overnight price fell over $28 in a tariff sell-off that was unrelenting. The MSI rescaled to a bearish state and printed extended targets virtually all day. The MSI range was narrow which kept price from completely collapsing as most of the move came overnight. All day the MSI was unchanged but by 3:15 pm, the MSI finally began rescaling lower once again and continued to print extended targets below which led to price falling into the close. Currently MSI resistance is $545.29 and support is at $537.76.
Key Levels and Market Movements:
On Wednesday, we stated that if the week’s lows “fail to hold, a significant leg lower is likely.” We also noted, “Our model suggests that the post-market decline is just the beginning, with Thursday likely to bring new lows.” Finally, we warned, “There’s little support below $548, making a drop to $546—and potentially $540—increasingly likely.” Once again, the day unfolded according to our plan. Armed with our levels and game plan in hand, we looked to sell any rallies below $548, targeting $546 and possibly $540. At the open, price rallied to $548.06. With the MSI in a bearish state and extended targets printing throughout the premarket, we initiated a short position on a double top. Sure enough, the MSI resumed printing extended targets, and price quickly broke lower. The move was so swift we didn’t have time to hit our first target at $546. Instead, we went to the premarket levels and took initial profits at $543, moving our stop to breakeven. We set our second target at $540—and reached it before 11 a.m. Afterward, price attempted a rally, and extended targets stopped printing. But we weren’t convinced by the move and held our runner, anticipating further downside. Price climbed to $546.40 but failed to break higher, so we kept our position open with a stop at breakeven. Ideally, we hoped for a revisit of $548 to reload short, but it never quite got there. Late in the session, both MSI and SPY gave way, and price moved lower into the close. We took final profits at MSI support at $537.75, wrapping up a clean, one-and-done trade that took no heat and added to an already strong week. This is the result of building a solid trading plan, following it with discipline, and allowing the MSI and model levels to guide each decision. The MSI shows who’s in control, when control shifts, and highlights actionable support and resistance levels for precise entries and exits. When combined with our model’s levels and daily strategy, it consistently keeps us aligned with dominant market forces. The MSI provides this level of precision day in and day out—helping traders avoid trouble, stay in sync with momentum, and take profits with confidence. We strongly recommend incorporating the MSI into your trading toolkit. When paired with a well-structured plan, it can meaningfully enhance your long-term success.
Trading Strategy Based on MSI:
Friday brings the monthly jobs report and a speech from Fed Chair Powell—both capable of shaking an already fragile market. The path appears set toward the August lows around $510. While the descent won’t be a straight line, that level remains a viable downside target for the bears. Bulls have no realistic path to regain control without a meaningful external catalyst. Perhaps pressure from Congress against the latest tariffs could serve as such a trigger. Overnight, we anticipate continued downward pressure, possibly reaching $530. Support sits at $535 and $533, where some short covering could temporarily slow the decline. We'll be watching for signs of capitulation—specifically, a spike in the VIX above 35 followed by a close below that level, which would suggest a potential short-term bottom. The VIX did reach 30 today, but that’s not high enough to force a meaningful flush from the market. For Friday, the best trade setups will likely come from selling rallies—ideally up to $548. We will consider long opportunities only if price breaks below today’s lows and then sharply reverses. A failed breakdown is often a high-probability entry. However, we will not take any long setups if the MSI remains in a bearish state and continues printing extended targets to the downside. Volume doubled today, indicating plenty of trapped shorts. Any surprise push higher could trigger a sharp squeeze. SPY closed below its bearish trend channel and may attempt to re-enter it on Friday or Monday. But with the jobs report hitting premarket, Friday is a “trade what you see” kind of day—especially as the market digests fresh data. The model’s projected low is $525.75, so even a break of today’s lows may offer only $10 more downside—equivalent to around 100 S&P points. The market is overdue for a pause, so while we’re positioned to sell strength, we wouldn’t be surprised by a squeeze back toward $550. Below $530, support is virtually nonexistent, which puts $525 in play—even as soon as Friday. The bears remain fully in control and will likely press every rally attempt. Watch the MSI closely—it continues to provide vital insight and helps traders stay aligned with the dominant trend. Respect extended targets—they often mark strong herd behavior and high-conviction momentum. Use the MSI in combination with our model levels to stay on the right side of the move. If you’re not already leveraging these tools, connect with your rep—they’re absolute game changers in navigating volatile, high-risk markets like this.
Dealer Positioning Analysis
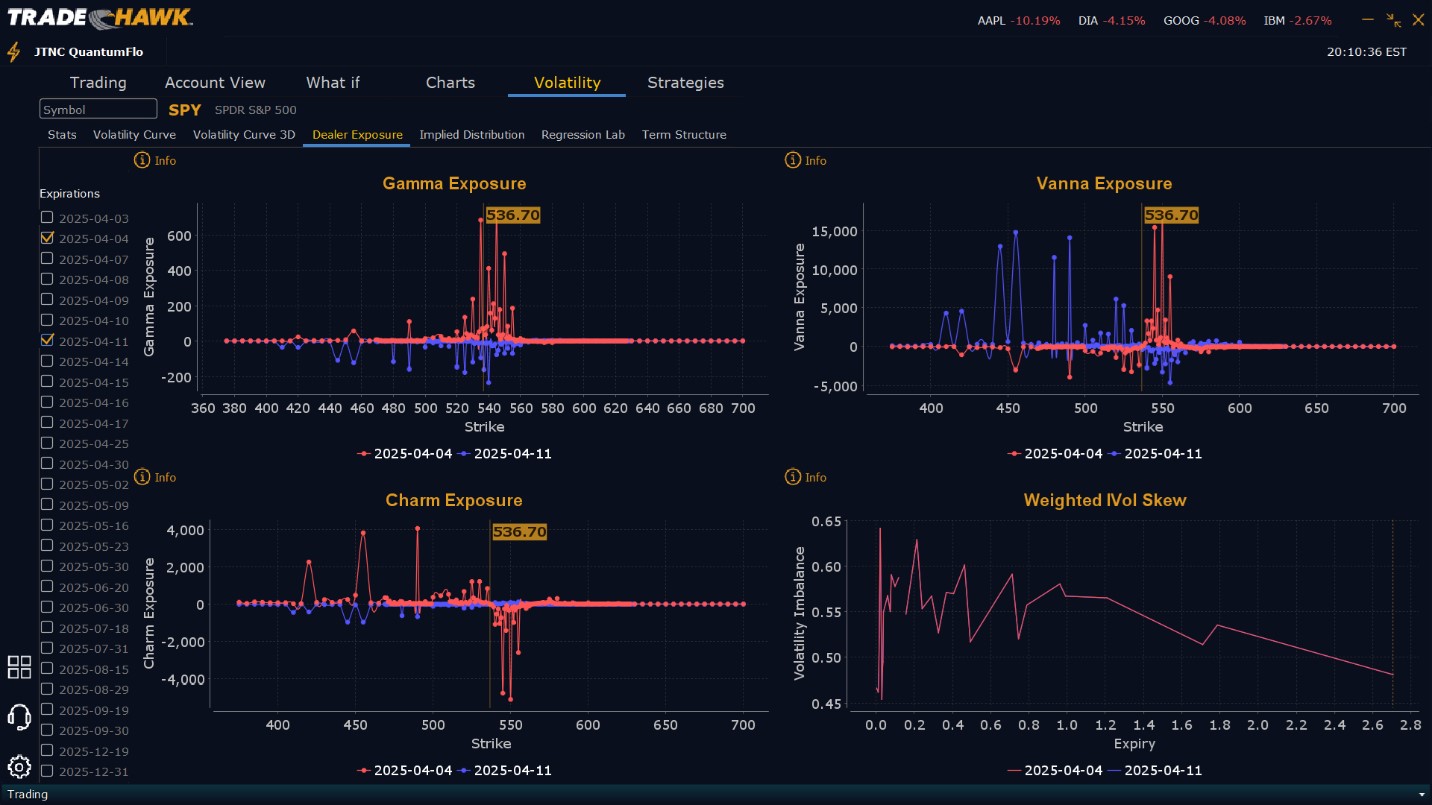
Summary of Current Dealer Positioning:
Dealers are selling $537 to $555 and higher strike Calls while also buying $525 to $535 Puts indicating Dealers believe a possible floor is forming in the market at the current levels. Dealers do not sell close to the money Puts without having a strong belief that prices will not fall further. Clearly Dealers believe any upside is also limited to $545 to $550 but with the sale of Puts, Dealers are displaying the belief that the market may resist further declines. That said, the volume of Puts being sold is small compared to the volume of Calls being sold. Therefore its likely on Friday SPY takes a day to consolidate in a relatively narrow range between $535 and $545. To the downside Dealers are buying $524 to $490 and lower strike Puts in a 2:3 ratio to the Calls/Puts they are selling/buying, implying a bullish posture for Friday. This positioning has changed from bullish to more bullish. But like yesterday, on the surface this positioning could be misleading. Dealers are selling huge quantities of Calls which tells us that they do not believe price will move beyond $545 to $555. But at the same time, Dealers are selling very close to the money Puts in small size. Its likely Dealers feel price will squeeze a bit on Friday or at a minimum, move in a narrow range.
Looking Ahead to Next Friday:
Dealers are actively selling Calls from $562 to $590 and beyond, while buying $537 to $561 Calls signaling their desire to participate in any relief rally next week. Dealers have bought large quantities of Calls which reinforce this belief. Perhaps Dealers believe tariffs will be negotiated away and price will rally late next week. To the downside, Dealers are aggressively buying Puts from $536 to $480 and lower in a 3:2 ratio to the Calls they’re buying/selling. This reflects a decisively bullish outlook for next week. Dealer positioning has shifted from outright bearish to bullish. Dealers are loaded with protection down to levels we haven’t seen in a long time. But their positioning certainly shows an openness to the possibility that price could rally next week to as high as $560. We've been emphasizing all week that our model is pointing to worsening financial conditions and that investors should purchase downside protection. That advice certainly was critical today. At some point the market will put in a two or three day relief rally, which will give all those who did not head this warning to secure downside protection. We advise reviewing Dealer positioning daily for directional clues. These positions evolve quickly, and tracking them is essential for staying ahead of shifting market sentiment.
Recommendation for Traders
Today’s 4.84% market drop ranks among the worst single-day declines in history. While the most severe in modern times remains the 20.47% crash on October 19, 1987, there have been over fifteen instances in the last four decades where markets have fallen between 4.8% and 7%. Still, today’s selloff was one for the record books—and not in a good way. What was billed by the administration as "liberation day" certainly lived up to its name—liberating investors from trillions in market value. Unfortunately, our model suggests the selling is far from over. It anticipates further escalation in the trade war, with ongoing tit-for-tat measures. The April 2nd tariffs may mark only the beginning—not the end—of this economic standoff. Historically, trade wars have sometimes served as a precursor to actual wars, making the current situation not just economically damaging, but geopolitically dangerous. While we support the idea of a more balanced global trade environment, we, like many others, would prefer the use of a scalpel—not a chainsaw. The current approach is both risky and potentially reckless. Looking ahead to Friday, a break below $530 opens the door to $525 and even $520, as the market continues its march toward the August lows. While we could see a brief consolidation or even a relief rally—potentially up to $550—we continue to favor selling into strength rather than fighting the dominant downtrend. The bulls remain completely sidelined until $555 is reclaimed—an outcome that appears highly unlikely in the near term. Until then, protection is key. With the outcome of this economic standoff unknown, preserving capital should be the top priority. We continue to recommend caution: trade small, carry downside protection, and stay flexible. When unexpected catalysts hit, your edge comes from trading what’s in front of you. In this environment, we recommend focusing on failed breakout or failed breakdown setups at key levels. These typically offer the best risk/reward, especially when confirmed by the MSI. Counter-trend trades should only be considered when price is testing a critical level and broader conditions align. Stay nimble and disciplined. The bears have complete control, but sentiment can shift quickly. Focus on trading from the edges, where risk is defined and probabilities improve. As always, review our premarket analysis before 9:00 AM ET for the latest levels and signals.
Good luck and good trading!
