Market Insights: Wednesday, April 30th, 2025
Market Overview
Markets staged an impressive comeback Wednesday, rebounding from steep early-session losses sparked by a surprise GDP contraction that marked the first economic shrinkage in three years. The Dow rose 0.35%, extending its longest win streak of the year, while the S&P 500 edged up just over 0.1% after dipping more than 2% intraday. The Nasdaq pared a deep selloff to close just shy of flat. Stocks were rocked in the morning after the Bureau of Economic Analysis reported a 0.3% annualized GDP decline in Q1, worse than the 0.1% drop economists expected. The contraction stemmed largely from import spikes as businesses moved to frontload inventory in response to tariffs, rattling investor confidence. The GDP report capped a volatile April marked by whiplash from President Trump's aggressive trade policy. However, sentiment improved sharply after a Chinese state-linked social media account posted that U.S. officials had reached out to resume negotiations, hinting at a possible de-escalation. Additional data Wednesday showed a pullback in private hiring, as ADP’s report described a cautious labor environment. Meanwhile, the Fed’s preferred inflation metric—core PCE—came in hotter than expected at 3.5%, complicating the path forward for interest rate policy. After the close, Microsoft and Meta helped ease nerves. Microsoft topped earnings estimates on strong cloud results, while Meta impressed investors with better-than-expected Q1 numbers and upbeat Q2 guidance despite ongoing concerns about tariffs' effects on advertising demand. Both tech giants offered a welcome dose of strength to round out a turbulent session.
SPY Performance
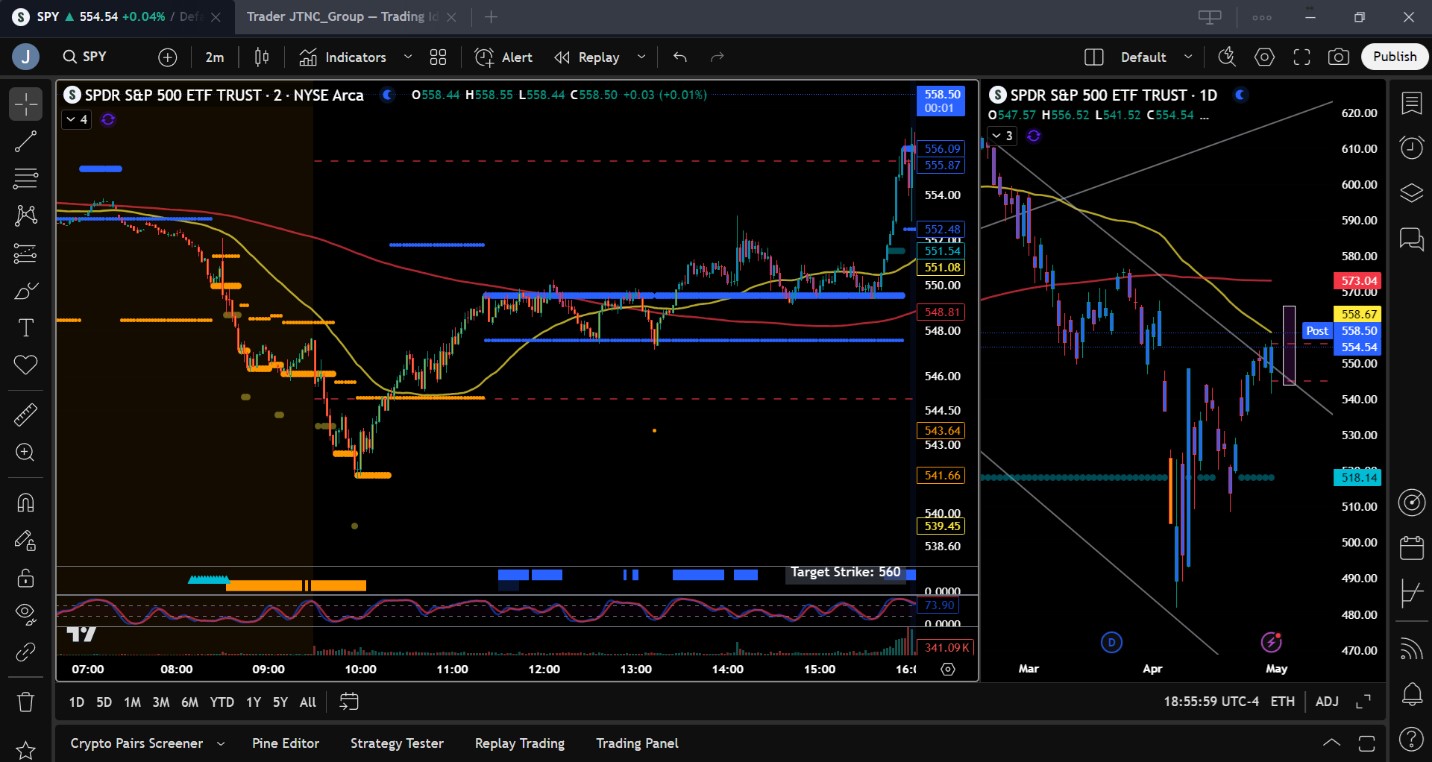
SPY ended the session nearly unchanged, ticking up 0.01% to close at $554.25. The ETF opened sharply lower at $547.26, briefly plunged to $541.52, then staged a powerful reversal, rallying to a session high of $556.50 before settling near prior highs. Volume surged to 77.97 million shares, well above average, reflecting heightened investor participation during the volatile session. The strong intraday rebound and higher close reaffirm bullish control, especially as SPY held above the critical $550 mark for a third straight session.
Major Indices Performance
The Dow led the major indices with a 0.35% gain, securing its longest winning streak of 2025 despite early turbulence. The S&P 500 managed a slim 0.01% increase after plunging over 2% intraday, showing notable resilience. The Nasdaq slipped 0.09%, weighed by weakness in tech before Meta and Microsoft earnings bolstered confidence. The Russell 2000 lagged significantly, dropping 0.81% as small caps bore the brunt of economic jitters. Markets initially tumbled following a negative GDP surprise and hotter-than-expected inflation data, but a late-session rally was driven by hopes for renewed U.S.-China negotiations and solid tech earnings. Defensive sectors were mixed, with some rotation into safer names during the morning dip before investors rotated back into cyclicals.
Notable Stock Movements
The Magnificent Seven stocks were mostly red on the day, with Tesla and Amazon dragging the group lower. Tesla led the losses, as sentiment soured on growth names following the GDP miss. Amazon also fell further, extending weakness tied to tariff concerns. Microsoft and Meta bucked the trend in after-hours trading, both rising following strong Q1 results and solid forward guidance. Apple and Netflix were essentially flat, reflecting a day of caution among big tech names as investors awaited earnings clarity. The group’s mixed performance highlighted the market's ongoing tension between company-specific results and broad macro uncertainty.
Commodity and Cryptocurrency Updates
Crude oil dropped sharply by 3.62%, settling at $58.23 as macroeconomic concerns pressured demand expectations. The move confirms our bearish outlook, and we now target $50 over the coming weeks unless a meaningful dollar drop sparks a rebound. Gold slipped 1.03% to $3,299 as risk appetite improved into the close, dulling demand for safe havens. Bitcoin edged slightly higher by 0.19%, closing above $94,500. We maintain our strategy of buying between $77,000 and $83,000 and taking profits above $85,000, with a firm no-buy zone below $77,000 due to downside risk.
Treasury Yield Information
The 10-year Treasury yield ticked down 0.14% to close at 4.168%, offering minor relief to equities after a morning spike. Despite the decline, yields remain elevated, and with inflation rising faster than expected, upward pressure on yields could resume. A move above 4.5% continues to be a key threshold that could shift market sentiment decisively lower. A sustained rise above 5% would likely trigger a sharp correction in stocks, potentially exceeding 20%.
Previous Day’s Forecast Analysis
Tuesday’s forecast projected a trading range of $545.25 to $564.00 with a bullish bias, anticipating upside targets of $558 and $560 if SPY held above $550. Resistance was expected near $555, with support levels at $550, $548, and $545. The strategy favored long trades above $550, with caution urged near resistance due to potential volatility from scheduled economic data. A break below $545 was seen as a possible shift toward bearish control and a move toward $535.
Market Performance vs. Forecast
Wednesday’s session played out largely in line with expectations. SPY opened at $547.26, below the $550 support zone, then fell sharply to a low of $541.52 before rebounding aggressively to a high of $556.50 exceeding initial resistance at $555 and nearly touching the $558 upside target. The intraday recovery and close at $554.25 confirmed the model's view that bulls retained the upper hand above $545. The forecasted range was respected, with intraday volatility creating strong two-way trading setups, particularly for traders who bought near the $545–$548 support levels and sold near $555.
Premarket Analysis Summary
In today’s premarket analysis posted at 8:18 AM, SPY was trading at $552.08 with a bias level identified at $555.50. The outlook leaned “shyly bearish,” expecting tight, midrange chop unless SPY broke above resistance at $555.50. The analysis suggested that if SPY could sustain a move above that level, a drift toward $560 was possible, though fragile. On the downside, a rejection at resistance would likely send prices back toward $549.50, or possibly as low as $545, though a full breakdown was not considered likely. The preferred strategy was fading the edges of the range rather than chasing momentum.
Validation of the Analysis
Today’s trading validated the premarket analysis almost perfectly. SPY dipped sharply below key support early in the session, finding a low at $541.52, then staged a powerful rally back above the $550 level. Resistance at $555.50 capped the advance, with SPY reaching a high of $556.50 before closing slightly lower at $554.25. The day’s action matched the expectation of midrange chop with directional moves at the edges. Traders following the guidance to fade extremes saw strong entries near $545 and exits near $555, confirming once again the accuracy and value of the premarket framework.
Looking Ahead
Thursday brings key economic data with Unemployment Claims and the Manufacturing PMI, both of which could shake markets if they surprise to the upside or downside. Following Wednesday's GDP contraction and inflation uptick, investors are especially sensitive to signals that might shift the Fed’s stance. These reports will play a crucial role in shaping sentiment heading into Friday’s monthly jobs data and could either reinforce the current bullish bias or trigger a momentum shift.
Market Sentiment and Key Levels
SPY’s close at $554.25 keeps bulls in charge, but they face strong resistance overhead. The $555 to $560 zone remains pivotal, with any break above $560 likely to unleash a quick move toward $565. Support rests at $550, $548, and $545, with a break below $545 potentially opening the door to $535 or lower. Market sentiment leans bullish but cautious, especially with fresh economic data on deck. Bulls need to hold above $545 to maintain momentum, while bears will aim to push prices below this level to regain some control.
Expected Price Action
Our AI model projects a trading range of $545 to $562 for Thursday. This is actionable intelligence. The range remains broad, suggesting volatility and potential for trend extension or reversal. With a bullish bias, upside targets remain $560 and $565. If SPY breaks above $560, a parabolic move could follow, especially as short positions get squeezed. On the flip side, a failure to hold $550 or $545 could initiate a decline toward $535. Traders should monitor key levels closely, particularly after Thursday’s data releases, and look for failed breakouts or failed breakdowns to signal directional trades.
Trading Strategy
Long trades remain preferred above $550, targeting $555, $558, and $560. A breakout above $560 would favor continuation toward $565. Short trades become more attractive below $550, with downside targets at $545 and $540, or above $560. Should $545 fail, $535 comes into play as a critical support. Volatility is rising, with the VIX closing at 24.70, so tighter stops are warranted near resistance and looser ones when trading breakouts. In this environment, trade smaller and focus on high-probability setups near our model’s levels. Avoid overexposure ahead of Thursday’s data and prioritize capital preservation over aggressive positioning.
Model’s Projected Range
The model’s maximum projected range for Wednesday is $544 to $566, with the Put side dominating suggesting consolidation and perhaps some retracement of recent gains. Six consecutive days of gains is unusual, so a day or two of consolidation is to be expected. However, with major companies reporting earnings this week, the market could either rip higher or drop sharply. The projected range has narrowed slightly but remains broad. Expect consolidation between the $545 to $560 zone, punctuated by bursts of trending price action. As long as this range holds, a parabolic move higher is likely, potentially squeezing shorts violently. The next upside targets for bulls are $560 and $565. A break below $545, however, could signal the beginning of a corrective move, with $535 as the next key support. A failure there would likely trigger a deeper decline. We continue to favor two-way trading while viewing the current rally as a relief move within a broader bear market context. The market remains vulnerable to another leg down, especially as prices approach the $565–$585 resistance zone, where a retest or even a breach of recent lows becomes more probable. Historically, such declines tend to develop 4 to 16 weeks after an initial bottom. We strongly advise considering protective strategies or trimming long exposure as these resistance levels are tested. Strong earnings may have pulled forward growth that was expected in Q2 and Q3. At the same time, companies are citing tariff-related risks and elevated volatility driven by current administration policies. We anticipate the real impact of tariffs will begin to materialize in late Q2 and Q3. Key technical levels for Thursday include resistance at $557, $560, and $565, and support at $550, $548, and $545. Resistance above $557 is weakening, suggesting a potential breakout above $560 that could lead to a sharp rally toward the 200-day moving average and possibly higher. Thursday's data, Unemployment Claims and Manufacturing PMI, could move markets significantly, just as GDP did today. A decisive close above $585 would hand full control to the bulls, while a break below $545 could open the door to a retest of $535, with a failure there triggering a gap-fill move toward $530. Tariffs, bond yields, and inflation remain the key macro factors shaping market behavior over the next 90 days, or until more clarity emerges from the White House. The VIX closed at 24.70, approaching the 23 level, which should provide additional support for equities. With SPY settling just above $554 again today, bulls are gaining traction as price pushes above the upper boundary of the bear trend channel that has been in place since the December highs. This boundary was back tested and held today; if price continues to hold above it, a new trend channel will likely be drawn in the coming days. Momentum currently favors the bulls, but in such a volatile environment, we recommend staying nimble and ready for swift sentiment shifts.
Market State Indicator (MSI) Forecast
Current Market State Overview:
The MSI is currently in a Bullish Trending Market State, with price closing just below MSI resistance. Extended targets above printed into the close, indicating herd participation in the late afternoon rally. The range is wide with extended targets above, suggesting a strong bullish trend for Thursday. Overnight, the MSI rescaled from a narrow bullish state to a ranging and then bearish state, as price fell following a much weaker-than-expected GDP reading. By the open, price had dropped to major support at $545. With the MSI in a Bearish Trending Market State and extended targets below, price continued to fall to the day’s low of $541.52 before sharply reversing. The MSI stopped printing extended targets below and rescaled to a ranging state, and by noon had shifted to a narrow bullish state, which contained price for most of the afternoon. A late-day rally, driven by anticipation of strong earnings from Microsoft and Meta, pushed price higher, with the MSI rescaling higher once again and printing extended targets into the close. Currently MSI support stands at $552.48 with resistance at $555.97.
Key Levels and Market Movements:
On Tuesday, we noted: “Probabilities favor at least a day or two of consolidation, with a pullback to $550 as a likely minimum.” We also stated, “If $550 fails on a pullback, the six-day streak will end, potentially sending price back to $545 or lower.” Finally, we added, “Bulls are also likely to retest today’s highs, but we believe a first attempt at a breakout above $555 will fail.” With this actionable intelligence in mind, we approached the open well-prepared. SPY tested $545 shortly after the open. With extended targets printing below and a very negative GDP report, we entered short at MSI resistance, knowing the odds of reaching MSI support were close to 70%. Short from $545, our first target was MSI support at $542.60. SPY reached this level before 10 a.m., and we exited 70% of our position. As the MSI rescaled lower again, we took our second target at MSI support at $541.66, banking another 20%. We moved our stop to breakeven and watched for further downside. Just before 10 a.m., SPY set up a textbook failed breakdown, and the MSI stopped printing extended targets. While the strength of the earlier decline gave us pause, we decided to exit and reverse long on the failed breakdown at $543.50. With MSI resistance a bit higher at $545, beyond the $1 minimum rule we follow when taking profits, we took off 70% of our position at that level, unsure if this was a true reversal or just a bounce. We moved our stop to breakeven, knowing the trade was counter-trend, and held runners for a possible continuation. The MSI rescaled to a ranging state, which doesn’t offer the best odds for trading. So, we consulted the premarket to determine our second target and selected the next level up at $545.50, which was hit by 11:30 a.m. With the MSI shifting to a narrow bullish state, we held our remaining runner risk-free, aiming for higher prices. SPY traded in a narrow range within the bullish MSI until 1:10 p.m., when it formed a less-than-perfect failed breakdown at MSI support, catching our attention. Knowing the odds of moving from support to resistance in a bullish state, we reloaded long at $547.55, targeting MSI resistance at $549.65. That level was reached quickly, so we returned to the premarket for the next target and chose $552, which was realized by 2 p.m. We moved our stop to breakeven and held the final 10% runner to see how the session would close. A price spike at 2:04 p.m. nearly got us short, but it happened too fast to act. Instead, we stayed patient, ready to either hit our final target or get stopped out. Into the close, the market ripped higher, with the MSI rescaling bullish and printing extended targets. Given the strength of the move, we decided to hold through the close, taking final profits at MSI resistance at $556.09. Three for three today with a couple of smaller first targets but our runners made all the difference, capping off another strong session of disciplined execution and meaningful profit. Today again reinforced our core mantra: have a solid plan, execute with discipline, and let the MSI and model levels guide every decision. The MSI reveals who’s in control, when control shifts, and where key actionable levels lie enabling precise entries and exits. When paired with our model levels and strategy, it keeps us aligned with dominant market forces. It continues to deliver with high precision, helping traders avoid traps, stay in sync with momentum, and capture profits confidently. We strongly recommend integrating the MSI into your trading toolkit. When combined with a structured plan, it becomes a powerful engine for long-term performance.
Trading Strategy Based on MSI:
Thursday brings more economic data that could move the market. After such a strong two-week run, probabilities favor at least a day or two of consolidation. Strong earnings from Microsoft and Meta are pushing the market higher in the after-hours, but we’re not convinced there's much room to extend beyond $560. A pullback appears likely, and another retest of the bull trend channel from the December highs seems probable. If the bulls stay motivated, they’ll hold price above $550 and push toward $565. Above $557, resistance is weakening, and a break above $560 could trigger a parabolic move toward $575 crushing short positions. Conversely, a failure to hold $550 would invite a test of $545 or lower. It’s likely that an external catalyst, whether earnings, PMI, or Friday’s Jobs Report, will determine the next move. The 200-day moving average also stands as overhead resistance. Longer-term, as long as bulls keep price above $535, they maintain the advantage. Still, the higher price moves, the stronger the bull case. However, in the $565–$585 range, it’s highly likely institutional players begin hedging their long positions, which could cause price to stall or reverse. Of course, with the current administration, surprises can emerge quickly so be prepared to react in real time. Barring unexpected shocks, we expect the market to continue pushing higher overnight before entering a consolidation phase ahead of PMI. This environment should offer solid two-way trading opportunities. As seen today, a failure to hold $545 could open the door to a test of $535, a key line in the sand for bulls. A breakdown below $535 would be significant and could lead to a gap fill toward $525 or lower. While the edge currently belongs to the bulls, that advantage can shift quickly if $535 is lost. Bulls won’t fully reclaim control unless SPY regains $585 so caution is warranted. For Thursday, we recommend focusing on failed breakouts and failed breakdowns, especially near $545 and $560. Avoid trading into extended targets or fighting a wide MSI range. As always, trade what’s in front of you: lean on the MSI and stay nimble. The Premarket Report delivers fresh data and AI-powered insights to shape your daily game plan, while the MSI updates in real time, revealing intraday structure and momentum shifts that help you avoid stale narratives and lagging assumptions. Our model levels highlight high-probability targets and precise entry zones. Together, the MSI and model levels keep you aligned with dominant market forces and help you avoid costly missteps. If you’re not already using these tools, now’s the time. Reach out to your rep—they’re game-changers in a market like this.
Dealer Positioning Analysis
Summary of Current Dealer Positioning:
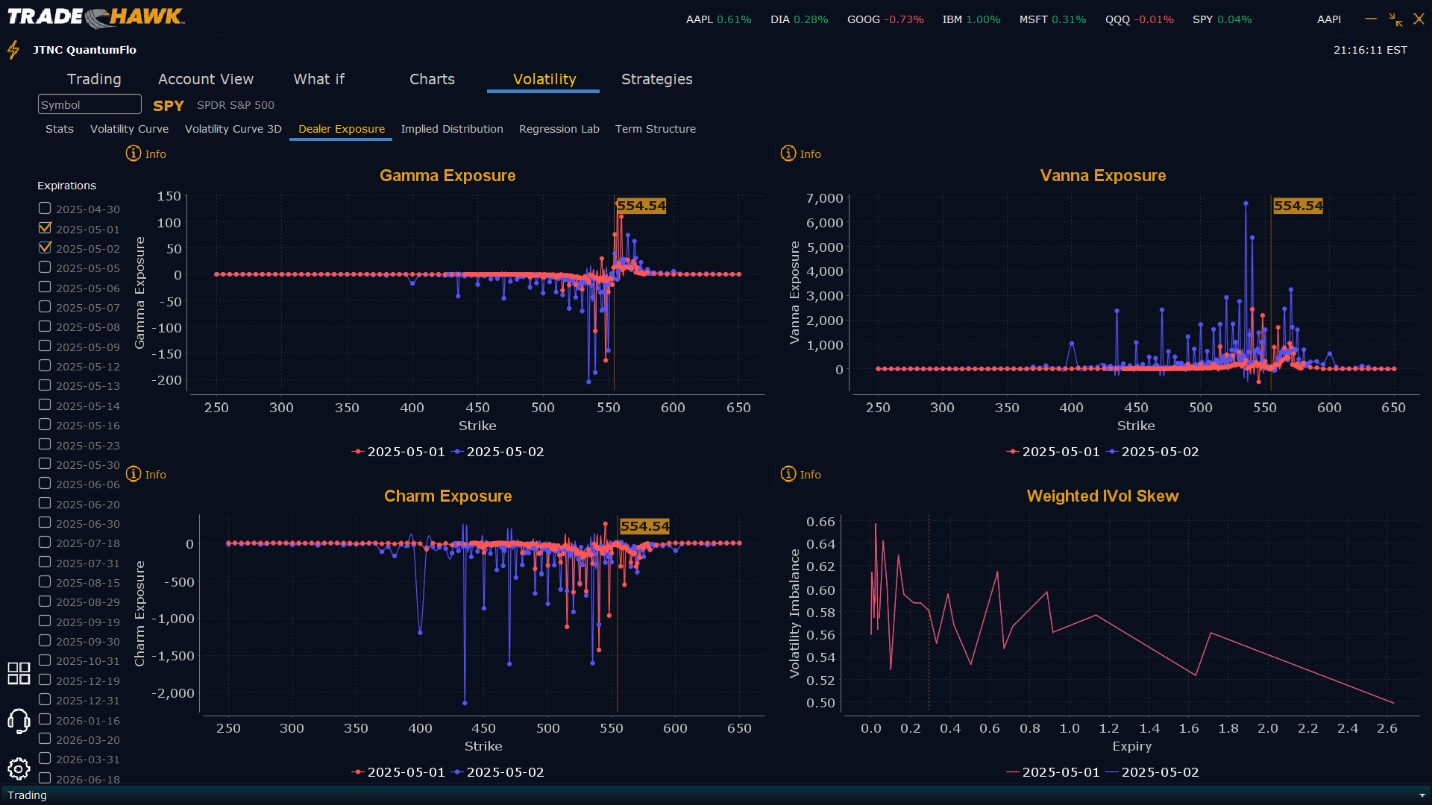
Dealers are selling $555 to $580 and higher strike Calls while selling $545 Puts implying the Dealers belief that prices may pull back slightly but not beyond $545. The upside, however, also looks limited to $560 for Thursday. To the downside Dealers are buying $554 to $515 and lower strike Puts in a 2:1 ratio to the Calls/Puts they are selling, implying a neutral to slightly bullish posture for Thursday. Dealer positioning is unchanged from neutral/slightly bullish to neutral/slightly bullish.
Looking Ahead to Friday:
Dealers are selling $555 to $600 and higher strike Calls implying Dealers believe price may pause near the $565 level. Dealers believe the market peak for this week is $570. To the downside, Dealers are buying $554 to $490 and lower strike Puts in a 3:1 ratio to the Calls they’re buying. This reflects a slightly bearish outlook for the week. Dealers are heavily protected should $540 fail but are also open to prices reaching $570 this week. Dealer positioning is unchanged from slightly bearish to slightly bearish. We advise reviewing Dealer positioning daily for directional clues. These positions evolve quickly and tracking them is essential for staying ahead of shifting market sentiment.
Recommendation for Traders
SPY’s sharp reversal and strong close above $554 suggest bullish momentum is holding, but elevated volatility and heavy economic data ahead demand caution. Long trades are favorable above $550, targeting $558 and $560. If SPY breaks out above $560, a quick move to $565 is likely. Shorts become viable below $548, with downside targets at $545, $540, and possibly $535 as well as above $560. With the VIX closing at 24.70, traders should stay nimble and avoid oversized positions. Use tight stops around resistance and protect gains quickly. Review Thursday’s premarket report before 9 AM ET to account for any overnight shifts in bias or Dealer positioning.
Good luck and good trading!
