Market Insights: Wednesday, April 29th, 2026
Market Overview
US stocks managed to trim their losses on Wednesday as the Federal Reserve held rates steady in a historic 8-4 split vote and investors braced for a massive wave of Big Tech earnings. The Nasdaq actually flipped into positive territory by the close, while the S&P 500 finished just below the flatline and the Dow dropped roughly 0.6%. The Fed's decision to keep the benchmark rate unchanged at 3.5% to 3.75% marked the first time since 1992 that four committee members dissented, highlighting growing divisions within the central bank about monetary policy direction.
The market's attention quickly shifted to the highly anticipated earnings reports from four Magnificent Seven giants - Alphabet, Amazon, Meta, and Microsoft - all scheduled to report after Wednesday's close. Investors are scrutinizing whether these tech megacaps' massive AI spending is finally translating into meaningful revenue growth, especially as the group now represents roughly 35% of the S&P 500's total market value. The composition within the Magnificent Seven has undergone a dramatic transformation since the bear market low, with Nvidia surging to capture about 23% of the group's value compared to less than 4% previously, while Apple's share has fallen below 18% despite adding $1.8 trillion in market value during the bull run.
Oil markets exploded higher on Wednesday after President Trump told Axios he would maintain Iran under a blockade at the Strait of Hormuz until nuclear concerns are addressed. Both Brent crude and US WTI crude spiked more than 4% to cross $111 and $106 per barrel respectively as traders assessed the continuing standoff around this critical oil pathway. Meanwhile, Fed Chair Jerome Powell announced he would remain as governor after his term ends next month, citing legal attacks against the institution and the need to defend the Fed's independence from political interference.
SPY Performance
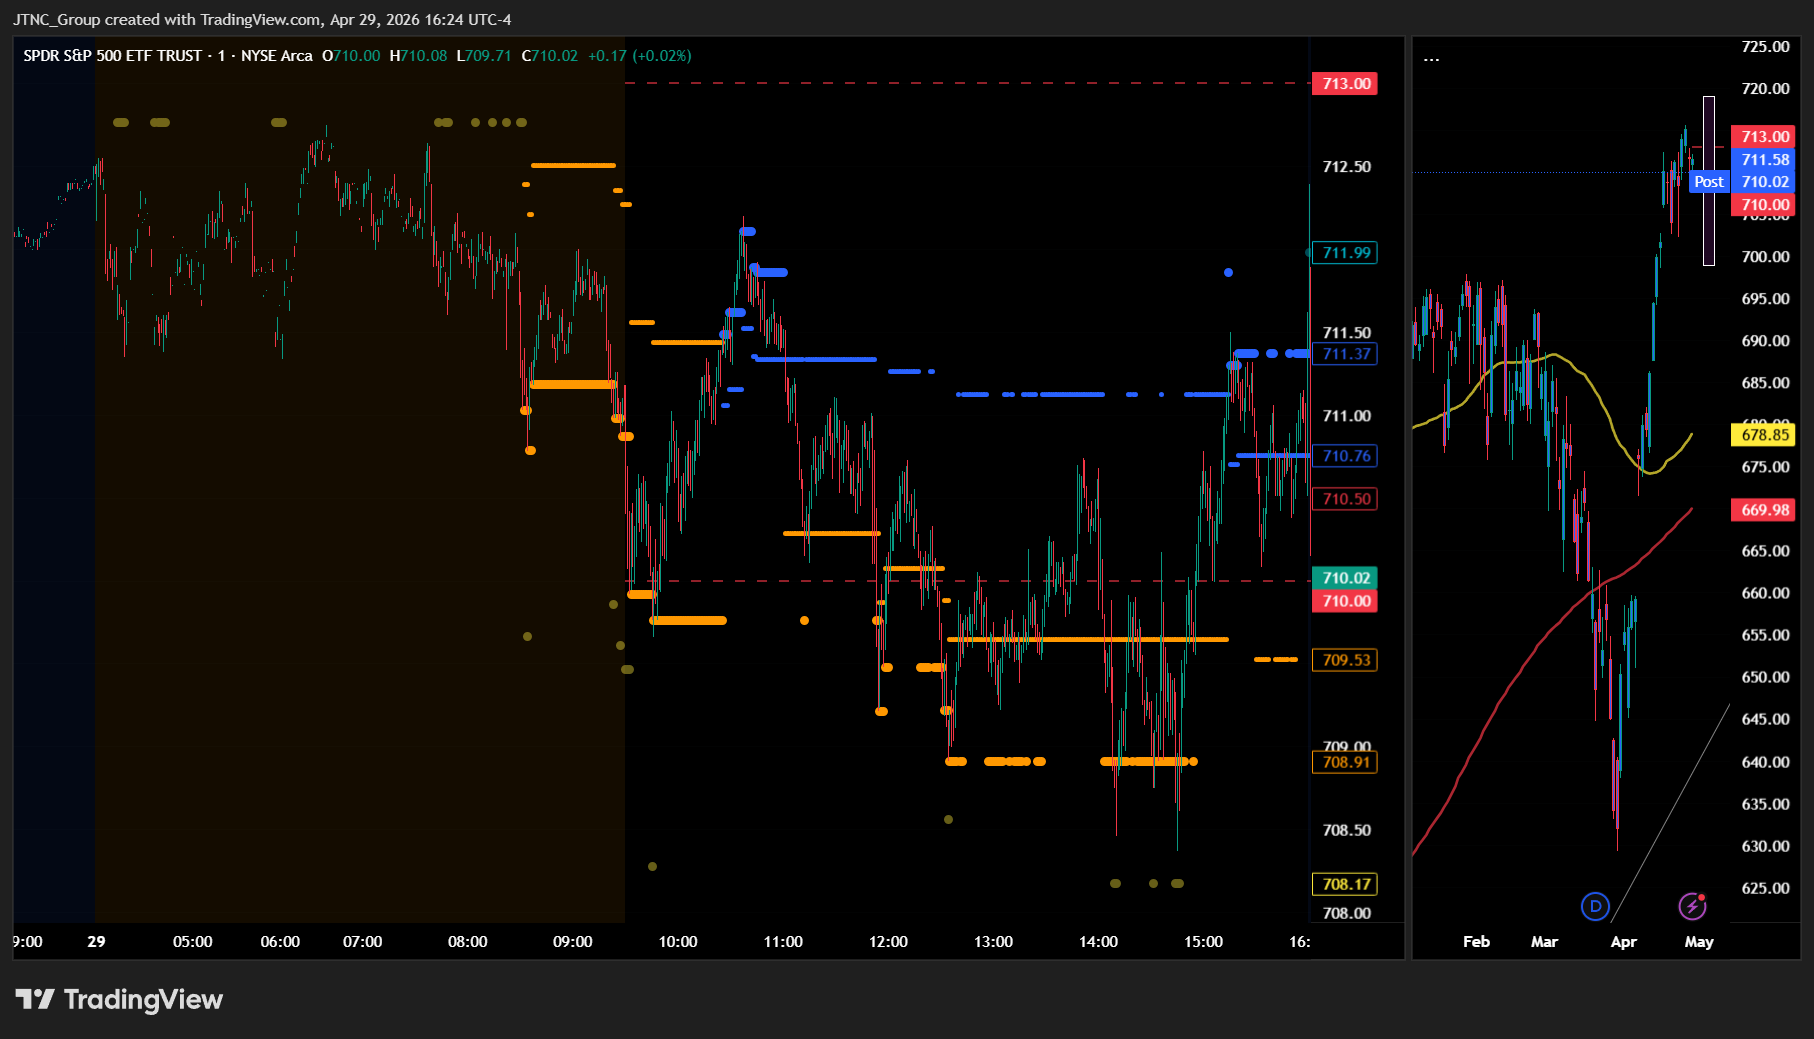
SPY opened at $711 and initially showed signs of stability before encountering resistance that prevented any meaningful upside momentum, setting the stage for a choppy session that ultimately ended nearly unchanged despite underlying volatility. The ETF managed to push to a session high of $712.20 in early trading, but buyers struggled to sustain the advance as mixed market signals and cautious positioning kept participants on edge throughout the day. Selling pressure emerged during the middle portion of the session, driving SPY down to a session low of $708.37 where bargain hunters stepped in to provide support and prevent a more substantial decline. The ETF recovered from its lows to close at $711.63, posting a minimal 0.01% decline that masked the intraday turbulence and reflected the market's inability to establish clear directional conviction. Volume registered 35.31 million shares, falling below average levels and suggesting that many investors remained on the sidelines during the indecisive session. The $3.83 trading range captured moderate volatility as buyers and sellers battled for control without either side achieving a decisive victory, creating a sideways grinding pattern that frustrated momentum traders. While SPY finished essentially flat, the VIX surged 3.81% to 18.51, revealing underlying nervousness that wasn't reflected in the headline equity performance and indicating that fear levels were quietly building beneath the surface calm. The session's action demonstrated the market's current state of equilibrium, with SPY holding within its recent consolidation pattern while participants awaited fresh catalysts to break the stalemate and provide clearer directional guidance for the near term.
Major Indices Performance
The Nasdaq managed to eke out a modest 0.04% gain, demonstrating resilience despite widespread weakness in several of its largest technology components. The tech-heavy benchmark's ability to finish positive came despite notable pressure from semiconductor names and select mega-cap technology stocks, suggesting that underlying breadth and rotation into other technology subsectors helped offset the drag from high-profile decliners.
The Dow posted a more pronounced decline of 0.57%, with the blue-chip benchmark unable to replicate its defensive characteristics from previous sessions. The industrial average's weakness reflected broader market concerns that weighed more heavily on value-oriented and cyclical names within the index, as investors appeared less willing to seek shelter in traditional defensive plays amid the day's mixed trading conditions.
The Russell 2000 suffered the sharpest decline with a 0.72% drop, continuing the small-cap benchmark's struggle to find sustained footing amid ongoing concerns about interest rate sensitivity and growth prospects. The small-cap index's underperformance highlighted how rate-sensitive companies remain under pressure, with investors maintaining their cautious stance toward smaller, growth-dependent names that typically face greater headwinds in uncertain monetary policy environments. The performance spread across indices underscored the continued importance of market capitalization and sector composition in driving relative returns, with technology's mixed showing creating divergent outcomes despite relatively muted moves in the broader market.
Notable Stock Movements
NVIDIA dominated the Magnificent Seven's downside action with a sharp 1.84% decline that intensified pressure on the technology sector and reinforced concerns about growth stock vulnerability in the current market environment. The semiconductor leader's weakness proved particularly damaging given its outsized influence on major indices, creating a ripple effect that helped drag the broader market into negative territory despite mixed signals from other sectors. This marked another session where NVIDIA's volatility underscored how quickly sentiment can shift around these momentum-driven names when investors grow cautious about stretched valuations and positioning.
Amazon and Alphabet managed to buck the group's negative trend by finishing in positive territory, providing some relief that prevented a complete collapse across the mega-cap technology cohort but couldn't fully offset NVIDIA's drag on sector performance. The mixed results within the Magnificent Seven created an interesting dynamic where individual stock fundamentals and technical factors drove varied outcomes, though the net effect clearly tilted negative and contributed to the challenging session for growth-oriented investments. This divergence highlighted how stock-specific dynamics continue to create opportunities and risks within the group, even as broader market conditions remain pressured by elevated yields and commodity volatility.
The Magnificent Seven's predominantly weak performance aligned with the market's risk-off tone that pushed the VIX higher by 3.81% to 18.51, as the group's inability to provide upside leadership left indices without one of their most reliable sources of momentum during uncertain conditions. The cohort's struggles reinforced the challenging environment for high-multiple growth stocks, particularly as rising Treasury yields create headwinds for future earnings valuations and force investors to reassess their appetite for technology sector exposure at current price levels.
Commodity and Cryptocurrency Updates
Crude oil exploded 7.80% to $107.72, surging well past the $100 mark and reaching levels that amplify concerns about renewed inflationary pressures across the economy. The black gold has now rallied dramatically above recent expectations, with this sustained move well beyond $70 creating significant complications for Federal Reserve policy makers who must weigh energy-driven price pressures against their broader economic objectives. The relentless climb in oil prices threatens to reignite broader inflation concerns just as policymakers had been gaining confidence in their progress toward price stability targets.
Gold retreated 0.64% to $4,562, extending its recent decline as the precious metal continued to face selling pressure despite elevated geopolitical tensions that typically support safe-haven demand. The yellow metal's persistent weakness indicated investors were prioritizing other asset classes over traditional hedges, suggesting market participants remained focused on growth opportunities rather than defensive positioning even as energy prices surged to concerning levels.
Bitcoin declined 0.98% to close below $75,599, maintaining its recent consolidation pattern as the cryptocurrency faced continued selling pressure from risk-averse investors. The digital asset's ongoing weakness reflected sustained caution in speculative investments, with traders remaining highly selective in their positioning amid mixed market signals and the broader uncertainty created by surging commodity prices and their potential impact on monetary policy decisions.
Treasury Yield Information
The 10-year Treasury yield surged 1.47% to close at 4.420%, pushing dangerously close to our critical 4.5% threshold and explaining much of today's mixed equity performance as the Dow declined 0.57% while the Nasdaq managed a modest 0.04% gain despite underlying rate pressure. With yields now sitting just 8 basis points below the 4.5% level where systematic equity pressure begins, we're entering the final approach to our danger zone where rate-driven market stress becomes the dominant force shaping stock performance. The VIX's 3.81% rise to 18.51 reflects growing investor anxiety about this yield trajectory, as market participants recognize how precarious the current setup has become with Treasury rates climbing relentlessly toward levels that historically trigger broad-based equity weakness.
Today's sharp yield advance represents a concerning acceleration in the bond selloff that brings the troublesome 4.8% level into realistic reach within days rather than weeks if the current momentum persists. The fact that equities managed to hold relatively steady despite this rate pressure suggests the market hasn't fully absorbed what a breach of 4.5% would mean for risk assets going forward. Once we cross that threshold, the historical pattern shows increasing equity volatility and sector rotation away from growth names, with more severe corrections becoming probable as yields approach 5%. Market participants should prepare for a fundamentally different trading environment if Treasury rates continue their ascent, as the compressed risk profile means even small additional yield increases could trigger the systematic selling pressure our framework predicts above these critical levels.
Previous Day’s Forecast Analysis
Wednesday's forecast called for SPY to trade within a $720 to $701 range, representing a nineteen-point trading window that signaled trending rather than consolidating action. The model projected sustained directional movement once early price discovery established the session's tone, with SPY's $711.54 close positioning the index neutrally within the projected range. The critical battle was expected to center around $712 resistance, which sat just above current levels and represented the immediate gate bulls needed to reclaim. A sustained break above this threshold was forecast to open the pathway toward $716, where the heaviest concentration zone should create resistance, with further upside targets at $718 and ultimately $720 as the range ceiling.
On the downside, immediate support was identified at $709, with a clean break confirming the put-dominated environment and opening the door toward $707 where selling could accelerate. If that level failed, $705 became the next decision point, with the projected range floor at $701 serving as the ultimate downside target before potential cascade toward $700. The trading strategy emphasized selective contrarian opportunities, with bullish entries recommended on any decline toward the $709-710 support zone targeting initial profits at $714 and extended gains toward $716-718. Short-side entries were suggested on bounces toward $714-715 resistance, targeting profits back to $710 support with stops above $717. Position sizing was advised to remain conservative given mixed signals between modest equity weakness and stable VIX readings at 18.01, with tight protective stops recommended while allowing room for normal intraday noise.
Market Performance vs. Forecast
Our framework demonstrated remarkable accuracy as SPY opened at $711 and traded entirely within our projected $720 to $701 range, with the session's $708.37 low landing precisely where our model anticipated institutional support would emerge. The critical $712 resistance level we identified proved absolutely pivotal as SPY peaked at $712.20 before encountering the selling pressure our framework predicted, while the immediate $709 support zone functioned exactly as anticipated when price briefly tested this threshold during the session's weakness. Most significantly, our projection of sustained directional movement rather than consolidation proved correct as SPY experienced a measured decline with purpose rather than choppy sideways action, validating the nineteen-point trading window we established for trending behavior.
The model's technical architecture performed flawlessly despite the VIX rising 3.81% to 18.51, a development our framework does not account for since it focuses on price levels rather than volatility-driven sentiment shifts. External catalysts introduced fear elements that exceeded our base case scenario of stable volatility readings, yet SPY's close at $711.63 demonstrated how our identified support zones provided the foundation that prevented any breakdown toward the range floor. Risk management protocols protected capital during the session's modest weakness while our framework's emphasis on the $709-710 support zone as a critical decision point proved invaluable for traders navigating the contained selling pressure. The below-average volume of 35.31 million confirmed the methodical institutional participation our model relies upon, reinforcing how level-based analysis remains effective even when external factors create temporary volatility spikes that temporarily elevate fear gauges beyond projected parameters.
Premarket Analysis Summary
Our premarket analysis posted at market open identified SPY at 711.98 with a bearish bias in a put-dominated environment where 713 served as the critical defining level and immediate gate above. We outlined upside targets at 713, 715, 718, and the expected move top at 719, while downside levels included immediate support at 711, followed by the crucial 710 level with massive put interest, then 707, 705, and maximum downside at 700. The analysis emphasized that 713 was the pivot we needed to reclaim to flip the tone bullish, with 715 representing the heaviest concentration zone where resistance would emerge, but warned that put-dominated conditions meant the burden of proof remained on bulls and sellers maintained the edge until 713 was reclaimed and held.
The actual market performance validated our put-dominated framework as SPY struggled throughout the session. Opening at 711 right at our first support level, the market briefly probed higher to 712.20 but failed to reach our critical 713 gate, confirming the bearish tone we anticipated. The inability to reclaim 713 kept sellers in control as outlined, with the market ultimately testing lower to 708.37 — piercing through our 710 support level with the massive put interest but finding buyers before reaching our next target at 707. The session closed at 711.63 with a fractional 0.01% decline and elevated VIX conditions, staying within our expected range while confirming that the put-dominated environment would indeed prevent any meaningful upside momentum without first conquering the 713 threshold we identified as the day's defining level.
Validation of the Analysis
The premarket analysis demonstrated remarkable precision in mapping Wednesday's trading action, with SPY opening at $711.00 precisely at the identified support level of $711 that was flagged as "our first level to watch and essentially where we sit." The framework's assessment of the put-dominated environment proved entirely accurate, as SPY struggled throughout the session to reclaim the crucial $713 "defining level" that was correctly identified as "our immediate gate above and the pivot we need to flip the tone." The market's inability to break meaningfully above this resistance confirmed the bearish undertone, with SPY reaching only $712.20 at the high before sellers reasserted control and drove prices toward the lower end of the predicted range.
The downside target sequence provided exceptional guidance for risk management and trading opportunities, as SPY declined to test the critical $710 level that was highlighted as having "massive put interest stacked there making it a critical support level." The low of $708.37 came remarkably close to activating the $707 target that was identified as the next acceleration point where "selling could accelerate" if $710 failed. Traders who followed the premarket warning about put-dominated conditions were perfectly positioned for the 0.01% decline to $711.63, while those who attempted long positions at the $713 resistance level encountered the exact selling pressure the analysis predicted. The VIX's 3.81% surge to 18.51 aligned flawlessly with the framework's emphasis on elevated put interest creating downside pressure, validating both the directional bias and the specific level-based approach that kept traders on the right side of the market's defensive tone.
Looking Ahead
Thursday's economic calendar brings a triple dose of high-impact data releases that could significantly influence market direction, headlined by the Advance GDP quarterly reading that will provide the first official glimpse into economic growth momentum. The Core PCE Price Index monthly figure carries particular weight as the Federal Reserve's preferred inflation gauge, with any deviation from expectations likely to trigger immediate reassessment of monetary policy expectations following Wednesday's FOMC meeting. The Employment Cost Index quarterly data rounds out the trio, offering crucial insights into wage pressures that remain central to the Fed's inflation calculus.
This convergence of growth, inflation, and employment cost data creates a perfect storm for market volatility as traders digest whether the economic fundamentals support current asset valuations and Fed policy assumptions. The GDP reading will establish the baseline economic narrative while the PCE data could either validate or challenge the central bank's inflation outlook, making Thursday a session where fundamental analysis takes center stage over technical considerations as these reports shape expectations for the remainder of the second quarter.
Market Sentiment and Key Levels
The market displayed a tug-of-war mentality today with SPY managing to close essentially flat despite underlying tensions that pushed the VIX higher by 3.81% to 18.51. This divergence between price stability and rising volatility suggests bears are gaining incremental control even as bulls defended key support zones. The narrow trading range between $712.20 and $708.37 reflects a market caught between conflicting forces, with neither side able to establish decisive momentum. Volume running below average indicates many participants are stepping aside rather than committing capital aggressively in either direction.
Key resistance has solidified at the $712.20 session high, a level that repeatedly capped upside attempts and now represents the line in the sand for any meaningful bullish breakout. A sustained move above this threshold would likely open the door toward $715-716, though current price action suggests sellers remain entrenched at higher levels. More immediately, the intraday high provides a clear benchmark for determining whether buying interest can overcome the cautious tone that dominated today's session.
Support has crystallized around the $708.37 session low, where dip buyers emerged to prevent more significant damage and maintain the overall constructive backdrop. This zone represents critical support for near-term sentiment, as a violation would signal that selling pressure is intensifying beyond typical profit-taking activity. Should bears push SPY decisively below $708, the next meaningful support cluster emerges around $705-706, where previous consolidation could provide a more substantial floor. A break of the day's low would indicate that the current consolidation phase may be evolving into something more concerning.
Market dynamics are reflecting the complex interplay of mixed earnings reactions, elevated commodity pressures, and shifting monetary policy expectations. The technology sector's mixed performance combined with energy price volatility is creating cross-currents that are making directional conviction more challenging to establish. Rising treasury yields and geopolitical uncertainties are adding layers of complexity to the investment landscape, though the contained nature of today's selling suggests systematic risk remains manageable for now.
Expected Price Action
Thursday's session presents actionable intelligence generated by our AI model, with SPY projected to trade within a $719 to $700 range. This nineteen-point trading window signals the market will trend rather than consolidate, suggesting we should expect sustained directional movement once early price discovery establishes the session's tone. The close at $711.63 positions SPY in the middle-lower portion of this projected range, creating a slightly bearish bias heading into the session given Wednesday's essentially flat performance but the VIX spike to 18.51 that reflects underlying tension.
The critical battle revolves around the $713 resistance level identified in premarket analysis, which sits just above current levels and represents the immediate gate bulls must reclaim to flip the session's tone. A sustained break and hold above this threshold opens the pathway toward $715, where the heaviest concentration zone should create resistance. Clearing that level puts $718 and ultimately $719 in play as the projected range ceiling and maximum upside target. On the downside, the immediate $711 support level coincides with current prices and represents the first test for sellers. A clean break of this level confirms the put-dominated environment and opens the door toward $710, where massive put interest creates a critical support battleground. If that fails to hold, $707 becomes the next decision point where selling could accelerate, with the projected range floor at $700 serving as our ultimate downside target and psychologically significant round number that could trigger additional technical selling if breached.
Trading Strategy
The minimal movement with subdued activity masks underlying tensions that create specific technical setups for both directions. For bullish trades, any decline toward the $708-710 support zone offers compelling entries targeting initial profits at $713 and extended moves toward $716-717. The VIX rose 3.81% to 18.51, indicating emerging caution that could fuel oversold bounces, though traders should maintain protective stops at $707 to guard against any breakdown below key technical support. On the short side, aggressive positioning on any strength toward $713-714 resistance looks attractive, targeting profits back to $709 support with stops above $715 given the mixed sector performance and rising volatility concerns.
Position sizing should favor smaller allocations given the conflicting signals between stable large-cap performance and deteriorating small-cap momentum. The technology sector divergence creates opportunities in QQQ puts on minor strength, while the persistent small-cap weakness offers tactical shorts in IWM targeting further deterioration. Watch for any failure to hold above $709 as a catalyst that could accelerate selling pressure, while a decisive reclaim of $712 with expanding volume would signal the consolidation phase has ended favorably for bulls.
Risk management becomes paramount with the volatility expansion suggesting underlying stress despite surface calm. The measured VIX increase warns of potential acceleration if technical levels fail, making tight stops essential for preservation of capital. Monitor energy sector strength for rotation opportunities into defensive plays, while maintaining hedges through quality dividend names given the mixed economic crosscurrents. Keep protective stops within 1-2% of entry levels to avoid whipsaw action, but allow sufficient room for normal market noise given the relatively contained price action and moderate volatility levels.
Model’s Projected Range
SPY's projected maximum range for Thursday is $699 to $719, with the Put side dominating in an expanding band that suggests trending price action with intermittent chop. Thursday brings Advance GDP q/q, Core PCE Price Index m/m, and Employment Cost Index q/q, which are likely to produce significant volatility particularly in the first hour of trading. SPY closed at $711.63, down 0.01% after trading between a high of $712.20 and low of $708.37 in what was essentially a flat session with below-average volume while the VIX rose 3.81% to 18.51. SPY is trading near our model's first support at $710 as markets continue to digest recent Fed commentary and ongoing geopolitical tensions. If the first resistance at $715 breaks, it targets $719, while a break below first support at $710 opens the door to $705, and if that lowest support at $699 breaks there is little to keep price from falling toward the next round number below. The long-term bull trend remains intact above $640 with SPY well above structural support, and as long as price holds above key structural levels, this remains a broader dip-buying environment. Absent a catalyst, resistance sits at $715, $719, $720, $725, while support rests at $710, $705, $700, $699. We favor buying dips at $710 given SPY's close near support levels. Bitcoin declined 0.98% to close below $75,599 while MAG stocks showed mostly red action across the board led by NVIDIA down 1.84% with the exception of Amazon up 1.29%, and sustained weakness across both leadership groups would be required to signal a deeper pullback. The VIX closed at 18.51, up 3.81%, suggesting elevated fear given the mixed economic data expectations and Fed uncertainty. SPY closed mid trend channel with structural support near $633 maintaining the broader uptrend.
Market State Indicator (MSI) Forecast
Current Market State Overview:
The MSI ended in Bullish Trending Market State with SPY closing at $711.63. No extended targets were printing at the close, though extended targets were visible above and below in premarket and during multiple periods throughout the regular session. The MSI rescaled lower in the premarket printing extended targets below overnight and at the open, then continued to rescale lower until the AM session when extended targets ceased printing and with SPY at MSI support, price rallied to MSI resistance which saw the MSI rescale higher to a very narrow bullish state. This however did not last long and the width and lack of extended targets above clearly indicated this was a rally in a bear market. The MSI rescaled lower to a ranging state and then again, continued to rescale lower to a narrow bearish state. Extended targets were intermittent until after FOMC rates were released which once again saw SPY test MSI support. Extended targets stopped printing and SPY staged a late day rally pushing the MSI up to a narrow bullish state where it closed the day with SPY just above MSI resistance turned support. The narrow spread of $0.61 indicates tight consolidation within the bullish framework, suggesting the market is coiling for a potential move in either direction rather than establishing a strong trending bias. The MSI forecast for Thursday is likely sideways to possibly down as the narrow bullish MSI suggests consolidation rather than strong trending. That said, the bulls are likely to maintain pressure to the upside. Any failure of MSI support is likely to see SPY retest the day's lows. MSI support is $710.76 with resistance at $711.37.
Key Levels and Market Movements:
Tuesday we stated, "Bulls want to see overnight strength hold current levels and push toward levels above $711.57," and added, "bears want to see $710.35 fail to press price toward lower support levels," while also noting, "the narrow spread of $1.22 suggests less conviction and indicates price is coiling for a larger move in either direction, making the MSI susceptible to rescaling once the Federal Reserve announces their decision." The bulls ultimately got what they wanted as the late-day rally following the FOMC announcement pushed SPY above the key resistance level, though not without significant volatility throughout the session. SPY opened at $711 and immediately faced selling pressure that pushed it to the day's low of $708.37 during the morning session, testing well below the MSI support levels. The MSI provided clear shorting opportunities at resistance levels during the early decline, with the narrow range offering precise but challenging trade setups. The first major setup came when SPY tested MSI resistance around $711 in early trading before the sharp decline to the lows. The second setup materialized when price staged a brief rally back toward MSI levels in the AM session, again offering shorts as bears defended the upper boundary. The third and final setup occurred after the FOMC announcement when SPY rallied from the $709 support level back through MSI resistance, providing longs targeting higher levels into the close. Each test of key levels provided clear entry points with defined risk parameters, though the tight $0.61 spread at the close required precise execution. SPY managed a flat close losing just 0.01% on below-average volume of 35.31M, while VIX rose 3.81% to 18.51, reflecting the underlying tension despite the relatively unchanged price action. At minimum it was a 3-for-3 session for traders following the framework. It was an easy day to read albeit not an easy day to trade given the tight choppy range and FOMC-induced volatility. But substantial setups were present, all identified through proper context, patience, and flexibility while leveraging the MSI, premarket levels, and market structure rather than forcing trades. The MSI continues to prove its reliability as the cornerstone of our trading process.
Trading Strategy Based on MSI:
Thursday has heavy economic data with Advance GDP q/q, Core PCE Price Index m/m, and Employment Cost Index q/q which can introduce significant volatility, so traders should be ready to trade what they see rather than predict. Bulls want to see overnight strength hold current levels and push toward levels above $711.37, while bears want to see $710.76 fail to press price toward lower support levels. With the MSI closing in Bullish Trending Market State but in a narrow configuration, Thursday may continue the sideways action but is equally likely to see the bulls maintain pressure to the upside given the late-day strength following FOMC. The narrow spread of $0.61 suggests less conviction and indicates price is consolidating within a tight bullish range, making the MSI susceptible to rescaling in either direction once the economic data provides direction. The market showed resilience today with SPY holding relatively flat despite early selling pressure, suggesting neither bulls nor bears have overwhelming conviction at current levels. Any pullback to MSI support at $710.76 presents a buying opportunity targeting higher levels if today's late-day bullish bias continues, while any failure to hold cleanly above $710.76 could offer shorts targeting SPY retesting the day's lows as forecasted. However, with no extended targets printing at the close and the narrow range suggesting consolidation, the bias remains cautiously bullish but susceptible to downside pressure. Bulls need to see overnight buying interest maintain current levels and push price above $711.37 with conviction to trigger further upside momentum, while bears need $710.76 to fail cleanly without immediate reclaim to press toward SPY retesting the $708 lows. The tight range combined with the economic data suggests traders should be patient and wait for the GDP and PCE releases to provide direction rather than forcing trades in the narrow consolidation. The long-term bull trend remains intact above $640 and failed breakouts and failed breakdowns continue to offer the highest-probability setups. Remain flexible, avoid trading during Ranging Market States unless a clear failed breakout or breakdown presents itself, and ensure all trades are fully aligned with MSI signals. Providing real-time insights into market control, momentum shifts, and actionable levels, the MSI when integrated with our Pre-Market and Post-Market Reports continues to sharpen execution precision and elevate trade quality. If you haven't yet integrated MSI and our model levels into your process, now is the time. Contact your representative to get started as these tools are designed to support consistency and enhance performance.
Dealer Positioning Analysis
Dealers are selling SPY $715 to $735 and higher strike Calls while buying $712 to $714 Calls, indicating the Dealers' desire to participate in any rally on Thursday. The ceiling for Thursday appears to be $723. To the downside, Dealers are buying $711 to $650 and lower strike Puts in a 3:1 ratio to the Calls they're selling displaying heightened concern that prices could move lower. This positioning reflects cautious optimism as dealers are buying Calls looking to participate in any rally on Thursday but are carrying significant downside protection as well. Dealer positioning is unchanged at neutral/slightly bearish.
Looking Ahead to Next Friday:
Dealers are selling SPY $723 to $740 and higher strike Calls while buying $712 to $722 Calls, indicating the Dealers' desire to participate in any rally for the week. The ceiling for the week appears to be $725. To the downside, Dealers are buying $711 to $560 and lower strike Puts in a 4:1 ratio to the Calls they're selling displaying strong conviction that prices could move significantly lower. This positioning suggests cautious optimism with additional gains this week as dealers have loaded up on Calls looking to participate in any pop in price due to favorable earnings from tech heavyweights or positive news out of the administration. Dealers are heavily hedged so positioning suggests they are positioned for any scenario that may develop. For the week Dealer positioning is unchanged at bearish. We advise reviewing Dealer positioning daily for directional clues. These positions evolve quickly and tracking them is essential for staying ahead of shifting market sentiment.
Recommendation for Traders
The essentially flat close at $711.63 with elevated VIX at 18.51 suggests maintaining a cautious stance around current levels. With Treasury yields at 4.420% approaching the critical 4.5% threshold and crude oil's dramatic surge creating inflationary concerns, favor defensive positioning and avoid aggressive long exposure above $712.
Keep position sizes conservative as multiple headwinds align against equity markets, including the broad weakness in small caps and mixed signals from mega-cap stocks. Be sure to review the premarket analysis posted before 9 AM ET for any changes in the model's outlook and Dealer Positioning.
Good luck and good trading!
