Market Insights: Tuesday, April 29th, 2025
Market Overview
Markets pushed higher Tuesday, with stocks extending their winning streak as investors welcomed fresh tariff relief for automakers and sifted through a heavy slate of corporate earnings. The Dow led the way, jumping 0.8%, its longest rally of the year, while the S&P 500 climbed 0.6% and the Nasdaq added 0.55%. A key driver behind the rally was President Trump’s executive order aimed at protecting automakers from additional tariffs on top of those already in place. This move provided a sigh of relief for markets, which have been jittery over the economic impact of the administration’s ongoing trade policies. Treasury Secretary Scott Bessent added fuel to the fire by reiterating that China, not the U.S., is under more pressure to ease the standoff. Meanwhile, Amazon briefly stumbled on reports it would list tariff-driven price increases on product tags, which the White House called “hostile,” though the company denied the claim and recovered by session close. On the earnings front, General Motors postponed its call to digest the White House’s tariff stance despite beating expectations, while Starbucks fell after hours following a Q2 earnings miss. Consumer confidence continued to slip, now down five straight months, with the Conference Board’s index falling to 86. Job openings also cooled, signaling potential cracks in the labor market. Despite mixed signals, markets held firm as relief on tariffs and optimism around Q1 earnings outweighed macroeconomic caution.
SPY Performance
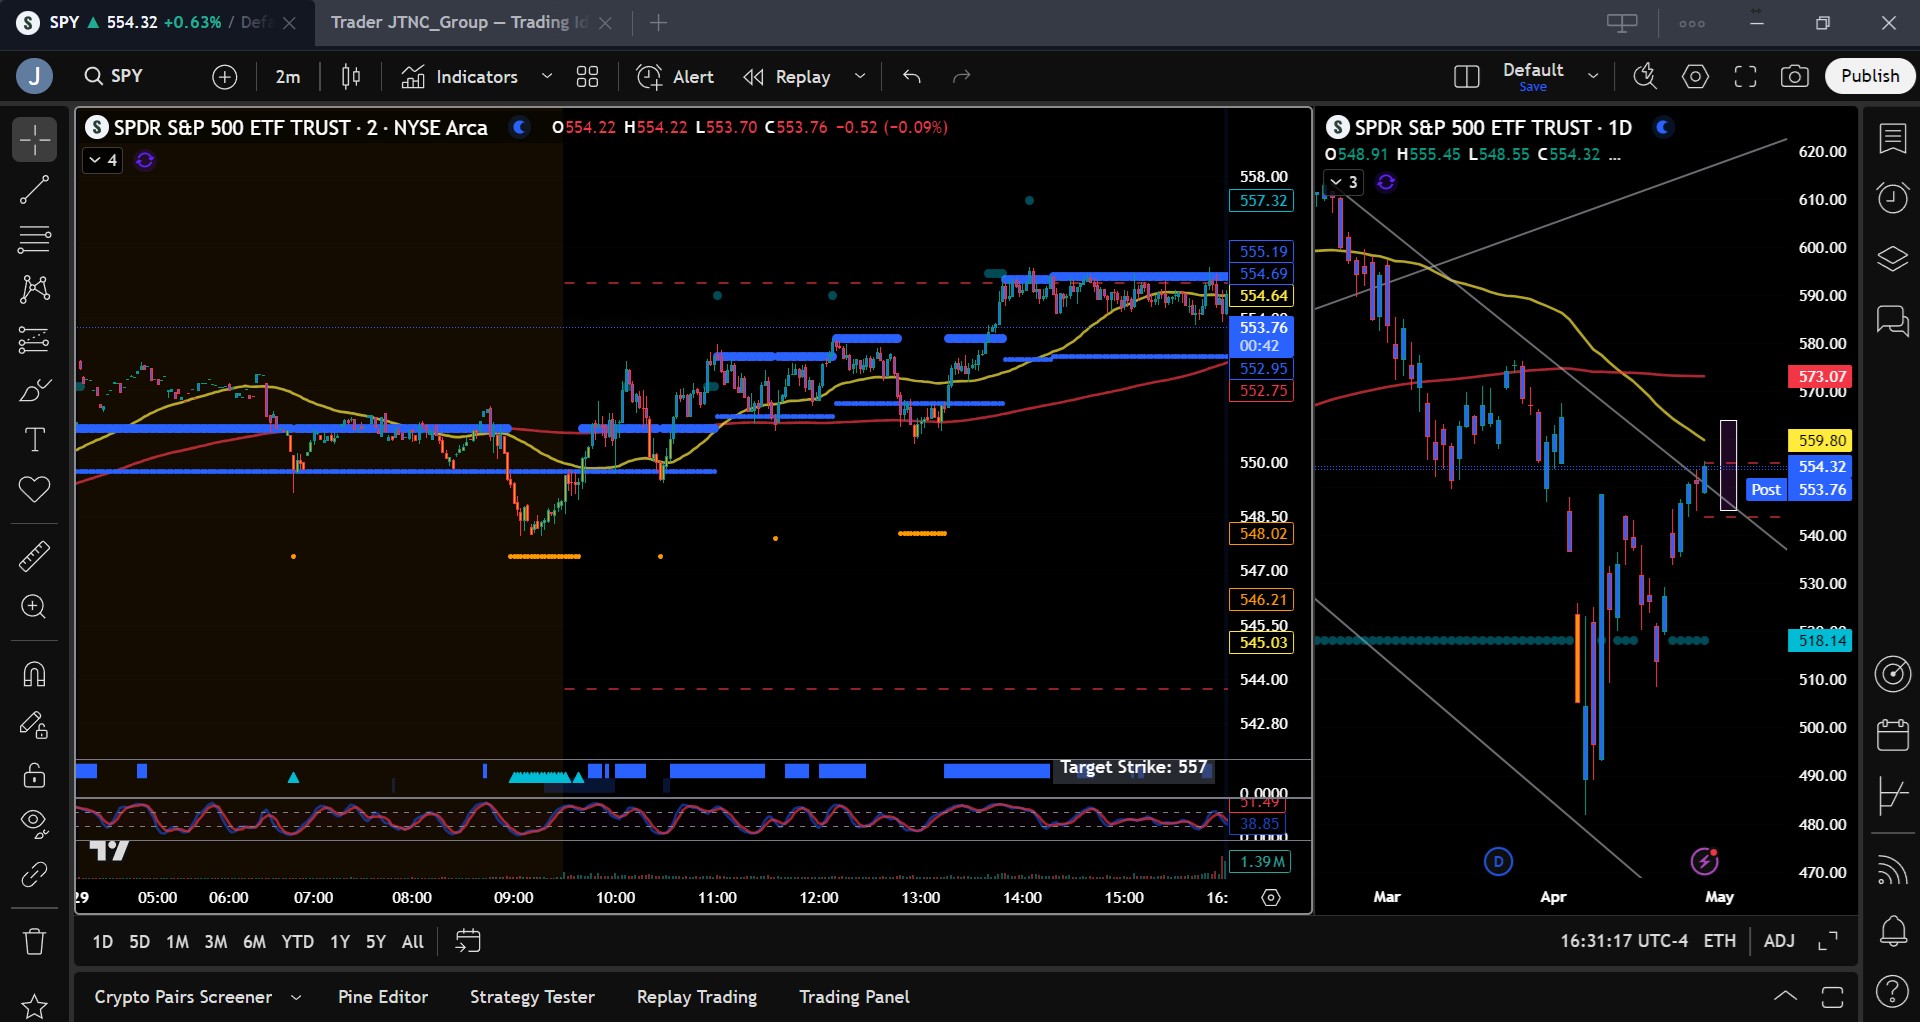
SPY finished the session up 0.60%, closing at $554.15 after opening at $551.31. The ETF reached a high of $555.44 and dipped as low as $548.55 before rebounding into the close. Volume came in below average at 43.48 million shares, signaling some investor hesitation despite the recent strength. The close above the $550 mark for a second straight day suggests bulls are maintaining control, and SPY remains in the upper range of the recent consolidation channel.
Major Indices Performance
The Dow led major indices with a gain of 0.75%, logging its sixth consecutive daily increase and notching its strongest streak of 2025. The S&P 500 followed closely with a 0.60% advance, while the Nasdaq trailed slightly, adding 0.55% as tech stocks recovered from early weakness. The Russell 2000 rose 0.54%, showing continued strength in small caps as investors rotate outside of large-cap tech. Gains were largely supported by easing trade tension headlines and optimism surrounding ongoing earnings. Defensive sectors like healthcare and utilities were relatively muted, as investors focused more on cyclicals tied to economic activity and global trade.
Notable Stock Movements
The Magnificent Seven stocks had another mostly green day. Tesla stood out with a gain of over 2%, helping to lift sentiment in the group. Apple, Meta, Microsoft, and Nvidia all posted modest gains, reflecting cautious optimism ahead of earnings. Alphabet and Amazon were the only two to close slightly in the red, with Amazon's weakness tied to its brief tariff-related headlines. The divergence shows investors are still navigating company-specific risks while positioning for earnings momentum and macro developments.
Commodity and Cryptocurrency Updates
Crude oil sank nearly 3% to $60.24, aligning with our model's long-standing forecast for a drop toward the $60 mark. We remain bearish long term, with $50 now in view, though near-term volatility could prompt rebounds if the dollar weakens. Gold eased 0.49% to settle at $3,331 as investor demand for safe havens waned slightly amid improving risk sentiment. Bitcoin edged higher by 0.52%, closing just above $94,900. Our strategy remains focused on long entries between $77,000 and $83,000, with profit-taking north of $85,000. Any move below $77,000 remains a high-risk area for buyers.
Treasury Yield Information
The 10-year Treasury yield dipped 1.00% to close at 4.174%, offering some relief to equity markets. Despite the drop, yields remain elevated enough to keep pressure on valuations if they reverse higher. The market remains vulnerable to sharp corrections if the 10-year approaches 4.5%, with a move beyond 5% likely triggering a steep equity selloff exceeding 20%.
Previous Day’s Forecast Analysis
Monday’s forecast called for a bullish bias with SPY projected to trade within a $543 to $555 range, favoring long trades above $545. Key resistance was noted at $555 and $560, while support levels were anchored at $545 and $540. The model advised buying dips and targeting failed breakouts around $555 for profit-taking. Traders were warned of choppy conditions with consolidation likely between key levels, especially with earnings and data releases looming. The strategy was clear: long above $545 targeting $553 and $555, with a potential stretch to $560 if momentum held.
Market Performance vs. Forecast
Tuesday’s session closely matched the forecast. SPY opened at $551.31, tested the lower end of support at $548.55, and rallied to a high of $555.44—nearly hitting the upper bound of the projected range. The close at $554.15 confirmed the bullish outlook and validated the model’s resistance zone near $555. Long trades initiated near $548–$550 had ample opportunity for gains as SPY pressed toward resistance. Support at $545 held strong, and upside targets were effectively reached. The day’s price action provided traders with clean setups and demonstrated the value of adhering to the model’s key levels.
Premarket Analysis Summary
In today’s premarket analysis posted at 7:45 AM, SPY was trading at $550.96 with a bias level set at $550. The forecast anticipated a fragile upward drift with long setups favored above $550. Targets to the upside were identified at $552.25 and $555, with a potential stretch to $560. If SPY failed to hold above $550, the outlook shifted toward a decline to $543.75 or even $540, though downside conviction was expected to remain soft. The model emphasized cautious trading within the range and fading moves near the extremes, suggesting a lack of strong participation to push the market aggressively in either direction.
Validation of the Analysis
Tuesday’s session followed the premarket roadmap with high precision. SPY respected the $550 bias level, dipping only slightly below before reversing higher. The ETF reached $555.44—just shy of the stretch target—and closed at $554.15. The consolidation gave way to modest upside action exactly as projected, and traders favoring long entries near support saw clean setups and follow-through. Resistance near $555 slowed the advance, reinforcing the analysis that stronger buying would be needed to reach $560. The premarket insights once again delivered accurate, actionable guidance, helping traders align with market momentum.
Looking Ahead
Wednesday brings a trio of high-impact economic reports that could spark significant market movement: ADP Non-Farm Employment, GDP, and the Fed’s preferred inflation metric—the PCE index. With yields, inflation, and tariffs already steering market sentiment, these reports may reinforce or reverse the current bullish trend. Traders should expect an uptick in volatility as the market digests fresh economic signals and re-evaluates the Fed’s next steps.
Market Sentiment and Key Levels
SPY’s close at $554.15 reflects continued bullish control, but key resistance is looming. The bulls will need to break through $555 to unlock the next leg higher toward $560 and $565. Support levels remain firm at $550, $548, and $545. The market sentiment leans bullish, bolstered by policy relief and earnings, but any break below $545 could quickly tilt momentum toward the bears. With critical economic data on deck, traders should prepare for sharp reactions around these levels, and the bulls must defend $545 to maintain the upper hand.
Expected Price Action
Our AI model projects a trading range of $545.25 to $564.00 for Wednesday—this is actionable intelligence. The range is wide, implying a volatile session with the potential for trending price action. The bullish bias remains intact with a focus on $558 and $560 as upside targets. If SPY clears $560, expect momentum to test $565. However, failure to hold $550 or $545 may lead to a decline toward $535, which would threaten the rally’s structure. Watch for failed breakouts at resistance and failed breakdowns at support to signal reversals. With major data due, traders should anticipate increased volatility and adjust sizing accordingly.
Trading Strategy
Long trades are favored above $550, targeting $555, $558, and potentially $560. A breakout above $560 opens a path toward $565, though strong resistance is expected. Short trades become viable below $548, with downside targets at $545, $540, and $535. In a falling market, $535 is a key line in the sand—failure there could trigger a sharp drop toward $530 or lower. The VIX closed at 24.18, reflecting elevated volatility but with room to ease. In this environment, use tight stops on long trades near resistance and stay nimble. Reduce position size and avoid overexposure ahead of major data events.
Model’s Projected Range
The model’s maximum projected range for Wednesday is $545.25 to $564.00, with the Call side showing dominance—suggesting continued strength behind the recent six-day relief rally. The range has expanded modestly and remains broad, indicating the potential for increased volatility. Expect further consolidation around the $545 to $555 level, interspersed with periods of directional movement. As long as this range holds, the market is positioned to push higher, with $560 and $565 as the next upside targets for the bulls. However, a break below $545 could signal the start of a corrective leg lower, with $535 as the next key support. A failure there would likely trigger a more substantial decline. We maintain a preference for two-way trading, while remaining cautious viewing this as a relief rally within the broader context of an ongoing bear market. The market remains vulnerable to another leg down, particularly if prices approach the $565–$585 resistance zone, where a retest or even a breach of recent lows becomes more probable. Historically, declines of this nature tend to unfold 4 to 16 weeks after an initial bottom. As such, we strongly recommend considering protective strategies or trimming long exposure as these resistance levels are tested. Earnings this week have been strong, likely pulling forward growth that had been expected in the second and third quarters. However, companies continue to cite tariff-related risks and elevated volatility stemming from current administration policies. We anticipate the real impact of tariffs will begin to materialize in Q2 and Q3 results. For Tuesday, key technical levels include resistance at $558, $560, and $565, with support at $550, $548, and $545. A strong resistance band remains between $555 and $565, which may slow further upside on Wednesday. Wednesday also brings a heavy economic data slate, including ADP Employment, GDP, and PCE figures. After six strong sessions lifting SPY from $535 to a high of $555.43, some consolidation or choppiness is likely. A decisive close above $585 would give bulls firmer control of the market. Conversely, a break below $545 may lead to a retest of $535, and failure there could trigger a gap-fill move toward $530. Tariffs, bond yields, and inflation remain the dominant macro forces expected to shape market behavior over the next 90 days—or until more definitive policy signals emerge from the White House. The VIX closed at 24.18, nearing the 23 level, which should provide additional support for equities. With SPY settling just above $554, bulls continue to build their foothold as price moves above the upper boundary of the bear trend channel formed since the December highs. This boundary was breached today, and if prices remain outside of it, the trend channel will be redrawn in the coming days. Momentum currently favors the bulls, but in a volatile environment like this, we recommend staying nimble and prepared for rapid sentiment shifts.
Market State Indicator (MSI) Forecast
Current Market State Overview:
The MSI is currently in a Bullish Trending Market State, with price closing just below MSI resistance. Extended targets above printed sporadically during the afternoon session. The range is average, which implies a weakening bull trend but one which may still have some legs left in it on Wednesday. Overnight the MSI contained price in a narrow range and just before the open, the MSI rescaled to a ranging state before flipping back to a bullish state. The MSI then rescaled four more times during the day session, all higher as price pushed to major resistance at $555. Currently, MSI support stands at $552.92 with resistance at $555.20.
Key Levels and Market Movements:
On Monday, we noted: “We expect the market to consolidate with periods of trending price action between $545 and $555.” We also stated: “Any breakout beyond today’s highs is expected to be measured and deliberate.” And finally: “Bulls may look to retest some of today’s gains, potentially pulling back to $542, while also attempting to reclaim today’s highs and break out toward $555.” With this actionable intelligence in mind, we approached the open prepared. SPY tested $548 in the premarket and held. When the MSI rescaled from a Ranging State to a Bullish Trending Market State, we entered long at $550, confident in the over 70% probability of SPY reaching MSI resistance at $551. While this met our minimum $1 risk-reward threshold, we opted to hold for the first premarket level of $552.25, aiming to capture a few extra dollars on 70% of our position. That target was hit by 10:10 AM. With strength intact, we set a second target at $555. However, SPY reversed back to our entry at $550. Since we were trading with the trend, we maintained our usual strategy, keeping the stop back and moving to breakeven only after a second target was hit. We reloaded the long to full size at $550, anticipating another push to $552.25, which aligned with expectations from the post-market report indicating resistance around this zone. This setup delivered again, as SPY rallied to $552.25. We took off another 70% of the position. The MSI briefly printed an extended target, then pulled back to newly rescaled MSI support at $552.25. We considered reloading long a third time, but with the MSI range holding near average and extended targets fading quickly, we instead chose to hold the remaining runners to see if $555 could be achieved. We waited patiently through the afternoon. Just before 2 PM, SPY cooperated—pushing to $555 as the MSI rescaled higher and printed new extended targets. We took another 20% off, holding the final 10% to see if $555 would break. It didn’t, and as the day session neared its close, we exited the remainder at $555, wrapping up another two-for-two day of solid, disciplined execution and meaningful profit. Today once again reinforced our core mantra: have a solid plan, execute with discipline, and let the MSI and model levels guide every decision. The MSI reveals who’s in control, when control shifts, and where key actionable levels lie—enabling precise entries and exits. When paired with our model levels and strategy, it keeps us aligned with dominant market forces. It continues to deliver with high precision, helping traders avoid traps, stay in sync with momentum, and capture profits confidently. We strongly recommend integrating the MSI into your trading toolkit. When combined with a structured plan, it becomes a powerful engine for long-term performance.
Trading Strategy Based on MSI:
Wednesday brings a notable slate of economic data that could move the market. After six consecutive green sessions, probabilities favor at least a day or two of consolidation, with a pullback to $550 as a likely minimum. If $550 holds, bulls should remain motivated to push prices higher. The next target is $560—though it will be a significant challenge, as it is close to the 200-day moving average. However, if $550 fails on a pullback, the six-day streak will end, potentially sending price back to $545 or lower. That said, as long as bulls maintain price above $535, they retain the advantage. Of course, with this administration, surprises can emerge quickly—so be prepared to react to new information in real time. Absent any unexpected shocks, we expect the market to consolidate with intermittent trending moves between $545 and $555. This should offer solid two-way trading opportunities. Bulls are also likely to retest today’s highs, but we believe a first attempt at a breakout above $555 will fail. The market likely needs to knock at this level multiple times before breaking through toward $560. As with Tuesday, a failure to hold $545 could open the door for a test of $535—a key line in the sand for bulls. A breakdown below $535 would be significant and could lead to a gap fill toward $525 or lower. Resistance remains strong from $555 to $565, so any breakout above today’s highs is expected to be gradual and deliberate. The edge still belongs to the bulls—but that advantage can shift quickly if $535 is lost. Bulls won’t fully reclaim control unless SPY regains $585, so caution is still warranted. For Wednesday, expect a two-way trading environment, with a focus on failed breakouts and failed breakdowns—especially near $545 and $555. Avoid trading into extended targets or fighting a wide MSI range. As always, trade what’s in front of you: lean on the MSI and stay nimble. The Premarket Report delivers fresh data and AI-powered insights to shape your daily game plan, while the MSI updates in real time to reveal intraday structure and momentum shifts, helping you avoid stale narratives or lagging assumptions. Our model levels highlight high-probability targets and precise entry zones. Together, the MSI and model levels keep you aligned with dominant market forces and help you avoid costly missteps. If you’re not already leveraging these tools, now’s the time. Reach out to your rep—they’re true game-changers in a market like this.
Dealer Positioning Analysis
Summary of Current Dealer Positioning:
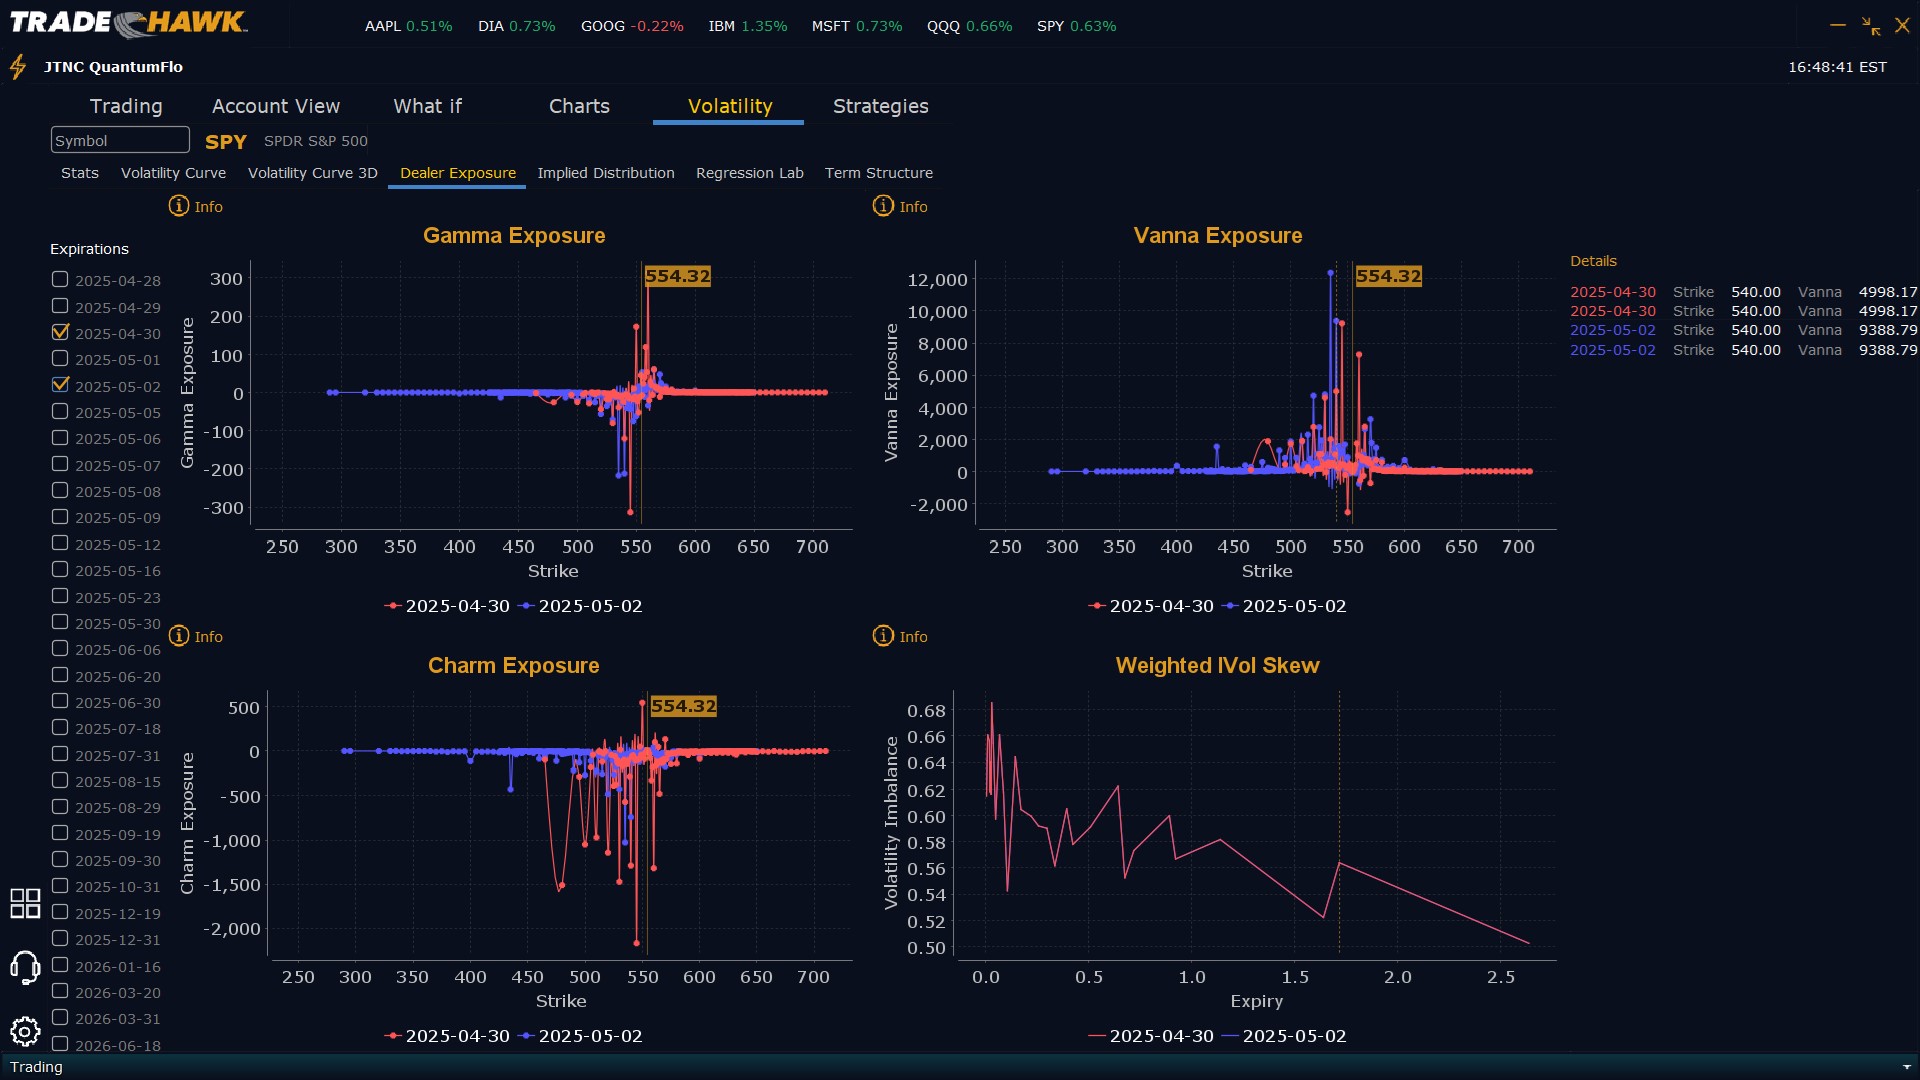
Dealers are selling $555 to $580 and higher strike Calls while selling $550 to $554 Puts implying the Dealers belief that prices may pull back slightly but not likely much beyond $550. The upside, however, also looks limited to $560 for Wednesday. Dealers nailed today’s projected high at $555 with their positioning. To the downside Dealers are buying $549 to $500 and lower strike Puts in a 2:1 ratio to the Calls/Puts they are selling, implying a neutral to slightly bullish posture for Wednesday. Dealer positioning has changed from slightly bearish to neutral/slightly bullish.
Looking Ahead to Friday:
Dealers are selling $561 to $600 and higher strike Calls while also buying $555 to $560 Calls implying Dealers desire to participate in any continuation of the current rally. Dealers seem to believe the market peak for this week is $570. To the downside, Dealers are buying $554 to $490 and lower strike Puts in a 3:1 ratio to the Calls they’re buying/selling. This reflects a slightly bearish outlook for the week. Dealers are heavily protected should $540 fail but are also open to prices reaching $570 this week. Dealer positioning is unchanged from slightly bearish to slightly bearish. We advise reviewing Dealer positioning daily for directional clues. These positions evolve quickly and tracking them is essential for staying ahead of shifting market sentiment.
Recommendation for Traders
With SPY closing at $554.15 and the VIX at 24.18, traders should stay agile in the face of persistent volatility. Long trades remain favorable above $545 with targets at $555 and $560. A breakout above $560 may lead to a run at $565. Short setups become attractive below $548, aiming for $545 and above $555. Use tight stops near resistance and protect profits as the market reacts to Wednesday’s economic data. As always, review the premarket analysis before 9:00 AM ET to adjust for any overnight developments in sentiment or Dealer positioning.
Good luck and good trading!
