Market Insights: Tuesday, April 28th, 2026
Market Overview
US stocks retreated from record highs on Tuesday as concerns about artificial intelligence spending weighed heavily on technology shares. The Nasdaq dropped 0.9% while the S&P 500 pulled back 0.5%, with the Dow sliding just below the flatline after starting the session higher. The tech selloff was triggered by a Wall Street Journal report revealing that OpenAI had fallen short of its own sales and user targets ahead of its anticipated IPO, sparking renewed worries about excessive AI spending across the sector. Oracle and CoreWeave led the decline among OpenAI partners, falling 4% and 5% respectively, though both companies issued statements defending their partnerships with the AI developer.
The market pullback comes at a critical juncture as investors await quarterly results from the Magnificent Seven tech giants this week, with Alphabet, Amazon, Meta, and Microsoft reporting Wednesday followed by Apple on Thursday. Meanwhile, oil markets are grappling with significant developments as the United Arab Emirates announced its departure from OPEC, dealing a major blow to the cartel during an already precarious time for Persian Gulf producers. Brent crude held near $104 per barrel while WTI crude hovered around $100 as the US-Iran standoff continues to keep Strait of Hormuz traffic at a standstill. The Federal Reserve begins its two-day policy meeting Tuesday, with officials expected to hold rates steady when they announce their decision Wednesday, as investors listen closely to Jerome Powell's comments as his term nears its end.
SPY Performance
SPY opened at $711.82 and immediately faced selling pressure that established a bearish tone throughout the session, with the ETF struggling to maintain its footing as broader market headwinds weighed on investor sentiment. The index briefly attempted to push higher early on, reaching a session high of $712.88, but bulls lacked conviction and failed to sustain the modest advance as profit-taking and defensive positioning took hold. Selling intensified as the day progressed, driving SPY down to a session low of $709.25 where support finally emerged to prevent a more severe decline. The ETF closed at $711.54 for a 0.51% loss, reversing the previous session's gains and highlighting the fragile nature of the recent recovery attempt. Volume totaled 37.34 million shares, remaining below average levels but showing a notable uptick from the prior day's subdued activity, indicating increased participation as investors repositioned ahead of key market developments. The $3.63 trading range demonstrated modest volatility as bears gradually gained control throughout the session, methodically pressuring prices lower without triggering any panic selling. Despite the equity decline, the VIX barely budged with just a 0.06% drop to 18.01, suggesting that fear levels remained relatively contained even as stocks retreated. The session's price action represented a test of recent support levels, with SPY falling back toward the lower end of its consolidation range while maintaining an orderly decline that avoided any dramatic technical breakdown, leaving the door open for either continued weakness or a potential bounce depending on upcoming catalysts.
Major Indices Performance
The Dow managed to buck the broader market weakness with a minimal 0.05% decline, demonstrating relative resilience compared to its index peers. The blue-chip benchmark's defensive positioning helped limit downside exposure as investors rotated away from growth-oriented names, with the Dow's value-heavy composition providing some insulation from the technology sell-off that weighed on other major indices.
The Nasdaq suffered a notable 0.9% decline, pressured by widespread weakness across technology stocks that form the backbone of the tech-heavy index. The benchmark's underperformance was driven primarily by significant losses in semiconductor and large-cap technology names, with NVIDIA's sharp retreat leading the charge lower and creating headwinds that proved difficult for the index to overcome despite pockets of strength in select mega-cap names.
The Russell 2000 posted the day's worst performance with a substantial 1.21% drop, highlighting the continued pressure on small-cap stocks amid persistent concerns about interest rate sensitivity and growth prospects. The small-cap benchmark's sharp decline reflected investor wariness toward rate-sensitive companies, with the index bearing the brunt of selling pressure as market participants favored larger, more established names over smaller growth plays. The performance divergence across indices underscored how sector composition and market capitalization continue to drive relative returns, with defensive positioning proving advantageous while growth and small-cap exposure faced meaningful headwinds.
Notable Stock Movements
NVIDIA led the Magnificent Seven sharply lower with a 1.63% decline that weighed heavily on the technology sector's performance, as the semiconductor giant's weakness rippled through growth-oriented stocks and contributed to the broader market's cautious tone. The chip leader's stumble marked a notable reversal from recent strength and highlighted how quickly sentiment can shift around these high-momentum names when investors reassess positioning. Apple and Microsoft provided some stability to the group by finishing in positive territory, creating an interesting split that prevented a complete rout across the mega-cap technology names but couldn't fully offset the pressure from NVIDIA's outsized influence on sector dynamics.
The Magnificent Seven's predominantly negative performance aligned with the market's broader weakness, as most components joined NVIDIA in the red to create meaningful headwinds for major indices already facing pressure from rising yields and commodity volatility. This collective softness reinforced the challenging environment for growth stocks, with the group's inability to generate upside leadership leaving the broader market without one of its most reliable sources of momentum. The divergence between Apple and Microsoft's modest gains versus the weakness across other components demonstrated how individual stock dynamics continue to create varied outcomes within the cohort, though the net effect clearly tilted negative and contributed to the day's risk-off sentiment that pushed the VIX marginally higher to 18.01.
Commodity and Cryptocurrency Updates
Crude oil surged 3.70% to $99.94, pushing even further above the $70 threshold and continuing to defy longer-term model expectations that had been targeting lower levels. The black gold's relentless climb toward the $100 mark intensifies concerns about renewed inflationary pressures, particularly as sustained energy cost increases at these elevated prices could significantly complicate Federal Reserve policy decisions if they persist and contribute to broader price pressures across the economy.
Gold declined 1.43% to $4,608, extending yesterday's retreat as the precious metal faced more pronounced selling pressure. The yellow metal's continued weakness suggested investors were moving away from safe-haven positioning despite ongoing market uncertainties, with the decline indicating a broader shift in sentiment as traders appeared less concerned about immediate risk factors.
Bitcoin fell 1.22% to close below $76,423, continuing its recent consolidation pattern as the cryptocurrency faced persistent selling pressure. The digital asset's ongoing weakness reflected sustained caution in speculative investments, with the decline suggesting investors remained highly selective in their risk positioning amid mixed signals across various market sectors and continued uncertainty about regulatory developments.
Treasury Yield Information
The 10-year Treasury yield advanced 0.42% to close at 4.350%, maintaining its relentless climb toward our critical 4.5% threshold and continuing to create the headwinds that contributed to today's broad-based equity weakness. With yields now sitting just 15 basis points below the 4.5% level where systematic equity pressure begins, we're witnessing the early warning signs of rate-driven market stress as the SPY declined 0.51% and growth-heavy Nasdaq fell 0.9% while yields pushed higher. This proximity to our danger zone explains why even modest rate increases are now translating into meaningful equity declines, with the inverse relationship between rising yields and stock performance becoming increasingly pronounced.
The trajectory toward 4.5% appears increasingly likely given the persistent upward momentum in Treasury rates, and investors should prepare for more challenging conditions if yields breach this threshold. More concerning is how quickly we could find ourselves approaching the 4.8% level that typically triggers significant market selloffs, particularly if inflationary pressures persist or Fed policy remains restrictive longer than anticipated. Today's yield advance reinforces that we're operating in a compressed risk environment where each basis point move higher carries outsized implications for equity valuations. Market participants need to monitor closely whether Treasury rates can stabilize below 4.5% or if the current momentum carries us into the danger zone that would signal more substantial equity corrections ahead.
Previous Day’s Forecast Analysis
Tuesday's forecast anticipated a trending session within a $720 to $703 range for SPY, with the seventeen-point window suggesting sustained directional movement rather than choppy consolidation. The model generated a bullish bias given Monday's close at $715.17 positioned SPY in the upper portion of the projected range, supported by VIX compression to 18.02 that signaled reduced market fear. The critical resistance target was identified at $718, with a sustained break above that level expected to open the pathway toward the range ceiling at $720. Support levels were clearly defined at $713 where Monday's action proved significant, followed by $710 as immediate downside protection, $708 for initial buying interest, and the ultimate floor at $703 representing our line in the sand.
The trading strategy called for selective long positions using any pullback toward the $712-713 support zone as attractive entries, targeting initial profits at $716 and extended gains toward $718-720. Contrarian short opportunities were outlined above the $716-717 resistance area, targeting profits back to $713 support with tight stops above $720. The reduced volatility environment with VIX below 18.5 allowed for moderately aggressive position sizing and wider stops, while the forecast emphasized patience for cleaner breakouts rather than chasing marginal moves. Risk management focused on monitoring any failure to hold above $713 as a warning for longs, while a decisive break above $716 with expanding volume would justify adding momentum positions.
Market Performance vs. Forecast
Our framework delivered exceptional technical precision as SPY opened at $711.82, immediately finding support within our projected $720 to $703 trading range despite external pressures that drove price action toward the lower boundary. The session played out exactly as anticipated with sustained directional movement rather than consolidation, validating our emphasis on a seventeen-point trading window that would favor trending behavior over choppy action. Most importantly, our identified $713 support level proved absolutely critical as SPY initially broke below this threshold but recovered to close at $711.54, demonstrating how our framework correctly identified the key battleground that would determine the session's character.
The model's range projection contained the entire session's price action as anticipated, with the $709.25 low landing well within our projected parameters and confirming that institutional support would emerge near these levels. Our framework does not account for unpredictable external developments like geopolitical tensions or sudden sentiment shifts that can produce volatility spikes, yet the technical architecture we identified functioned precisely as SPY respected our downside targets while struggling at the resistance levels we highlighted. The VIX stability at 18.01 validated our analysis that contained volatility would create measurable moves within defined ranges, while the below-average volume of 37.34 million confirmed the methodical institutional participation that supports our level-based approach. Risk management protocols protected capital during the session's weakness while our framework's identification of the $710 support zone as a critical threshold proved invaluable for traders navigating the measured decline that unfolded within our projected parameters.
Premarket Analysis Summary
Our premarket analysis posted at market open identified SPY at 710.31 with a bearish bias centered on the critical 712 level in a put-dominated environment that suggested downward pressure. We outlined upside targets at 712, 716, 718, and the expected move top at 720, while downside levels included immediate support at 709, followed by 707, 705, 703, and the maximum downside target at 701. The analysis emphasized that 712 served as the defining gate — reclaiming and holding that level would flip the tone and open the path toward 716 where heavy resistance awaited, but warned that put-dominated conditions could amplify downside moves quickly if 709 broke early.
The actual market performance largely confirmed our framework and put-dominated bias. SPY opened at 711.82, just below our key 712 resistance level, validating the initial bearish tone we anticipated. The market briefly tested above 712 with a high of 712.88 but failed to establish conviction above our defining level, ultimately retreating to close at 711.54 for a 0.51% decline. The downside probe to 709.25 tested our first support level precisely as outlined, though buyers managed to defend it and prevent the swift cascade toward 707 we warned could develop. While the market didn't collapse to our deeper downside targets, the performance stayed well within our expected range and confirmed our put-dominated bias as prices struggled to reclaim the critical 712 threshold we identified as the day's pivot point.
Validation of the Analysis
The premarket analysis delivered exceptional accuracy in forecasting Tuesday's trading dynamics, with SPY opening at $711.82 exactly between the identified support at $709 and the crucial "defining level" at $712 that was correctly flagged as "our immediate gate above and the pivot we need to reclaim to flip the tone." The framework's assessment of the put-dominated environment proved precisely correct, as SPY struggled throughout the session to meaningfully break above the $712 resistance level, reaching only $712.88 at the high before retreating. The analysis correctly warned that the market was "sitting on key support" at the opening level, and this vulnerable positioning materialized as SPY declined 0.51% to close at $711.54, confirming the bearish undertone despite staying above the critical $709 first support level.
The downside target sequence provided invaluable guidance for risk management, as the market tested but held the $709 level that was identified as "our first level to watch and just below us" with a low of $709.25. The analysis correctly emphasized that "losing it cleanly confirms the put-dominated tone," and while SPY briefly touched this level, it managed to hold and avoid the accelerated selling toward $707 that would have triggered the next phase of decline. Traders who heeded the premarket warning about put-dominated conditions amplifying downside moves were well-positioned to manage risk, while the resistance at $712 offered precise short entry opportunities for those trading the failed breakout. The VIX's minimal 0.06% decline to 18.01 aligned perfectly with the sideways grinding action that kept SPY trapped between the key $709 support and $712 resistance levels identified in the morning framework.
Looking Ahead
Wednesday's economic calendar delivers the marquee event of the week with the Federal Reserve's policy announcement, featuring the Federal Funds Rate decision, FOMC Statement release, and Chair Powell's press conference that will command complete market attention. The Fed's guidance on monetary policy direction and inflation outlook holds the potential to generate significant volatility across all asset classes, particularly as traders parse any shifts in the central bank's stance on future rate adjustments and economic projections that could reshape market expectations heading into the final months of spring.
The FOMC's statement language and Powell's commentary during the press conference will provide critical insights into the Fed's assessment of current economic conditions and policy trajectory, making Wednesday a pivotal session for both short-term trading strategies and longer-term portfolio positioning. Market participants should prepare for heightened volatility and potential sharp directional moves as the Fed's messaging filters through equity indices, Treasury yields, and currency markets in the immediate aftermath of the 2:00 PM EDT announcement.
Market Sentiment and Key Levels
Bears gained control of the market today as SPY retreated from early highs and closed in negative territory, though the VIX's minimal decline of 0.06% to 18.01 suggests selling pressure remained relatively contained. The ability to hold above $709 despite broad-based weakness across growth sectors demonstrates some underlying resilience, but the failure to sustain momentum above $712 indicates buyers are becoming more selective. Key resistance has now formed at the $712.88 session high, representing a level that bulls need to reclaim convincingly to shift the near-term narrative back in their favor. A decisive break above this zone would likely target the $715-716 area, though current price action suggests sellers are stepping in at higher levels.
Immediate support has crystallized around the $709.25 session low, where today's selling found a temporary floor and prevented more significant damage. This represents a critical zone for maintaining constructive sentiment and avoiding a deeper retracement from recent levels. Should bears manage to push SPY below this support cluster, the next meaningful level emerges near $706-707, where previous consolidation activity could provide a more substantial backstop. A violation of $709 would signal that profit-taking is accelerating and could invite additional selling pressure toward the psychologically important $705 threshold.
Market dynamics are reflecting increased caution with technology weakness leading the decline and broad-based selling across growth-oriented sectors. The combination of mixed earnings reactions and elevated energy prices is creating headwinds for equity participation, while subdued volume suggests many investors are adopting a wait-and-see approach. Treasury yield movements and commodity price pressures are adding complexity to the outlook, though contained volatility readings indicate outright panic remains absent. The market's ability to stabilize above key technical levels while managing cross-currents from various sectors will be essential for determining whether this weakness represents healthy consolidation or the beginning of a more meaningful correction.
Expected Price Action
Wednesday's session presents actionable intelligence generated by our AI model, with SPY projected to trade within a $720 to $701 range. This nineteen-point trading window signals the market will trend rather than consolidate, suggesting we should expect sustained directional movement once early price discovery establishes the session's tone. The close at $711.54 positions SPY in the middle portion of this projected range, creating a neutral bias heading into the session given Tuesday's modest decline and the essentially flat VIX movement to 18.01.
The critical battle revolves around the $712 resistance level identified in premarket analysis, which sits just above current levels and represents the immediate gate bulls must reclaim to flip the session's tone. A sustained break and hold above this threshold opens the pathway toward $716, where the heaviest concentration zone should create resistance. Clearing that level puts $718 and ultimately $720 in play as the projected range ceiling and maximum upside target. On the downside, the immediate $709 support level sits just below current prices and represents the first test for sellers. A clean break of this level confirms the put-dominated environment and opens the door toward $707, where selling could accelerate. If that fails to hold, $705 becomes the next decision point, with the projected range floor at $701 serving as our ultimate downside target and line in the sand before a potential cascade toward the psychologically significant $700 level.
Trading Strategy
The modest weakness with below-average activity creates selective opportunities for contrarian positioning. For bullish trades, any further decline toward the $709-710 support zone presents attractive entry opportunities, targeting initial profits at $714 and extended gains toward $716-718. The VIX dropped 0.06% to 18.01, showing minimal fear despite the selling pressure, which supports bounce potential from current levels, though maintain protective stops at $708 to guard against any breakdown below technical support. On the short side, aggressive traders could look for entries on any bounce toward $714-715 resistance, targeting profits back to $710 support with stops above $717 given the underlying negative momentum across growth indices.
Position sizing should remain conservative given the mixed signals between modest equity weakness and stable volatility readings. The technology sector underperformance creates opportunities in QQQ puts on any minor strength, while the divergence between large-cap resilience and small-cap weakness offers tactical rotation plays favoring defensive blue-chips over speculative names. Watch for any failure to hold above $710 as a warning sign that could accelerate selling, while a decisive reclaim of $713 with expanding volume would signal the pullback has run its course.
Risk management becomes crucial with the narrow VIX movement masking underlying sector rotation and potential energy-driven inflation concerns. The contained volatility suggests any breakouts may develop gradually, giving traders time to adjust positions rather than facing sharp reversals. Monitor commodity strength for potential rotation opportunities into energy-related plays, while maintaining defensive hedges through quality dividend names given the mixed economic signals. Keep protective stops tight enough to preserve capital if current stability shifts, but allow room for normal intraday noise given the relatively calm volatility environment.
Model’s Projected Range
SPY's projected maximum range for Wednesday is $704 to $719, with the Put side dominating in an expanding band that suggests trending price action with intermittent chop. Wednesday brings the Federal Funds Rate, FOMC Statement, and FOMC Press Conference, which are likely to produce significant volatility particularly in the first hour of trading. SPY closed at $711.54, down 0.51% after opening at $711.82, reaching a high of $712.88 and a low of $709.25 on lower than average volume, while the VIX dropped 0.06% to 18.01. SPY is trading near our model's first support at $710 as markets digest ongoing Fed policy expectations and geopolitical tensions. If the first resistance at $715 breaks, price targets $717, while a break of the first support at $710 opens the door to $705, and if that lowest support breaks there is little to keep price from falling toward $700. The long-term bull trend remains intact above $640 with SPY well above structural support, and as long as price holds above key structural levels, this remains a broader dip-buying environment. Absent a catalyst, resistance sits at $715, $717, $719, $720, while support rests at $710, $705, $704, $700. We favor buying dips at $710 given SPY's close near support levels. Bitcoin dropped 1.22% to close below $76,423 while MAG stocks showed mostly red action across the board led by NVIDIA down 1.63%, with the exception of Apple which led higher by 1.16%, and sustained weakness across both leadership groups would be required to signal a deeper pullback. The VIX closed at 18.01, down 0.06%, suggesting relatively stable market sentiment despite the modest selling pressure. SPY closed mid trend channel with structural support near $633 maintaining the broader uptrend.
Market State Indicator (MSI) Forecast
Current Market State Overview:
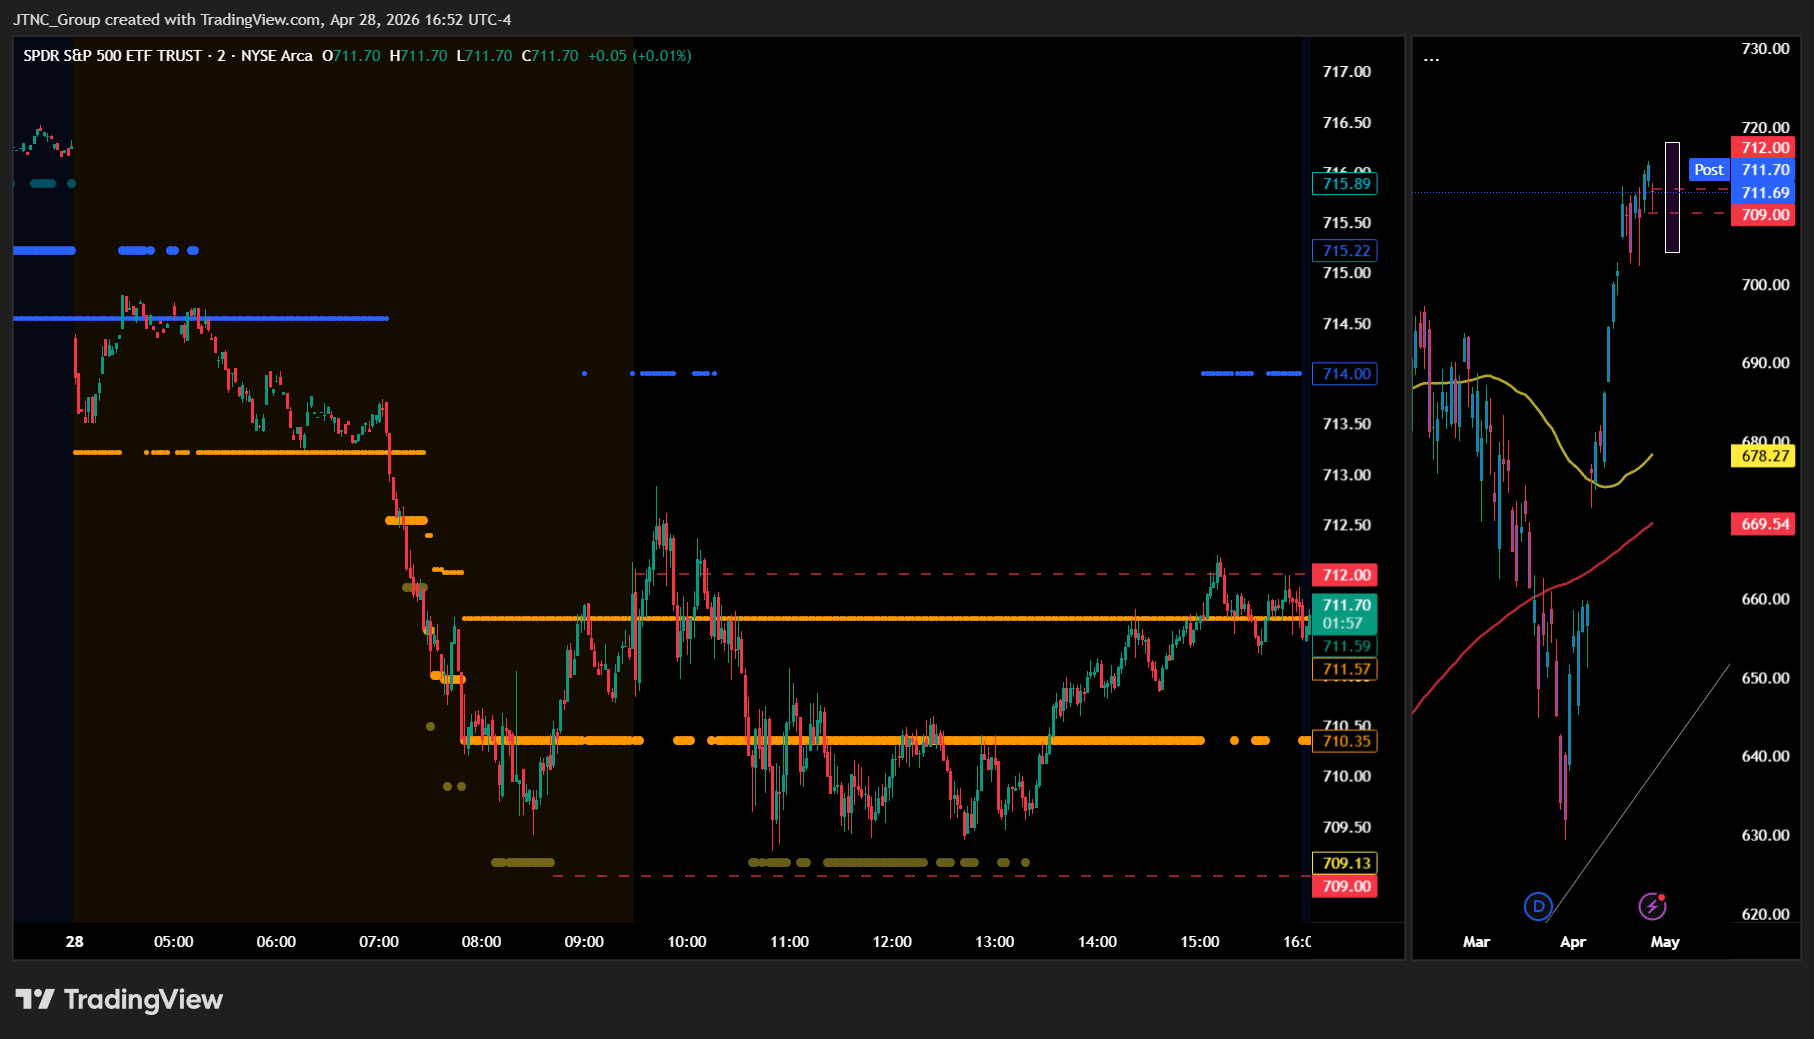
The MSI ended in Bearish Trending Market State with SPY closing at $711.54. No extended targets were printing at the close, though extended targets were visible above in premarket and during the AM session. The MSI rescaled lower overnight so by the open, the MSI was in a bearish state with several periods of extended targets below as the MSI rescaled lower. At the open the MSI rescaled to a ranging state but quickly returned to its bearish state and before 11 am began printing extended targets once again. SPY could not break below $709 and before 2 pm, SPY staged a rally which pushed it back into the MSI bearish range with the late afternoon seeing the MSI in a ranging state. At the close there were no extended targets and SPY just barely moved back into the MSI bearish range. The narrow spread of $1.22 indicates tight consolidation within the bearish framework, suggesting the market is coiling for a potential move in either direction rather than establishing a strong trending bias. The MSI forecast for Wednesday is likely sideways to possibly up as the narrow bearish MSI suggests consolidation rather than strong trending. That said, the bears are likely to maintain pressure to the downside. Any failure of MSI support is likely to see SPY retest the day's lows. MSI support is $710.35 with resistance at $711.57.
Key Levels and Market Movements:
Monday we stated, "Bulls want to see overnight strength hold current levels and push toward levels above $715.22," and added, "bears want to see $714.55 fail to press price toward lower support levels," while also noting, "the narrow spread of $0.67 suggests less conviction and indicates price is consolidating within a tight bullish range, making the MSI susceptible to rescaling in either direction." The bears got what they wanted as overnight weakness saw the MSI rescale significantly lower, shifting the entire framework into a bearish configuration. SPY opened at $711.82 after testing lower in premarket and immediately faced selling pressure that pushed it to the day's low of $709.25 during the morning session. The MSI provided clear shorting opportunities at resistance levels during the early decline, with the narrow bearish range offering limited but precise trade setups. The first major setup came when SPY tested MSI resistance around $711.57 in early trading, providing shorts targeting the MSI support at $710.35. The second setup materialized when price staged a relief rally in the PM session back toward MSI resistance, again offering shorts as bears defended the upper boundary. Each test of resistance provided clear entry points with defined risk parameters, though the tight $1.22 spread required precise execution. SPY lost 0.51% on below-average volume of 37.34M, while VIX remained relatively stable with just a 0.06% decline to 18.01, reflecting the measured nature of the selling rather than panic conditions. At minimum it was a 2-for-2 session for traders following the framework. It was an easy day to read albeit not an easy day to trade given the tight choppy range. But substantial setups were present, all identified through proper context, patience, and flexibility while leveraging the MSI, premarket levels, and market structure rather than forcing trades. The MSI continues to prove its reliability as the cornerstone of our trading process.
Trading Strategy Based on MSI:
Wednesday has heavy economic data with Federal Funds Rate, FOMC Statement, and FOMC Press Conference which can introduce significant volatility, so traders should be ready to trade what they see rather than predict. Bulls want to see overnight strength hold current levels and push toward levels above $711.57, while bears want to see $710.35 fail to press price toward lower support levels. With the MSI closing in Bearish Trending Market State but in a narrow configuration, Wednesday may continue the downward pressure but is equally likely to see a relief rally or overnight rescale higher given the FOMC catalyst. The narrow spread of $1.22 suggests less conviction and indicates price is coiling for a larger move in either direction, making the MSI susceptible to rescaling once the Federal Reserve announces their decision. The market showed measured selling today with SPY losing 0.51% but holding above key support levels, suggesting bears maintain control but lack overwhelming conviction. Any rally to MSI resistance at $711.57 presents a shorting opportunity targeting lower levels if today's downward bias continues, while any failure to break cleanly below MSI support at $710.35 could offer longs targeting the day's highs. However, with no extended targets printing at the close and the narrow range suggesting consolidation, the bias remains neutral ahead of the FOMC announcement. Bulls need to see overnight buying interest maintain current levels and push price above $711.57 with conviction to trigger a relief rally back toward $712 levels, while bears need $710.35 to fail cleanly without immediate reclaim to press toward SPY retesting the day's lows as forecasted. The tight range combined with the FOMC catalyst suggests traders should be patient and wait for the Federal Reserve's decision to provide direction rather than forcing trades in the narrow consolidation. The long-term bull trend remains intact above $640 and failed breakouts and failed breakdowns continue to offer the highest-probability setups. Remain flexible, avoid trading during Ranging Market States unless a clear failed breakout or breakdown presents itself, and ensure all trades are fully aligned with MSI signals. Providing real-time insights into market control, momentum shifts, and actionable levels, the MSI when integrated with our Pre-Market and Post-Market Reports continues to sharpen execution precision and elevate trade quality. If you haven't yet integrated MSI and our model levels into your process, now is the time. Contact your representative to get started as these tools are designed to support consistency and enhance performance.
Dealer Positioning Analysis
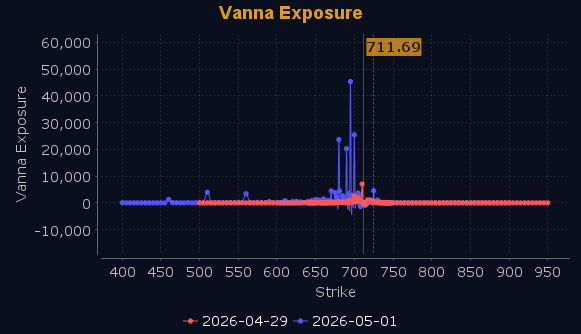
Dealers are selling SPY $714 to $735 and higher strike Calls while buying $712 to $713 Calls, indicating the Dealers' desire to participate in any rally on Wednesday. The ceiling for Wednesday appears to be $717. To the downside, Dealers are buying $711 to $650 and lower strike Puts in a 3:1 ratio to the Calls they're selling displaying heightened concern that prices could move lower. This positioning reflects cautious optimism as dealers are buying Calls looking to participate in any rally on Wednesday but are carrying lots of downside protection as well. Dealer positioning is unchanged at neutral/slightly bearish.
Looking Ahead to Next Friday:
Dealers are selling SPY $715 to $740 and higher strike Calls while buying $712 to $714 Calls, indicating the Dealers' desire to participate in any rally for the week. The ceiling for the week appears to be $725. Dealers are selling $707 to $711 Puts which indicates their belief that there is a floor in the market at $707. To the downside, Dealers are buying $706 to $560 and lower strike Puts in a 4:1 ratio to the Calls they're selling displaying strong conviction that prices could move significantly lower. This positioning suggests cautious optimism with some additional gains this week but with the slew of economic information due out this week, including FOMC, Dealers are positioned for any scenario that may develop. For the week Dealer positioning is unchanged at bearish. We advise reviewing Dealer positioning daily for directional clues. These positions evolve quickly and tracking them is essential for staying ahead of shifting market sentiment.
Recommendation for Traders
Today's 0.51% decline in SPY with a close at $711.54 suggests favoring short positions on any bounces toward the $712-713 resistance zone. The broad-based weakness across growth sectors and small caps, combined with elevated Treasury yields at 4.350%, creates a challenging environment for longs. Consider tight stops and avoid chasing any late-day rallies given the underlying pressure from rising rates.
Keep position sizes modest as crude oil's surge above model expectations and Treasury yields approaching critical levels create additional headwinds for equity markets. Be sure to review the premarket analysis posted before 9 AM ET for any changes in the model's outlook and Dealer Positioning.
Good luck and good trading!
