Market Insights: Monday, April 28th, 2025
Market Overview
Stocks bounced back on Monday, recovering from early losses to extend the S&P 500 and Dow’s winning streaks to five days, ahead of a pivotal week packed with major earnings and key economic data. The Dow managed to climb 0.28%, marking its longest rally of the year, while the S&P 500 eked out a modest gain, closing just above the flatline. The Nasdaq dipped slightly, down 0.10%, weighed by a pullback in Big Tech after an early-session slump. Investors are bracing for a flood of earnings reports, particularly from tech giants Apple, Amazon, Meta, and Microsoft, as well as closely monitoring economic indicators to gauge how the economy is coping with President Trump’s steep tariffs on Chinese imports. Treasury Secretary Scott Bessent reiterated that the next steps lie with China, though Beijing’s recent moves to exempt certain U.S. goods from tariffs offered a glimmer of hope. The market’s recent gains have been partly attributed to Trump easing pressure on Fed Chair Jerome Powell, hinting at a more flexible stance on monetary policy. With 180 S&P 500 companies reporting this week, alongside critical data like GDP and the Fed’s preferred inflation gauge, traders expect heightened volatility. Monday’s resilience shows investors remain cautiously optimistic despite ongoing trade uncertainties and looming macro headwinds.
SPY Performance
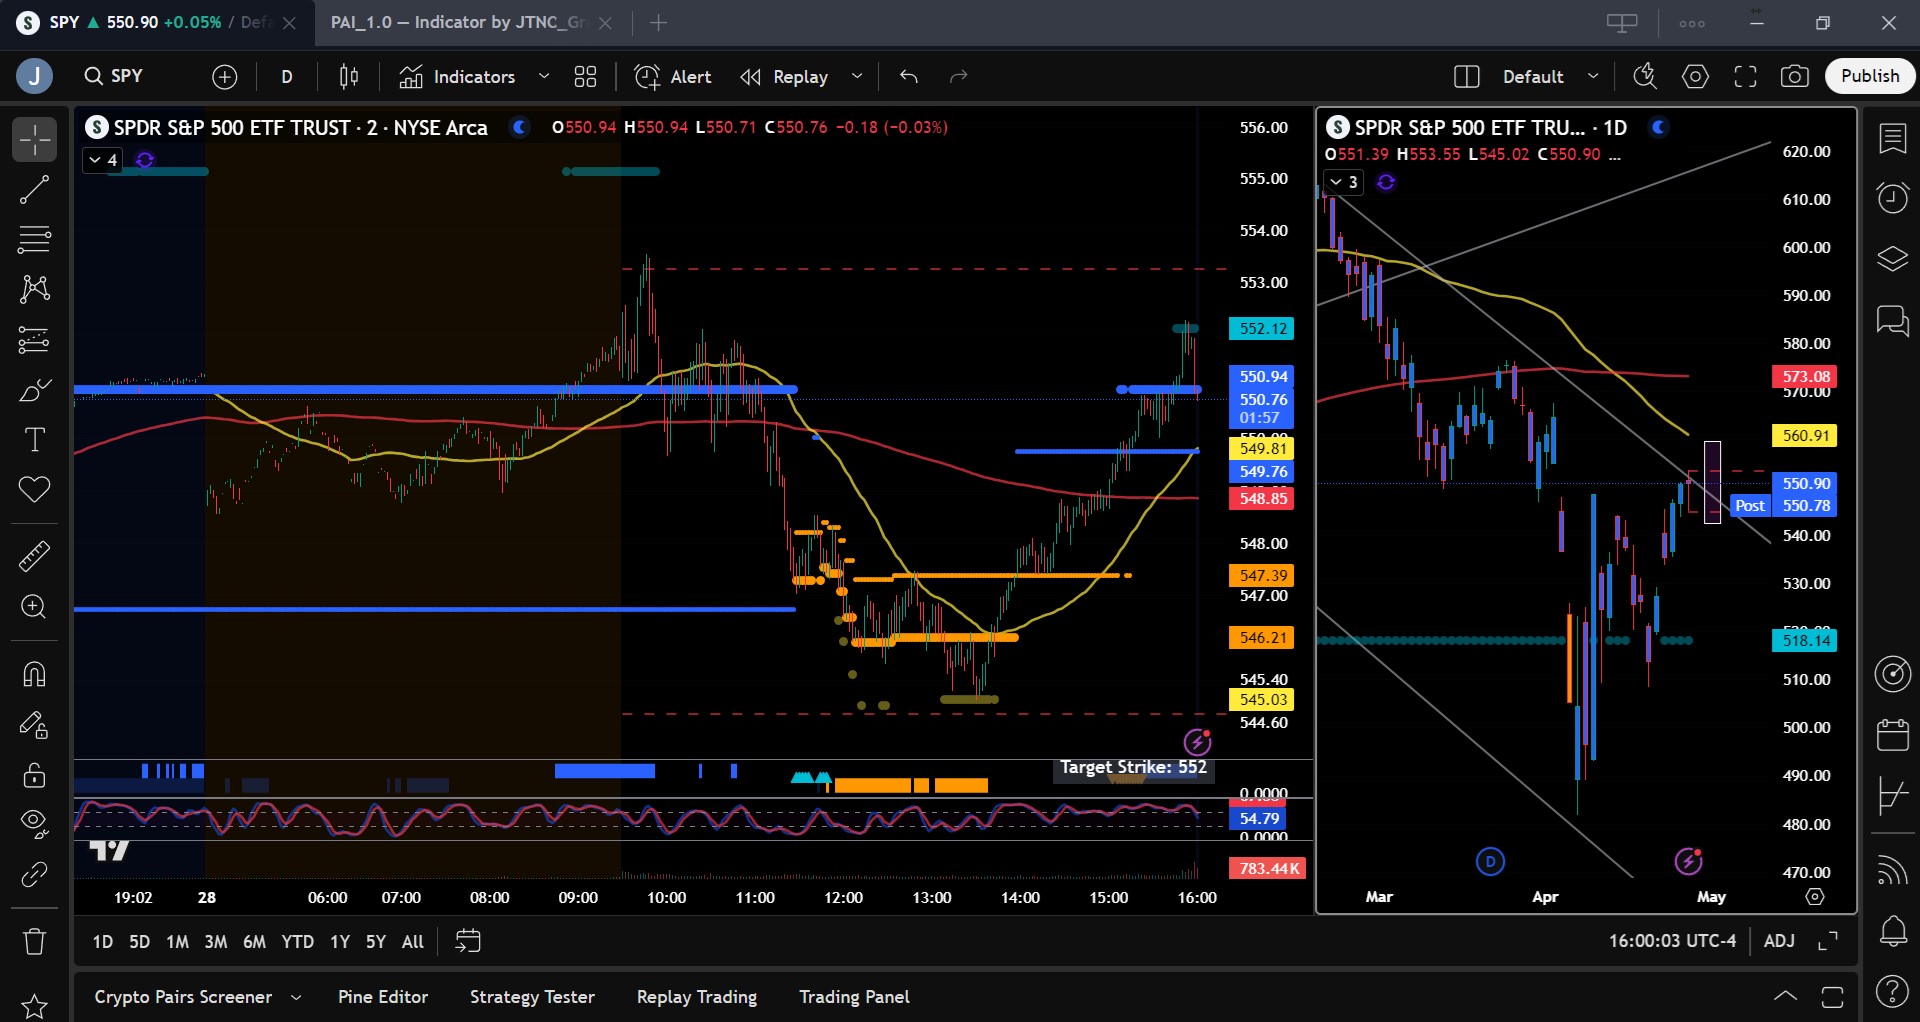
SPY closed nearly flat, rising just 0.05% to end the session at $550.90 after opening at $546.65. The ETF traded within a relatively tight range, hitting a high of $553.55 and a low of $545.02. Volume was notably below average at 41.87 million shares, suggesting traders might be taking a wait-and-see approach ahead of major earnings and economic data later this week. Despite muted movement, the close above $550 reinforces near-term bullish momentum, especially as SPY continues to defend key support levels.
Major Indices Performance
The Russell 2000 led the way with a gain of 0.33%, supported by strength in small-cap stocks as investors sought broader market exposure beyond large-cap tech. The Dow followed, adding 0.28% and posting its fifth straight win, with resilience in financial and industrial sectors providing a lift. The S&P 500 edged up 0.05%, extending its own streak to five sessions despite intraday weakness. Meanwhile, the Nasdaq dipped 0.10% as tech stocks faced some pressure, reversing gains from earlier in the day. Defensive sectors saw mixed performance, with healthcare and utilities lagging slightly. Overall, markets remained focused on the interplay between trade policy and interest rate expectations.
Notable Stock Movements
It was a mixed day for the Magnificent Seven stocks. Nvidia led to the downside, falling over 2% amid profit-taking after a strong run. Alphabet, Amazon, and Microsoft also slipped slightly, while Tesla, Apple, and Meta managed modest gains. The divergent performance reflected caution ahead of earnings, especially for the tech-heavy Nasdaq, and highlighted investor sensitivity to both corporate results and broader macroeconomic signals.
Commodity and Cryptocurrency Updates
Crude oil dropped sharply by 1.76%, closing at $61.91. Our long-term view remains bearish, projecting a continued decline toward $50, though near-term volatility could arise if the dollar weakens temporarily. Gold surged 1.90% to $3,361, as investors sought refuge amid mixed market signals and lingering trade tensions. Bitcoin climbed 0.56%, ending just above $94,790. We maintain our strategy of buying Bitcoin between $77,000 and $83,000, with an eye toward profits above $85,000, but we advise caution below $77,000 due to heightened downside risks.
Treasury Yield Information
The 10-year Treasury yield fell by 1.38% to close at 4.207%, providing some relief to equities. While the drop supports risk assets, yields remain at levels that could weigh on markets if they rebound. A move above 4.5% would pose a significant challenge for stocks, with yields over 5% likely to trigger a major correction exceeding 20%.
Previous Day’s Forecast Analysis
Friday’s forecast projected a trading range of $542 to $558, with a bullish bias supported by strong Call-side positioning. Resistance levels were noted at $555, $557, $560, and $565, while support was identified at $546, $541, $540, and $535. The strategy favored long trades above $545, aiming for targets at $555 and potentially $560, while warning of a possible test of lower support if $545 failed. Traders were advised to watch for failed breakouts or breakdowns near key levels, particularly $555 and $545.
Market Performance vs. Forecast
SPY’s performance closely aligned with the forecast. It traded within the projected range, from a low of $545.02 to a high of $553.55, before closing at $550.90. The session tested support near $545 and moved toward the anticipated resistance near $555, validating the slightly bullish bias. Long trades above $545 were effective, with profit-taking opportunities emerging near $553. The price action confirmed the significance of the $545 support and the continued influence of bulls in defending key levels. The model’s projected range and bias level provided traders with a clear and actionable roadmap.
Premarket Analysis Summary
In today’s premarket analysis posted at 7:42 AM, SPY was trading at $550.25, with a bias level set at $549. The outlook suggested a fragile continuation of the recent recovery, favoring long trades above $549 with initial targets at $553.75 and a possible high near $557. A break below $549 was expected to lead to consolidation, with downside targets at $544.75 and $540. Traders were advised to favor fading moves near the edges rather than trading within the middle range, emphasizing caution due to expected choppy conditions.
Validation of the Analysis
The premarket analysis proved accurate once again. SPY respected the $549 bias level, trading as low as $545.02 but ultimately holding above it for much of the session. The ETF pushed higher to $553.55, nearing the premarket target of $553.75, before settling at $550.90. Traders who followed the strategy of buying dips near support saw gains as SPY advanced toward key resistance levels. The expected churning and fragile upside played out as forecasted, reinforcing the reliability of the premarket insights.
Looking Ahead
Tuesday’s focus will be on the JOLTS Job Openings report, which may provide clues about the labor market’s resilience amid ongoing trade tensions. This data, combined with upcoming earnings, could spark increased volatility as investors digest the broader economic picture. Markets will also be bracing for Wednesday’s releases, including GDP and the PCE index, which are expected to have significant impacts on sentiment and price action.
Market Sentiment and Key Levels
SPY’s close at $550.90 keeps the bullish narrative alive, but the market faces significant resistance ahead. Key resistance levels are now at $555, $560, and $565, while support holds firm at $549, $547, $545, and $540. Bulls remain in control as long as SPY stays above $545, but any break below could shift momentum quickly. Sentiment leans bullish, yet caution is advised with earnings and economic data poised to sway market direction.
Expected Price Action
Our AI model projects a trading range of $543 to $555 for Tuesday—this is actionable intelligence. The range suggests a balance between trending moves and consolidation. The bullish bias remains intact, with SPY expected to test resistance at $555 and potentially $560 if support holds. A break below $545 could target $540 and spark a larger pullback. Traders should focus on failed breakouts near $555 or failed breakdowns at $545 for new trade setups, with macro drivers such as tariffs and yields likely to influence sentiment.
Trading Strategy
Long trades are favored above $545, targeting $553, $555, and $560. A breakout above $560 could set the stage for a move to $565. Short trades become more viable below $545, with downside targets at $540 and $535 or above $553. The VIX closed at 25.06, indicating elevated volatility but one that is waning. Traders should continue to maintain tight stops and smaller position sizes, especially as the market approaches key earnings and data events. Be prepared for reversals near resistance and manage risk carefully.
Model’s Projected Range
The model's maximum projected range for Monday is $542.50 to $559.50, with the Call side showing dominance. This suggests continued strength behind the recent five-day relief rally, the first such rally since November 2024. The projected range continues to narrow; while still broad, expect more consolidation around the $545 to $555 level, with occasional trending moves. As long as this range holds, the market is likely to push higher, with $560 and $565 as the next targets for the bulls. However, if $545 fails, a corrective leg lower could begin, with $535 as the next test. A failure at $535 would likely trigger a more significant decline. We maintain a preference for two-way trading while remaining cautious, viewing this as a relief rally within an ongoing bear market. With SPY closing just above $550 once again, bulls have retained their foothold as prices approach the top of the bear trend channel established from the December highs. The broader market still appears vulnerable to another leg down, particularly as prices approach the $565–$585 zone, where a retest or breach of recent lows becomes more likely. Historically, declines of this nature tend to unfold 4 to 16 weeks after an initial bottom, so we strongly recommend considering protective strategies or reducing long exposure as key resistance levels are approached. This week brings a wave of earnings, with many companies expected to highlight tariffs in their cautious forward guidance, adding to the already elevated volatility driven by current administration policies. Key technical levels for Tuesday: Resistance – $555, $560, $564. Support – $549, $547, $545, $540. A strong wall of resistance from $551 to $560 is likely to slow any advance on Tuesday. Economic data is light, with only JOLTS Job Openings on the calendar. After five strong sessions that pushed SPY above $535 to a high of $553.55, some consolidation or choppiness is expected. Bulls must defend levels above $535 to maintain upward momentum, with a potential path to full control if they can close above $585. Conversely, a break below $545 may lead to a retest of $535, and failure there could result in a gap fill to $530. Tariffs, bond yields, and inflation remain the dominant macro drivers shaping market behavior over the next 90 days, or until clearer signals emerge from the White House. The VIX closed at 25.06, nearing the 23 level, which should offer further support for equities. The broader bearish trend channel from the December highs remains intact, with SPY now testing its upper boundary. While movement in either direction is possible within this structure, price action is likely to remain largely contained, with significant resistance near $555 and support around $465. Momentum currently favors the bulls, but in this volatile environment, we recommend staying nimble and prepared for rapid shifts.
Market State Indicator (MSI) Forecast
Current Market State Overview:
The MSI is currently in a narrow Bullish Trending Market State, with price closing just below MSI resistance. Extended targets printed into the close as well as during the day session both in an MSI bullish and bearish state. This implies a market which is relatively equally balanced between the bulls and the bears. As such SPY’s range is likely to remain between $545 and $555 until an external catalyst breaks this zone. A wide bullish MSI overnight rescaled to a bearish state at 11:30 am. The bearish MSI was quite narrow but with extended targets below, after a series of rapid rescalings lower, SPY tested $545 which held. SPY reversed from this level and the MSI rescaled through a ranging state to its current bullish stated into the close. Overnight SPY was contained in a very wide bullish MSI until just prior to the open which saw extended targets print with SPY moving to the day’s highs. Currently, MSI support stands at $549.78 with resistance at $550.94.
Key Levels and Market Movements:
On Friday, we noted: “we expect the market to slow down, with more consolidation punctuated by brief periods of trending price action.” We also stated, “Resistance remains strong above $550,” and emphasized that “this environment should offer solid two-way trading opportunities.” Armed with this context, at the open — with price trading above $550 — we were not inclined to chase longs, despite the presence of extended targets overhead. Aware of the strong resistance above $550, we instead waited for price to approach the premarket level of $553.25, anticipating a potential short back toward $550. SPY set up a textbook failed breakout, and because extended targets continued printing, we waited for them to stop before entering short just before 10:00 am at $551.90. We do not accept less than a $1 profit on any trade, and with MSI resistance at $550.96, we turned to our premarket levels for a first target. Holding for $549 — the first level down from the premarket report, we reached this level by 11:10 am and with 70% of our position banked, we moved our stop to breakeven and set our sights on the second target: MSI support at $546.75. The MSI cooperated, rescaling lower to a bearish state and printing extended targets below, reinforcing our confidence that price would reach this level. Sure enough, we hit our second target at noon, taking off another 20% of our position. With 10% left for our final runner, we targeted a test of $545. By 1:30 pm, price reached this level, and we exited our short — a monster first trade. While SPY set up a textbook failed breakdown, extended targets printing, we remained patient, holding off on a long from our favorite trading pattern. Once extended targets ceased printing, we entered long at $546.43, aiming to scalp to MSI resistance at $547.43. We hit this target quickly, took off 70% of our position, and moved our stop to breakeven to protect against a reversal at MSI resistance. Price continued to push higher, and as the MSI rescaled to a ranging state, we aimed for the next level of MSI resistance at $549.75. By 3:10 p.m., we reached it, taking off another 20% of our position. After MSI rescaled to a bullish state, we felt confident that our runner would reach MSI resistance at $551. By 3:40 p.m., satisfied with our gains, we closed out the remaining position at $551, ending the day two for two and starting the week on a very solid footing. This session reinforced our core mantra: have a solid plan, execute with discipline, and let the MSI and model levels guide every decision. The MSI reveals who is in control, when control shifts, and where key actionable levels lie — enabling precise entries and exits. Combined with our model levels and daily strategy, it keeps us aligned with dominant market forces. It continues to deliver with high precision, helping traders avoid traps, stay in sync with momentum, and capture profits confidently. We strongly recommend integrating the MSI into your trading toolkit — paired with a structured plan, it becomes a powerful driver of long-term performance.
Trading Strategy Based on MSI:
Tuesday brings the JOLTS Job Openings report, which may start to reflect some underlying weakness in the economy. If it does, the market could use it as an excuse to take profits after the five-day green streak just completed. As we’ve noted since the new administration took office, anything can happen at any time — so barring unexpected events, we expect the market to consolidate with periods of trending price action between $545 and $555. This environment should offer solid two-way trading opportunities. Bulls may look to retest some of today’s gains, potentially pulling back to $542, while also attempting to reclaim today’s highs and break out toward $555. However, after five consecutive green days, the market likely needs time to backfill and rebuild momentum to push through the heavy resistance above $552. A failure to hold $545 could open the door for a test of $535 — a critical level for bulls to maintain upward momentum. A breakdown below $535 could lead to a gap fill and push price toward $525 or lower. Resistance remains strong above $552, extending up to $560, so any breakout beyond today’s highs is expected to be measured and deliberate. While the edge still belongs to the bulls, that advantage could shift quickly if $535 fails. Bulls won’t fully reclaim control unless SPY regains $585, so caution remains warranted. The 200 DMA at $562 is also expected to present significant resistance. For Tuesday, expect two-way trading with a focus on failed breakouts and breakdowns near the edges — particularly around the $545 and $555 levels. Avoid trading into extended targets or fighting a wide MSI range. As always, trade what’s in front of you: lean on the MSI and stay nimble. The Premarket Report provides fresh data and AI-driven insights to shape your daily strategy, while the MSI updates in real time to reveal intraday structure and momentum shifts — helping you avoid outdated narratives or stale assumptions. Our model levels define high-probability targets and precise entry zones. Together, the MSI and model levels keep you aligned with dominant market forces and help you avoid costly missteps. If you’re not already using these tools, now’s the time. Reach out to your rep — they’re true game-changers in markets like this.
Dealer Positioning Analysis
Summary of Current Dealer Positioning:
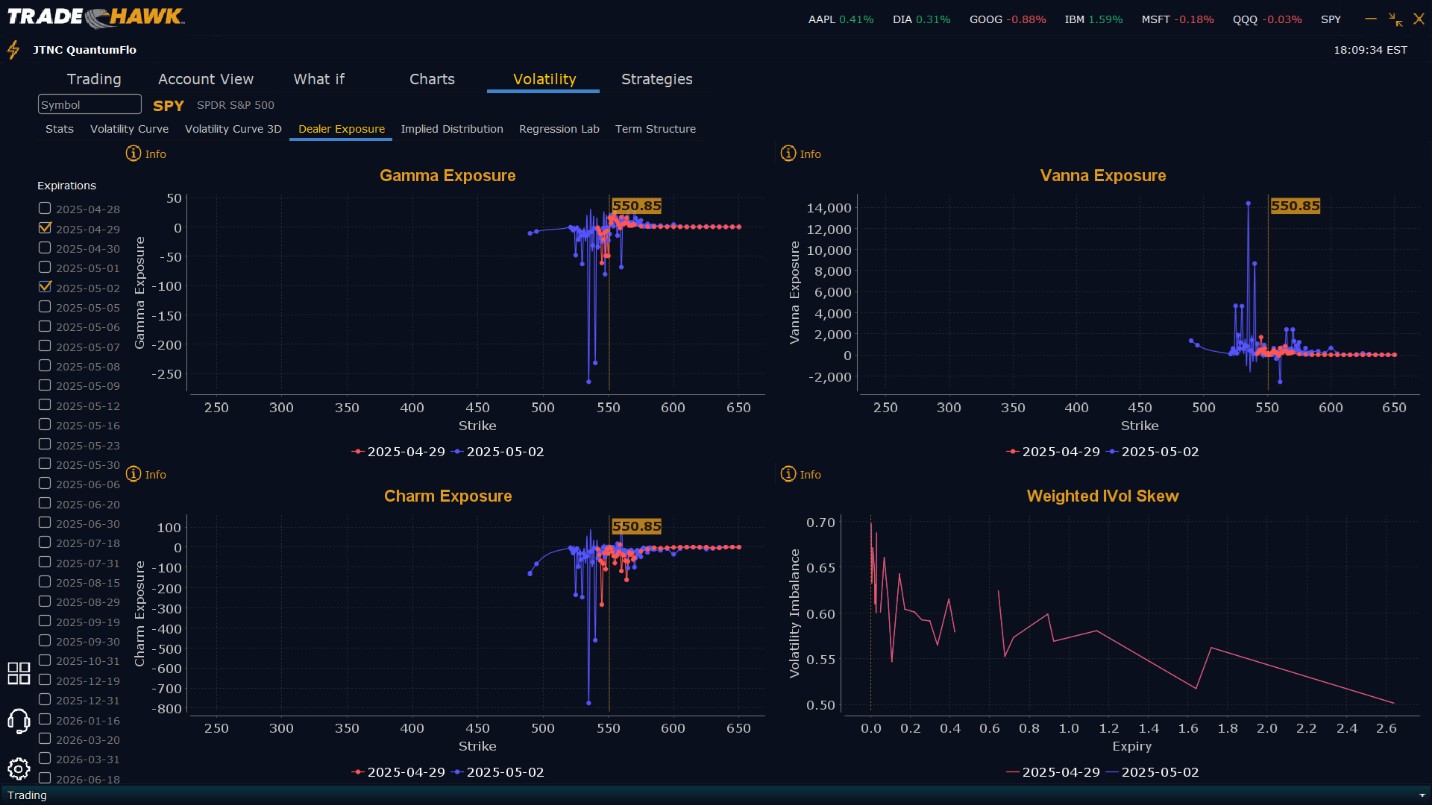
Dealers are selling $551 to $570 and higher strike Calls implying the Dealers belief that prices may stall in the current range with $555 likely as high for Tuesday. Dealers are no longer selling close to the money Puts. The ceiling at $555 they called for today held. To the downside Dealers are buying $550 to $523 and lower strike Puts in a 3:1 ratio to the Calls they are selling, implying a slightly bearish posture for Tuesday. Dealer positioning has changed from neutral/slightly bullish to slightly bearish.
Looking Ahead to Friday:
Dealers are selling $551 to $600 and higher strike Calls while also buying $559 Calls implying Dealers see a likely top at $565 for next week but should price move beyond $560, Dealers want to participate above $559 in any upside. To the downside, Dealers are buying $550 to $490 and lower strike Puts in a 3:1 ratio to the Calls they’re buying/selling. This reflects a slightly bearish outlook for the week. Dealers are heavily protected should $540 fail but are also open to prices reaching $565 and possibly beyond. Dealer positioning is unchanged from slightly bearish to slightly bearish. We advise reviewing Dealer positioning daily for directional clues. These positions evolve quickly and tracking them is essential for staying ahead of shifting market sentiment.
Recommendation for Traders
With SPY closing at $550.90 and the VIX at 25.06, traders should approach the market with a focus on risk management as volatility remains elevated. Long trades are favored above $545, aiming for $553, $555, and $560, while short setups become viable below $545 with targets at $540 and $535 or above $553. Stay nimble and manage position sizes appropriately given the uncertainty tied to upcoming earnings and economic releases. Be sure to review our premarket analysis before 9:00 AM ET to adapt to any changes in sentiment or Dealer positioning.
Good luck and good trading!
