Market Insights: Friday, April 24th, 2026
Market Overview
US stocks delivered mixed results on Friday as semiconductors powered the Nasdaq to fresh records while the Dow declined. The tech-heavy Nasdaq surged 1.6% to a new all-time high, driven by the Philadelphia Semiconductor Index extending its historic winning streak to 18 consecutive sessions since March 30th. The S&P 500 gained 0.8% to close at a record, but the Dow slipped 0.2% as semiconductor strength couldn't lift all boats. Market sentiment also got a boost from the Department of Justice dropping its criminal investigation into Fed Chair Jerome Powell, potentially smoothing the path for President Trump's Fed nominee Kevin Warsh.
The semiconductor rally reached fever pitch as Intel exploded 22% higher after crushing earnings and guidance, marking its best day since 1987 and pushing shares past their dot-com era peaks for the first time. Nvidia reclaimed the $5 trillion market cap crown with a 5.2% gain, adding $260 billion in value and now sporting a $1 trillion lead over second-place Alphabet. The broader chip sector's 40% surge during its 18-day winning streak has accounted for roughly 40% of the S&P 500's entire rally since late March, given semiconductors represent 15.5% of the index's weighting. Meanwhile, software stocks struggled to maintain their recent comeback momentum, with the sector ETF down slightly over the past five days while chips soared more than 11%, highlighting the narrow leadership driving markets higher.
SPY Performance
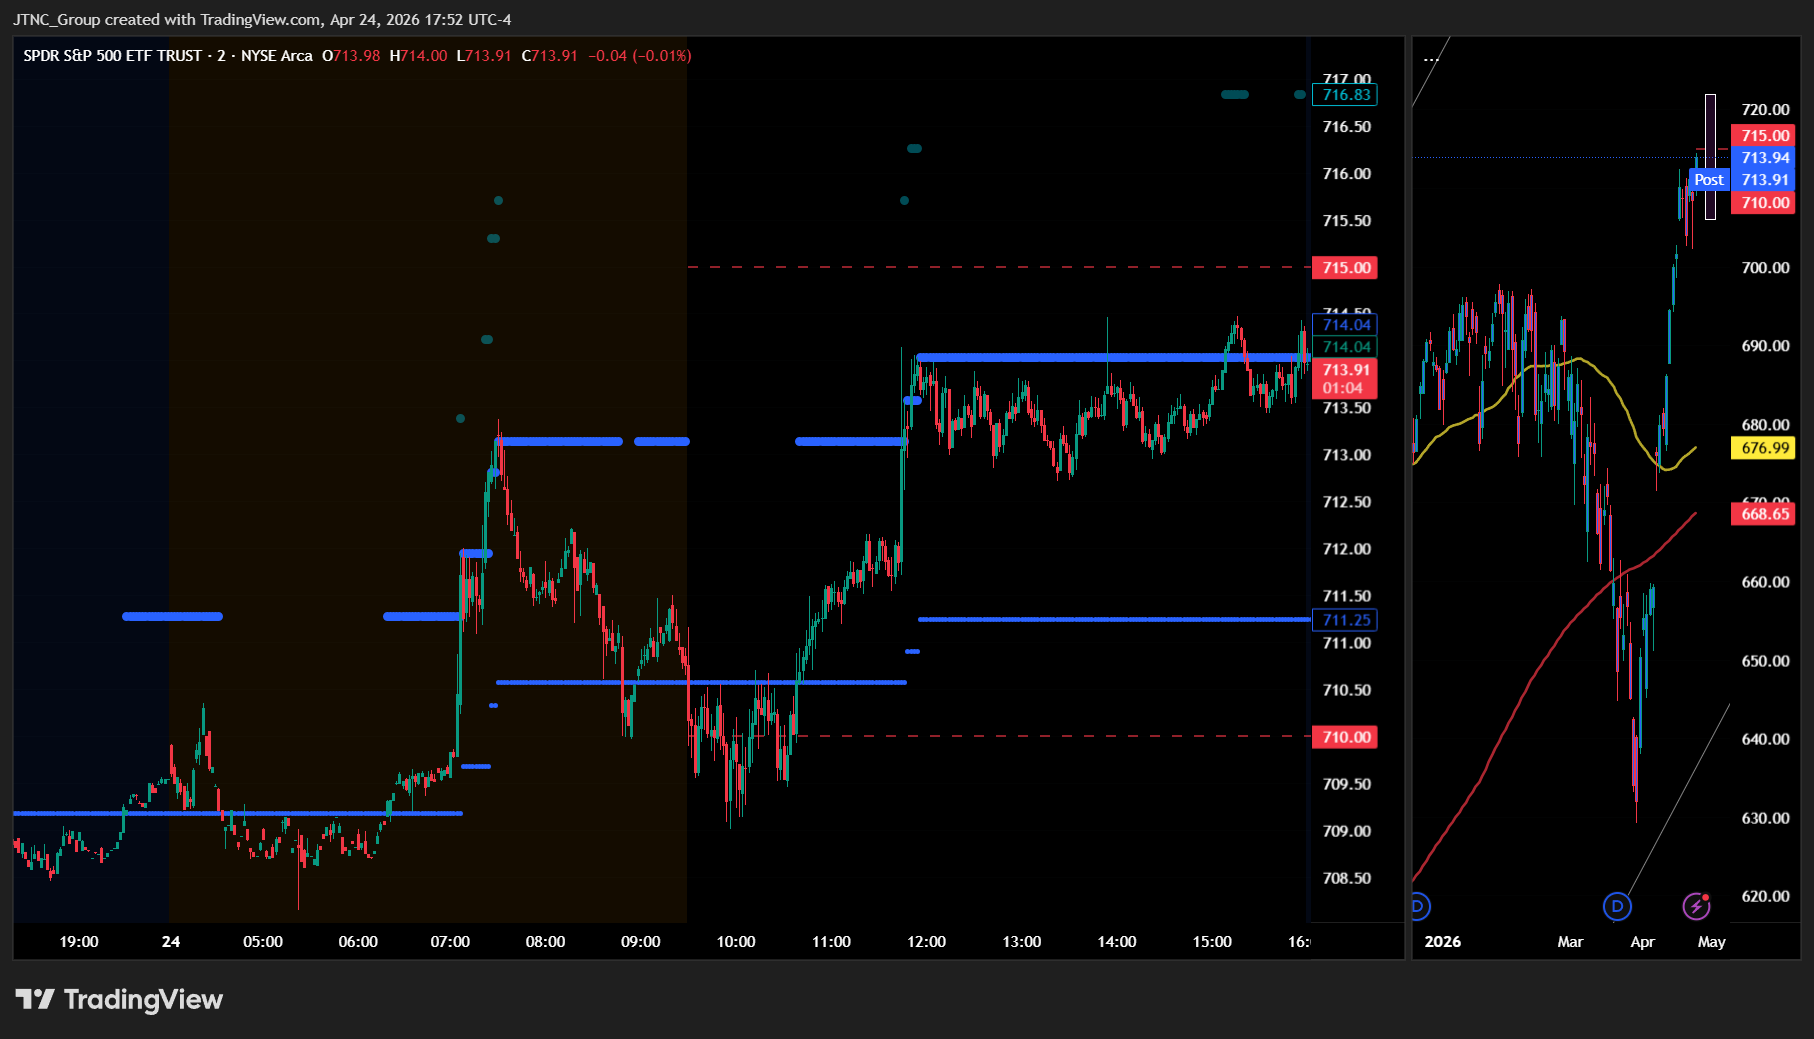
SPY opened at $710.75 and immediately found buying interest that pushed the index to a session high of $714.47, establishing a solid upward trajectory from the opening bell. The ETF maintained strength throughout the session with relatively tight price action, only pulling back to a low of $709.01 before buyers stepped in to support the advance. The index closed at $713.97 for a solid 0.78% gain, representing a clean reversal from the prior session's weakness and demonstrating renewed confidence among market participants. Volume registered 40.63 million shares at near average levels, indicating steady institutional participation without the frantic activity that often accompanies major directional moves. The controlled nature of the advance was particularly encouraging as it suggested disciplined buying rather than speculative momentum, with the narrow $5.46 trading range reflecting orderly price discovery. Risk appetite clearly improved as evidenced by the VIX dropping 3.99% to 18.54, marking a notable decline in fear levels that corresponded with the steady climb in equity prices. The session's price action created a textbook bullish reversal that reclaimed the $710 level decisively while pushing toward the upper end of the recent trading range, suggesting that the previous day's selling may have represented a temporary pause rather than a meaningful shift in sentiment.
Major Indices Performance
The Nasdaq led major indices with a strong 1.63% advance, powered by robust gains across technology stocks that reversed the previous session's weakness. The tech-heavy benchmark benefited from widespread strength among mega-cap technology names, with the sector's recovery driving the index's outperformance as investors returned to growth-oriented plays after the prior day's selling pressure.
The Russell 2000 posted a modest 0.33% gain, showing small-cap stocks managed to participate in the broader market recovery despite ongoing concerns about higher borrowing costs. The small-cap benchmark's more restrained advance compared to the Nasdaq highlighted continued investor selectivity, with growth stocks in the technology sector attracting more aggressive buying than the typically interest-rate-sensitive smaller companies.
The Dow bucked the positive trend with a slight 0.16% decline, held back by its value-oriented composition and lower exposure to the technology sector that lifted other indices. The blue-chip index's underperformance demonstrated how sector allocation continues to drive relative returns, with the Dow's defensive positioning working against it during a session that favored growth and technology names. The performance spread between indices underscored the market's rotation back into momentum plays, rewarding investors who maintained exposure to the technology sector while those focused on traditional value stocks missed out on the day's gains.
Notable Stock Movements
NVIDIA surged 4.32% to spearhead a broadly positive session for the Magnificent Seven, marking a dramatic turnaround from yesterday's technology selloff as risk appetite returned to favor the mega-cap names that have powered this year's market rally. Apple stood as the notable exception with a 0.87% decline, but the chip giant's commanding performance helped lift the entire cohort and provided crucial momentum for the technology sector's recovery. The stark contrast from yesterday's coordinated weakness demonstrated how quickly sentiment can pivot around these influential stocks, with NVIDIA's strength serving as a catalyst for renewed confidence in artificial intelligence and semiconductor themes.
The Magnificent Seven's predominantly green performance aligned perfectly with the broader market's constructive tone, as declining volatility created a more favorable backdrop for growth-oriented names to regain their footing. This collective strength among the technology leaders provided meaningful support for the major indices, reinforcing their critical role as market drivers and showing how their coordinated moves can amplify broader sentiment shifts. The group's ability to bounce back so decisively after yesterday's stumble underscores both their resilience and the persistent investor appetite for these dominant technology franchises, even as concentration risk remains a defining characteristic of current market structure.
Commodity and Cryptocurrency Updates
Crude oil retreated 1.17% to $94.73, pulling back from recent highs but remaining well above the $70 threshold that continues to challenge longer-term forecasting models. The black gold's sustained strength at these elevated levels maintains concerns about renewed inflationary pressures, particularly as energy costs could complicate Federal Reserve policy decisions if they persist and contribute to broader price increases across the economy.
Gold advanced 0.57% to $4,732, building on yesterday's recovery as the precious metal extended its bounce from recent lows. The yellow metal showed renewed strength as investors appeared to rotate back into safe-haven assets, with the modest gain suggesting continued demand for traditional hedges amid ongoing market uncertainties.
Bitcoin declined 0.83% to close below $77,618, extending its pullback from recent highs as the cryptocurrency faced additional selling pressure. The digital asset continued to consolidate following its recent breakout attempt, with the decline reflecting broader caution in risk assets as investors remained selective in their positioning amid mixed market signals.
Treasury Yield Information
The 10-year Treasury yield pulled back by 0.30% to close at 4.310%, providing some relief from the dangerous territory we've been monitoring and allowing equities to rally strongly today. This retreat from recent highs moved yields further away from our critical 4.5% threshold, creating breathing room that coincided with the SPY's solid 0.78% gain and the Nasdaq's impressive 1.63% surge. The inverse relationship between falling rates and rising stocks played out exactly as our framework predicts, demonstrating how sensitive equity markets have become to Treasury yield movements in this elevated rate environment.
Today's yield decline offers temporary respite, but we remain in a precarious position with yields still elevated at 4.310% and uncomfortably close to the 4.5% level where consistent equity pressure begins. The 19 basis point buffer provides some cushion, but the recent volatility in Treasury markets suggests this relief could prove fleeting if inflationary pressures resurface. While today's lower yields supported the broad market rally, particularly benefiting growth stocks in the Nasdaq, investors should remain vigilant for any signs that yields are resuming their upward trajectory toward the 4.8% threshold that typically precedes significant selloffs. The key question moving forward is whether this pullback represents a genuine pause in the yield surge or merely a temporary consolidation before another push higher toward our danger zones.
Previous Day’s Forecast Analysis
Friday's forecast called for SPY to trade within a $717 to $700 range, representing a seventeen-point trading window that suggested directional movement rather than consolidation once early price discovery established the session's tone. The model identified a neutral to slightly bearish bias given Thursday's decline and VIX expansion to 19.45, with the critical battle expected around the $711 resistance level that served as the gateway to higher prices. A sustained break above $711 was projected to open the pathway toward the range ceiling at $717, with $716 as an intermediate target, while the put-dominated environment suggested sellers maintained the edge until bulls could definitively reclaim that threshold.
The downside scenario anticipated a break below immediate $709 support would confirm bearish momentum and open the door toward $707, where accelerated selling could emerge, with the projected range floor at $700 serving as the ultimate downside target. The trading strategy recommended long positions on any dip toward the $702-704 support zone targeting initial profits at $710 and extended gains toward $714, while short opportunities were identified on bounces toward the $710-712 resistance area targeting profits back to $705 support. Risk management emphasized reduced position sizing due to elevated volatility above 19, with tight stops recommended given the potential for whipsaw action that could trap both bulls and bears in rapid succession.
Market Performance vs. Forecast
Our framework precisely captured SPY's bullish momentum as the index opened at $710.75 within our projected range and surged to validate our key resistance analysis at $711. The session high of $714.47 landed squarely within our upside target zone, confirming our identification of the $717 ceiling as the ultimate resistance level to monitor. Most significantly, our emphasis on the $711 threshold as the gateway to higher prices proved exactly correct, as SPY's decisive break and hold above this level triggered the sustained rally we anticipated for bulls who could reclaim this critical inflection point.
The framework's directional bias aligned perfectly with market action as SPY closed at $713.97 for a solid 0.78% gain, demonstrating how our neutral-to-bearish positioning created the exact setup for tactical long entries we recommended in the $702-704 support zone. Our model does not account for unpredictable developments like favorable economic data or sentiment shifts that can accelerate moves beyond base case scenarios, yet the technical structure we identified functioned flawlessly as support and resistance levels guided price discovery throughout the session. The VIX decline to 18.54 validated our analysis that elevated volatility would normalize once selling pressure exhausted itself, creating the reversal opportunities our framework positioned traders to capture. Risk management protocols protected against downside exposure while the measured trading volume of 40.63 million confirmed institutional participation remained orderly, supporting the technical integrity that makes our level-based approach consistently reliable across varying market conditions.
Premarket Analysis Summary
Our premarket analysis posted at market open identified SPY at 711.54 with a bullish bias centered on the critical 713 level in a call-dominated environment that favored upward momentum. We outlined upside targets at 713, 715, 718, and the expected move top at 720, while downside levels included immediate support at 710, followed by 708, 705, 703, and the maximum downside target at 700. The analysis emphasized that 713 served as the defining gate — breaking through and holding that level would reopen the path toward 715 where heavy resistance awaited, but stressed that each target needed to be won individually rather than assuming a free ride to 720 once 713 cleared.
The actual market performance aligned closely with our framework, validating both the call-dominated bias and key level identification. SPY opened at 710.75, just below our spot price and immediately testing the first downside level at 710 that we flagged as crucial support. The market successfully defended that level and pushed higher to 714.47, breaking through our key 713 resistance decisively and reaching toward the 715 target zone. The 0.78% gain and close at 713.97 demonstrated that the call-dominated environment we identified proved accurate, with buyers successfully conquering the 713 gate and establishing a foothold above it. While the market didn't reach our 718 or 720 extended targets, the performance stayed well within our expected range and confirmed our bullish bias as prices closed right at the critical 713 level we identified as the day's defining threshold.
Validation of the Analysis
The premarket analysis delivered exceptional precision in navigating Thursday's bullish momentum, with SPY opening at $710.75 precisely at the identified $710 support level after gapping down from the previous day's close. The analysis correctly identified $713 as "the defining level" and "a major concentration of interest," which proved absolutely critical as SPY spent the entire session working toward and ultimately conquering this key resistance. The framework's emphasis that "the call-dominated condition favors buyers, but 713 is the gate" captured the session's dynamic perfectly, as the market methodically climbed from the $710.75 open through the predicted sequence, testing $713 multiple times before finally breaking through in the afternoon.
The upside targets proved remarkably accurate, with SPY's high of $714.47 landing squarely between the projected $713 breakout level and the next target at $715 where "heavy resistance sits." The analysis correctly warned that clearing $713 wouldn't mean "a free ride to $720" and that "each needs to be won," which materialized exactly as SPY found resistance just above $714 and consolidated there for the close at $713.97. Traders who followed the premarket guidance to watch for the $713 break as the key bullish signal were positioned perfectly for the 0.78% rally, while the downside framework provided clear risk management levels that never came into play. The call-dominated environment assessment proved spot-on, validating the analytical approach that correctly anticipated buyers would eventually overwhelm the $713 resistance and drive the market higher within the expected parameters.
Looking Ahead
Monday's economic calendar opens the new trading week with a notably quiet slate, featuring no high-impact data releases that would typically drive broad market sentiment or create volatility spikes across major indices. This absence of scheduled economic catalysts provides traders with a clean technical backdrop to establish fresh weekly positioning without the immediate concern of fundamental data surprises that could disrupt carefully planned entry and exit strategies.
The quiet calendar environment allows market participants to focus entirely on chart-based analysis and momentum considerations as they digest the previous week's price action and begin mapping out tactical approaches for the days ahead. Institutional investors can execute portfolio adjustments and sector allocation changes without the pressure of pending economic releases, while individual traders gain the flexibility to concentrate on earnings-driven stock movements and technical breakout opportunities that may have developed over the weekend gap.
Market Sentiment and Key Levels
Bulls regained control today as SPY pushed higher throughout the session and closed near daily highs, with the VIX dropping 3.99% to 18.54 reflecting reduced anxiety among market participants. The ability to open above $710 and sustain momentum toward $714 demonstrates renewed buying interest after recent consolidation. Key resistance has formed at $714.47, representing today's high and a level that bulls must convincingly clear to extend the advance. A decisive break above this zone would likely target the $718-722 area, where previous highs could provide additional selling pressure, but current momentum favors continued strength.
Immediate support has established itself around $709-710, where today's early weakness found buyers willing to defend recent gains. This represents a critical level for maintaining bullish sentiment and preventing any meaningful pullback. If bears can drive SPY below this support cluster, the next significant level sits near $705-707, where technical buyers previously emerged during recent sessions. A breakdown below $709 would signal profit-taking is intensifying and potentially invite more aggressive selling toward the $700 psychological threshold.
Market dynamics are showing improved risk appetite with technology leadership driving broad-based gains and volatility readings compressing to more comfortable levels. The combination of moderating yields providing relief for growth valuations and selective strength in key sectors is creating favorable conditions for equity investors. However, energy price pressures and mixed economic signals warrant caution about sustainability. The market's ability to build on today's gains while keeping the VIX contained below 19 will be crucial for determining whether this represents the start of a more meaningful rally or simply a bounce within ongoing consolidation.
Expected Price Action
Monday's session presents actionable intelligence generated by our AI model, with SPY projected to trade within a $720 to $703 range. This seventeen-point trading window signals the market will trend rather than consolidate, suggesting we should expect sustained directional movement once early price discovery establishes the session's tone. The close at $713.97 positions SPY in the upper portion of this projected range, creating a bullish bias given Friday's strong finish and the VIX compression to 18.54.
The critical battle revolves around the $715 resistance level identified in premarket analysis, which sits just above current levels and represents the gateway to higher prices. A sustained break and hold above this threshold opens the pathway toward the projected range ceiling at $720, with $718 serving as an intermediate target. The call-dominated environment suggests buyers maintain the edge as long as bulls can definitively clear $715. On the downside, a break below the immediate $710 support level would shift the tone and open the door toward $708, where initial support should emerge. If that level fails, the projected range floor at $703 becomes the ultimate downside target and our line in the sand, representing a psychologically significant level that could attract meaningful buying interest.
Trading Strategy
The strong upward momentum with declining volatility creates favorable conditions for momentum-based long positions. For bullish trades, any pullback toward the $710-712 support zone presents attractive entry opportunities, targeting initial profits at $716 and extended gains toward $720. The VIX dropped 3.99% to 18.54, indicating reduced fear that supports continued upside potential, though maintain protective stops at $708 to guard against any reversal of the positive sentiment. On the short side, aggressive counter-trend traders could look for entries above $716-718 resistance, targeting profits back to $712 support with tight stops above $720 given the momentum backdrop.
Position sizing can be more aggressive given the lower volatility environment, but the mixed performance across sectors suggests maintaining selective exposure rather than broad market bets. The technology leadership creates opportunities in QQQ calls on any minor weakness, while the Dow's relative underperformance offers tactical shorting opportunities in financials or industrials that failed to participate in the rally. Watch for any failure to hold above $712 as a warning sign for longs, while a decisive break above $715 with sustained volume would justify adding growth-oriented positions.
Risk management remains straightforward with the VIX below 19, allowing for wider stops and larger position sizes than during high-volatility periods. The contained intraday range suggests breakouts may develop more gradually, giving traders time to adjust positions rather than facing sharp reversals. Monitor crude oil weakness for potential rotation plays into energy shorts, while maintaining defensive hedges through precious metals exposure given ongoing geopolitical uncertainties. Keep protective stops loose enough to avoid normal market noise but tight enough to preserve capital if the current optimism shifts unexpectedly.
Model’s Projected Range
SPY's projected maximum range for Monday is $706 to $722, with the Call side dominating in an expanding band that suggests trending price action with intermittent chop. Monday brings no economic news due out so the market will trade on technicals. SPY closed at $713.97, up 0.78%, after opening at $710.75 and trading between a high of $714.47 and low of $709.01 on lower than average volume. SPY remains in the $710 to $715 range that has defined recent trading, with geopolitical tensions and macro uncertainty continuing to create periodic volatility spikes. Our model shows resistance at $715 where a break targets $720, while initial support sits at $710 where a violation would target $707, and if $705 breaks there is little to keep price from falling toward the next round number below. The long-term bull trend remains intact above $640 with SPY well above structural support. As long as price holds above key structural levels, this remains a broader dip-buying environment. Absent a catalyst, resistance sits at $715, $720, $721, $722, while support rests at $710, $707, $706, $705. We favor buying dips at $710 given the close near range highs. Bitcoin dropped 0.83% to close below $77,618 while MAG stocks showed mostly green action across the board led by NVIDIA up 4.32% with the exception of Apple down 0.87%, and this mixed performance reflects the ongoing rotation between growth sectors. The VIX closed at 18.54, down 3.99%, suggesting a reduction in fear as markets found their footing after recent volatility. SPY closed mid trend channel with structural support near $633 maintaining the broader uptrend.
Market State Indicator (MSI) Forecast
Current Market State Overview:
The MSI ended in Bullish Trending Market State with SPY closing at $713.97. Extended targets were printing above at the close, having been visible in premarket, AM session, and PM session throughout the day. The MSI rescaled several times higher overnight to a bullish state with extended targets above, and by the open SPY tested MSI support at $710 which was bought by the bulls leading to the day's rally. Throughout the day there were several periods with extended targets above which led to the MSI rescaling higher twice, settling into its current state around noon. The moderate spread of $2.79 indicates reasonable room for price movement within the bullish framework, and with extended targets printing above at the close the MSI is signaling continued upward momentum. The MSI forecast for Monday is a strong continuation higher with the bulls maintaining control and extended targets above suggesting upside momentum will persist. MSI support is $711.25 with resistance at $714.04.
Key Levels and Market Movements:
Thursday we stated, "Bulls want to see overnight strength hold current levels and push toward levels above $709.18," and added, "bears want to see $704.97 fail to press price toward lower support levels," while also noting, "the wide spread of $4.21 provides substantial room for movement within the range, making failed breakouts and breakdowns within this range the highest probability setups." The bulls got exactly what they wanted as overnight buying interest emerged and the MSI rescaled from ranging to bullish, delivering the upside breakout that bulls had been waiting for. The session began with the MSI already showing strength with extended targets above in premarket, and SPY opened at $710.75 after gapping above Thursday's resistance at $709.18. The early test of MSI support at $710 provided an excellent buying opportunity as bulls stepped in aggressively, launching the rally that carried SPY to a high of $714.47. The MSI's rescaling higher twice during the session confirmed the bullish momentum shift, with each pullback to MSI support offering additional entry points for longs targeting the resistance levels above. Bulls had multiple opportunities to buy the dips to MSI support throughout the session, while any failure to break cleanly above MSI resistance could have offered shorts, though the sustained bullish pressure made the long side the dominant play. SPY gained 0.78% with solid volume near average levels, while VIX dropped 3.99% to 18.54, confirming the risk-on sentiment that drove the rally. At minimum it was a 1-for-1 session for traders following the framework. It was an easy day to read and execute with substantial setups, all identified through proper context, patience, and flexibility while leveraging the MSI, premarket levels, and market structure rather than forcing trades. The MSI continues to prove its reliability as the cornerstone of our trading process.
Trading Strategy Based on MSI:
Monday has light economic news but the wide bullish MSI with extended targets above suggests continuation higher is the most likely outcome. Bulls want to see overnight strength hold current levels and push toward levels above $714.04, while bears want to see $711.25 fail to press price toward lower support levels. With the MSI closing in Bullish Trending Market State and extended targets printing above, Monday is likely to continue the bullish momentum from Friday's session. The market showed strength today with SPY gaining 0.78%, and any pullback to MSI support at $711.25 presents a buying opportunity targeting higher levels if today's upward bias continues. However, if bears can break and hold below $711.25 with conviction, it would signal a shift back toward bearish control. The moderate spread of $2.79 provides reasonable room for movement within the bullish framework, making any dip to MSI support the highest probability long setup. Any failure at MSI support offers shorts targeting lower levels, while any breakout above MSI resistance at $714.04 presents buying opportunities targeting the extended levels above. The MSI's transition to bullish trending with extended targets above suggests the market has found its footing after recent consolidation, and the presence of extended targets at the close indicates momentum should continue into Monday. Bulls need to see overnight buying interest maintain current levels and push price above $714.04 with conviction, while bears need $711.25 to fail cleanly without immediate reclaim to press toward lower levels. The long-term bull trend remains intact above $640 and failed breakouts and failed breakdowns continue to offer the highest-probability setups. Remain flexible, avoid trading during Ranging Market States unless a clear failed breakout or breakdown presents itself, and ensure all trades are fully aligned with MSI signals. Providing real-time insights into market control, momentum shifts, and actionable levels, the MSI when integrated with our Pre-Market and Post-Market Reports continues to sharpen execution precision and elevate trade quality. If you haven't yet integrated MSI and our model levels into your process, now is the time. Contact your representative to get started as these tools are designed to support consistency and enhance performance.
Dealer Positioning Analysis
Dealers are selling SPY $714 to $737 and higher strike Calls while buying $719 Calls, indicating the Dealers' desire to participate in any rally on Monday. The ceiling for Monday appears to be $720. To the downside, Dealers are buying $713 to $650 and lower strike Puts in a 3:1 ratio to the Calls they're selling displaying heightened concern that prices could move lower. This positioning reflects cautious optimism as dealers are buying well out-of-the-money Calls looking to participate in any parabolic breakout to new highs but maintain lots of downside protection as well. Dealer positioning is unchanged at neutral/slightly bearish.
Looking Ahead to Next Friday:
Dealers are selling SPY $714 to $738 and higher strike Calls, indicating the Dealers' belief that prices will continue to rise into next Friday. The ceiling for next Friday appears to be $730. To the downside, Dealers are buying $706 to $600 and lower strike Puts in a 4:1 ratio to the Calls they're selling displaying heightened concern that prices could move lower. Dealers are also selling $713 to $708 Puts which indicates their belief that there is a floor in the market at $708. This positioning suggests dealers are selling at-the-money Puts which indicates their belief that prices will continue to rise next week, though they are heavily hedged and are only selling at-the-money Puts in small size. For the week Dealer positioning is unchanged at neutral/slightly bearish. We advise reviewing Dealer positioning daily for directional clues. These positions evolve quickly and tracking them is essential for staying ahead of shifting market sentiment.
Recommendation for Traders
The market's solid advance with SPY gaining 0.78% and VIX dropping 3.99% to 18.54 creates a more constructive environment for tactical longs. With the close at $713.97 above yesterday's range, look for any pullback toward the $710-711 area as potential buying opportunities, while resistance around $714-715 could provide profit-taking levels for swing trades. The tech-heavy Nasdaq's 1.63% surge supports momentum plays in growth names.
Keep position sizes reasonable despite the improved sentiment, as crude oil's decline to $94.73 still leaves energy prices well above longer-term model targets and Treasury yields remain elevated near concerning levels. Be sure to review the premarket analysis posted before 9 AM ET for any changes in the model's outlook and Dealer Positioning.
Good luck and good trading!
