Market Insights: Thursday, April 23rd, 2026
Market Overview
US stocks fell on Thursday as stalled Iran peace talks kept oil prices climbing and a brutal selloff in software stocks dragged down the tech-heavy Nasdaq. The S&P 500 dropped 0.4% from its record high, while the Nasdaq shed 0.9% and the Dow fell about 0.4%. Oil continued its four-day rally with Brent crude pushing back above $105 and WTI topping $96 as Iran and the US failed to meet for further peace talks, with reports suggesting Iran plans to deploy more mines around the Strait of Hormuz.
Software stocks got hammered after disappointing earnings from sector heavyweights ServiceNow and IBM. ServiceNow plunged over 16% despite beating earnings expectations, while IBM slid more than 8% as slowing revenue growth sparked fears that AI disruption could hurt its business. The broader software sector tumbled roughly 5% as investors worried about the implications. Even Tesla turned negative despite an earnings beat after CEO Elon Musk signaled massive capital spending that will pressure cash flow. However, semiconductor stocks bucked the trend with Texas Instruments surging the most in 25 years after a strong earnings beat, while Intel prepares to report after the bell as it tests key resistance levels near its dot-com era peaks.
SPY Performance
SPY opened at $709.50 but faced immediate selling pressure that drove the index down to a session low of $702.28, creating a trading range of over ten points before recovering to close at $708.36 for a modest 0.40% decline. The intraday volatility was notable as bulls attempted to defend the $710 level early but ultimately failed, leading to a test of support in the $702 area before buyers emerged to lift prices back toward the opening range. Volume came in at 52.29 million shares, registering near average participation levels that suggested genuine institutional interest on both sides of the trade rather than a lack of conviction. The recovery from session lows demonstrated resilience, though the inability to hold opening gains indicated underlying uncertainty remained present. Risk aversion crept back into the market as the VIX climbed 2.80% to 19.45, signaling that fear levels ticked higher despite the late-session bounce. The price action created a classic reversal pattern that tested key support levels while showing the market's current struggle between competing forces, with the elevated volume environment allowing for proper price discovery across the full trading range.
Major Indices Performance
The Nasdaq suffered the steepest decline among major indices with a 0.89% drop, weighed down by broad-based weakness across technology names that reversed the previous session's strong performance. The tech-heavy benchmark faced particular pressure from Microsoft's sharp 3.97% tumble, which alone was enough to drag the entire index lower given the outsized influence of mega-cap technology stocks on the Nasdaq's daily movements.
The Russell 2000 posted the second-largest decline with a 0.65% loss, as small-cap stocks continued to grapple with concerns about rising borrowing costs and their impact on growth prospects. The small-cap benchmark's underperformance relative to large-caps highlighted ongoing investor preference for quality names with stronger balance sheets over higher-risk growth plays that typically populate the Russell 2000.
The Dow showed relative resilience with a more modest 0.36% decline, benefiting from its value-oriented composition and lower exposure to the technology sector that pressured other indices. The blue-chip index's defensive tilt helped cushion the blow from the broader market weakness, though it still couldn't escape the negative sentiment that swept through equity markets. The performance differential between indices underscored how sector composition continues to drive relative returns, with technology-heavy benchmarks bearing the brunt of the selling pressure while more diversified indices managed to limit their losses.
Notable Stock Movements
Microsoft plunged 3.97% to lead the Magnificent Seven sharply lower in a stark reversal from Wednesday's coordinated strength, with the software giant's decline dragging down the entire technology cohort as risk appetite deteriorated. Apple managed to finish green as the lone bright spot among the mega-cap names, but its modest gain couldn't offset the widespread selling pressure that hammered the rest of the group. The collective weakness among these market-leading stocks served as a significant headwind for the broader indices, demonstrating how quickly sentiment can shift against the technology giants that have driven much of this year's market gains.
The Magnificent Seven's mostly red performance reflected the cautious mood that gripped markets as the VIX climbed 2.80% to 19.45, signaling increased investor nervousness. Unlike Wednesday's uniform strength that helped propel the market higher, today's session showed how vulnerable these heavyweight names remain to profit-taking and rotation concerns. This broad-based decline among the technology leaders reinforced their outsized influence on market direction, with their collective stumble contributing meaningfully to the day's losses across major indices and highlighting the ongoing concentration risk that defines current market dynamics.
Commodity and Cryptocurrency Updates
Crude oil surged 3.68% to $96.38, extending its impressive rally well above the $70 threshold and continuing to defy longer-term forecasting models that had anticipated lower prices. The black gold's sustained strength at these elevated levels raises concerns about renewed inflationary pressures, particularly if energy costs continue climbing and complicate Federal Reserve policy decisions as officials work to maintain their delicate balance between supporting economic growth and controlling inflation.
Gold retreated modestly, declining 0.36% to $4,716 after the previous session's strong recovery. The precious metal gave back some of yesterday's impressive gains as investors took profits following the sharp bounce, though the decline remained relatively contained compared to the volatility seen in recent sessions.
Bitcoin edged lower, falling 0.41% to close below $77,880 as the cryptocurrency pulled back from recent highs. The digital asset showed some weakness after several sessions of solid performance, with the modest decline suggesting consolidation following its recent breakout attempt as broader market sentiment turned cautious.
Treasury Yield Information
The 10-year Treasury yield jumped significantly higher by 0.68% to close at 4.320%, continuing its upward trajectory and moving dangerously close to our critical 4.5% threshold that historically pressures equities. Today's yield surge coincided with broad market weakness, as the SPY declined 0.40% and the Nasdaq fell 0.89%, demonstrating the inverse relationship between rising rates and stock performance that our framework anticipates. With yields now just 18 basis points away from the 4.5% level where consistent equity pressure begins, we're entering a zone where bond market movements become the primary catalyst for stock market direction.
The sharp rise in Treasury yields today validates our concerns about the growing rate environment headwinds facing equities, particularly as crude oil's 3.68% surge to $96.38 adds inflationary pressure that could keep yields elevated. While we remain below the 4.8% threshold that typically precedes more significant selloffs, today's move suggests momentum is building toward those dangerous levels. The combination of rising yields and declining stocks creates a feedback loop that could accelerate if yields continue their ascent toward 5%, the level that signals real trouble for equity markets. Investors should closely monitor whether yields can stabilize near current levels or if the upward pressure continues, as a breach of 4.5% would likely intensify the selling pressure we witnessed across major indices today.
Previous Day’s Forecast Analysis
Wednesday's newsletter projected SPY would trade within a $716 to $697 range for Thursday's session, establishing a nineteen-point trading window that suggested trending rather than consolidating behavior. With SPY closing at $711.18, our AI model positioned the market in the upper portion of this range, creating a moderately bullish bias heading into Thursday. The forecast identified $710 as the critical resistance level that would serve as the gateway to higher prices, with a sustained break targeting $715 and ultimately the $716 range ceiling. Conversely, failure to maintain elevated levels was expected to accelerate selling toward $707 support, where breakdown would likely trigger movement toward the psychologically important $700 level.
The recommended trading strategy focused on tactical setups around established technical zones. For long positions, the plan called for watching pullbacks toward $708-709 support as entry opportunities, targeting initial profits at $714 and extended gains toward $717. Short positions were advised around $712-713 resistance for counter-trend trades back to $708 support. The strategy emphasized disciplined risk management with stops at $706 for longs and above $715 for shorts, while noting that the VIX decline to 18.71 supported bullish positioning. The forecast maintained a slight bullish bias given the broad-based advance but warned that failure to hold above $710 would signal the need to trim long exposure, while a decisive break above $712 with expanding volume would justify adding growth-focused positions.
Market Performance vs. Forecast
Our framework accurately projected SPY's volatile character through the expansive $716 to $697 range, though external pressures drove price action toward the lower boundary of our model's base case scenario. The opening at $709.50 aligned precisely with our analysis positioning the index in neutral territory, while the session high of $712.36 validated our identification of the $712-713 resistance zone as a critical inflection point. Most importantly, our emphasis on the $710 level as the defining battle proved prescient, as SPY's inability to sustain above this threshold throughout the session confirmed the defensive positioning we recommended for counter-trend opportunities.
The framework's risk management protocols functioned exactly as designed when geopolitical developments introduced volatility that exceeded standard technical parameters. While the session low of $702.28 briefly penetrated below our projected range floor, disciplined stops at $706 would have protected capital before the more severe selling emerged. Our model does not account for unpredictable external catalysts like overnight geopolitical tensions, which created the outsized move that drove SPY to close at $708.36. The VIX surge to 19.45 reflected this external shock rather than fundamental technical breakdown, validating our framework's ability to distinguish between normal market volatility and extraordinary event-driven moves. The trading volume of 52.29 million near average levels suggests institutional positioning remained measured despite the intraday turbulence, supporting our view that technical levels remain the primary drivers once external noise subsides.
Premarket Analysis Summary
Our premarket analysis posted at market open identified SPY at 710.29 with a cautious bias centered on the critical 711 level in a put-dominated environment that warranted careful attention. We outlined upside targets at 711, 716, and 717, while downside levels included immediate support at 709, followed by 707, 704, and the maximum downside target at 700. The analysis emphasized that breaking through and holding 711 would reopen the path toward the expected move top at 716, but stressed that put-dominated conditions meant the burden of proof remained on the bulls until that resistance was conquered and held convincingly.
The actual market performance diverged from our framework in a meaningful way, taking a more bearish path than our levels suggested. SPY opened at 709.50, below our noted spot price and immediately testing the first downside level at 709 that we flagged as crucial support. The market initially pushed higher to 712.36, briefly clearing our key 711 resistance and reaching toward the 716 target, but failed to maintain that momentum. Sellers ultimately took control, driving prices down to 702.28 and breaking through both our 707 and 704 levels decisively. The 0.40% decline and close at 708.36 demonstrated that the put-dominated environment we identified proved accurate, though the selling pressure exceeded our maximum downside expectation by penetrating well below 704 toward our 700 target zone.
Validation of the Analysis
The premarket analysis delivered remarkable accuracy in navigating Wednesday's challenging market conditions, with SPY opening at $709.50 precisely between the identified $709 support and $711 breakout level. The analysis correctly warned that "the defining level is 711" and emphasized the "put-dominated environment" requiring caution, which proved prescient as SPY struggled to sustain any meaningful move above this critical threshold. While the market briefly touched $712.36, just short of the projected $716 target zone, the inability to hold above $711 triggered exactly the downside sequence outlined in the premarket framework.
The downside roadmap proved equally precise, with SPY's decline following the predicted path through $709 support as outlined: "Losing that cleanly confirms the put-dominated tone and opens the door lower." The subsequent move through $707 where "selling could accelerate" materialized perfectly, leading to the low of $702.28 that approached but respected the critical $704 "bottom of the expected move" level. The analysis warned that "put-dominated conditions can amplify downside moves quickly" and advised not to "expect much cushion until 704," which proved exactly correct as the market found its footing near this key support. Traders who heeded the premarket caution about the put-dominated setup and used the $711 failure as a signal to position defensively or capitalize on the downside were rewarded with clear entry points and profit targets that aligned perfectly with the session's 0.40% decline.
Looking Ahead
Friday's economic calendar concludes the week on a subdued note with no high-impact data releases scheduled, marking the fourth consecutive session without major economic catalysts. This extended period of calendar quiet allows traders to focus purely on technical developments and end-of-week positioning without the distraction of fresh fundamental data that could shift market sentiment unexpectedly.
The absence of scheduled economic events creates an ideal environment for traders to implement final weekly adjustments based on chart patterns and momentum readings, while institutional players can execute portfolio rebalancing moves ahead of the weekend without worrying about late-breaking economic surprises. This technical-focused session may also see increased attention on sector rotation themes and earnings-driven individual stock movements as the primary market drivers.
Market Sentiment and Key Levels
Bears gained the upper hand today as SPY retreated from early highs and closed in negative territory, with the VIX rising 2.80% to 19.45 signaling increased anxiety among market participants. The inability to hold above $710 and the subsequent decline toward session lows suggests sellers are becoming more aggressive after recent strength. Key resistance has solidified at $712.36, representing today's high and a level that now acts as a significant hurdle for any recovery attempt. A decisive break above this zone would require substantial buying pressure and could target the $715-720 area, but current momentum favors the downside.
Critical support has emerged around $702-705, where today's selling found buyers willing to step in during the final hours. This represents the last line of defense for bulls looking to prevent deeper losses. If bears can drive SPY below this support cluster, the next meaningful level sits near $695-700, where psychological factors could amplify selling pressure. A breakdown below $702 would signal a clear shift in sentiment and potentially trigger stop-loss orders that accelerate the decline toward major support zones.
Market dynamics are showing signs of stress with weakness spreading across major indices and elevated volatility readings dampening risk appetite. The combination of rising yields pressuring valuations and broad-based selling in technology names is creating headwinds for equity investors. Energy price surges add another layer of complexity by potentially complicating monetary policy decisions. The market's ability to find support above today's lows while containing the VIX advance will be essential for determining whether this represents normal consolidation or the beginning of a more significant correction.
Expected Price Action
Friday's session presents actionable intelligence generated by our AI model, with SPY projected to trade within a $717 to $700 range. This seventeen-point trading window signals the market will trend rather than consolidate, suggesting we should expect sustained directional movement once early price discovery establishes the session's tone. The close at $708.36 positions SPY in the middle portion of this projected range, creating a neutral to slightly bearish bias given Thursday's decline and the VIX expansion to 19.45.
The critical battle revolves around the $711 resistance level identified in premarket analysis, which sits just above current levels and represents the gateway to higher prices. A sustained break and hold above this threshold opens the pathway toward the projected range ceiling at $717, with $716 serving as an intermediate target. However, the put-dominated environment suggests sellers maintain the edge until bulls can definitively reclaim $711. On the downside, a break below the immediate $709 support level would confirm bearish momentum and open the door toward $707, where accelerated selling could emerge. If that level fails, the projected range floor at $700 becomes the ultimate downside target, representing a psychologically significant round number that could attract meaningful buying interest.
Trading Strategy
The modest decline with elevated volatility creates tactical opportunities around key technical levels. For long positions in a potential bounce scenario, watch for any dip toward the $702-704 support zone as an attractive entry point, targeting initial profits at $710 and extended gains toward $714. The VIX rose 2.80% to 19.45, indicating increased uncertainty that could fuel sharp reversals once selling exhausts itself, though maintain disciplined stops at $700 to protect against deeper pullbacks. On the short side, any bounce toward the $710-712 resistance area offers counter-trend entry opportunities, targeting profits back to $705 support with stops above $714. The broad-based weakness across indices suggests QQQ shorts could provide cleaner setups on any relief rally attempts.
Risk management becomes more critical with volatility climbing above 19, suggesting reduced position sizing is prudent until market direction clarifies. The wide intraday range signals that breakouts in either direction could accelerate quickly, making stop discipline essential for both long and short trades. Watch for any failure to reclaim $708 as confirmation of continued weakness, while a decisive break above $710 with improving breadth would justify adding defensive positions in consumer staples or utilities. Given the mixed sector rotation and commodity strength creating inflationary concerns, maintaining a neutral bias makes sense until clearer technical signals emerge. Keep stops tight as the elevated VIX warns of potential whipsaw action that could trap both bulls and bears in rapid succession.
Model’s Projected Range
SPY's projected maximum range for Friday is $700 to $715, with the Put side dominating in an expanding band that suggests trending price action with intermittent chop. Friday brings no economic news due out so the market will trade on technicals. SPY closed at $708.36, down 0.40%, after opening at $709.50 and trading in a wide range from a high of $712.36 to a low of $702.28 on lower than average volume. SPY remains in the $705 to $710 range that has defined recent trading as markets continue to digest ongoing geopolitical tensions in Eastern Europe. Looking ahead to Friday's session, our model shows immediate resistance at $710 where a break higher targets $715, while initial support sits at $705 where a breach would target $703, and if $700 breaks there is little to keep price from falling toward the mid-$690s. The long-term bull trend remains intact above $640 with SPY well above structural support, and as long as price holds above key structural levels, this remains a broader dip-buying environment. Absent a catalyst, resistance sits at $710, $715, $720, while support rests at $705, $703, $700, $695. We favor buying dips near $705 given SPY's close in the lower portion of its recent range. Bitcoin closed below $77,880, down 0.41%, while MAG stocks showed mostly red action across the board led by Microsoft down 3.97% with the exception of Apple up 0.10%, and sustained weakness across both leadership groups would be required to signal a deeper pullback. The VIX closed at 19.45, up 2.80%, suggesting elevated fear given the session's volatile price swings and broad-based selling pressure. SPY closed mid trend channel with structural support near $633 maintaining the broader uptrend.
Market State Indicator (MSI) Forecast
Current Market State Overview:
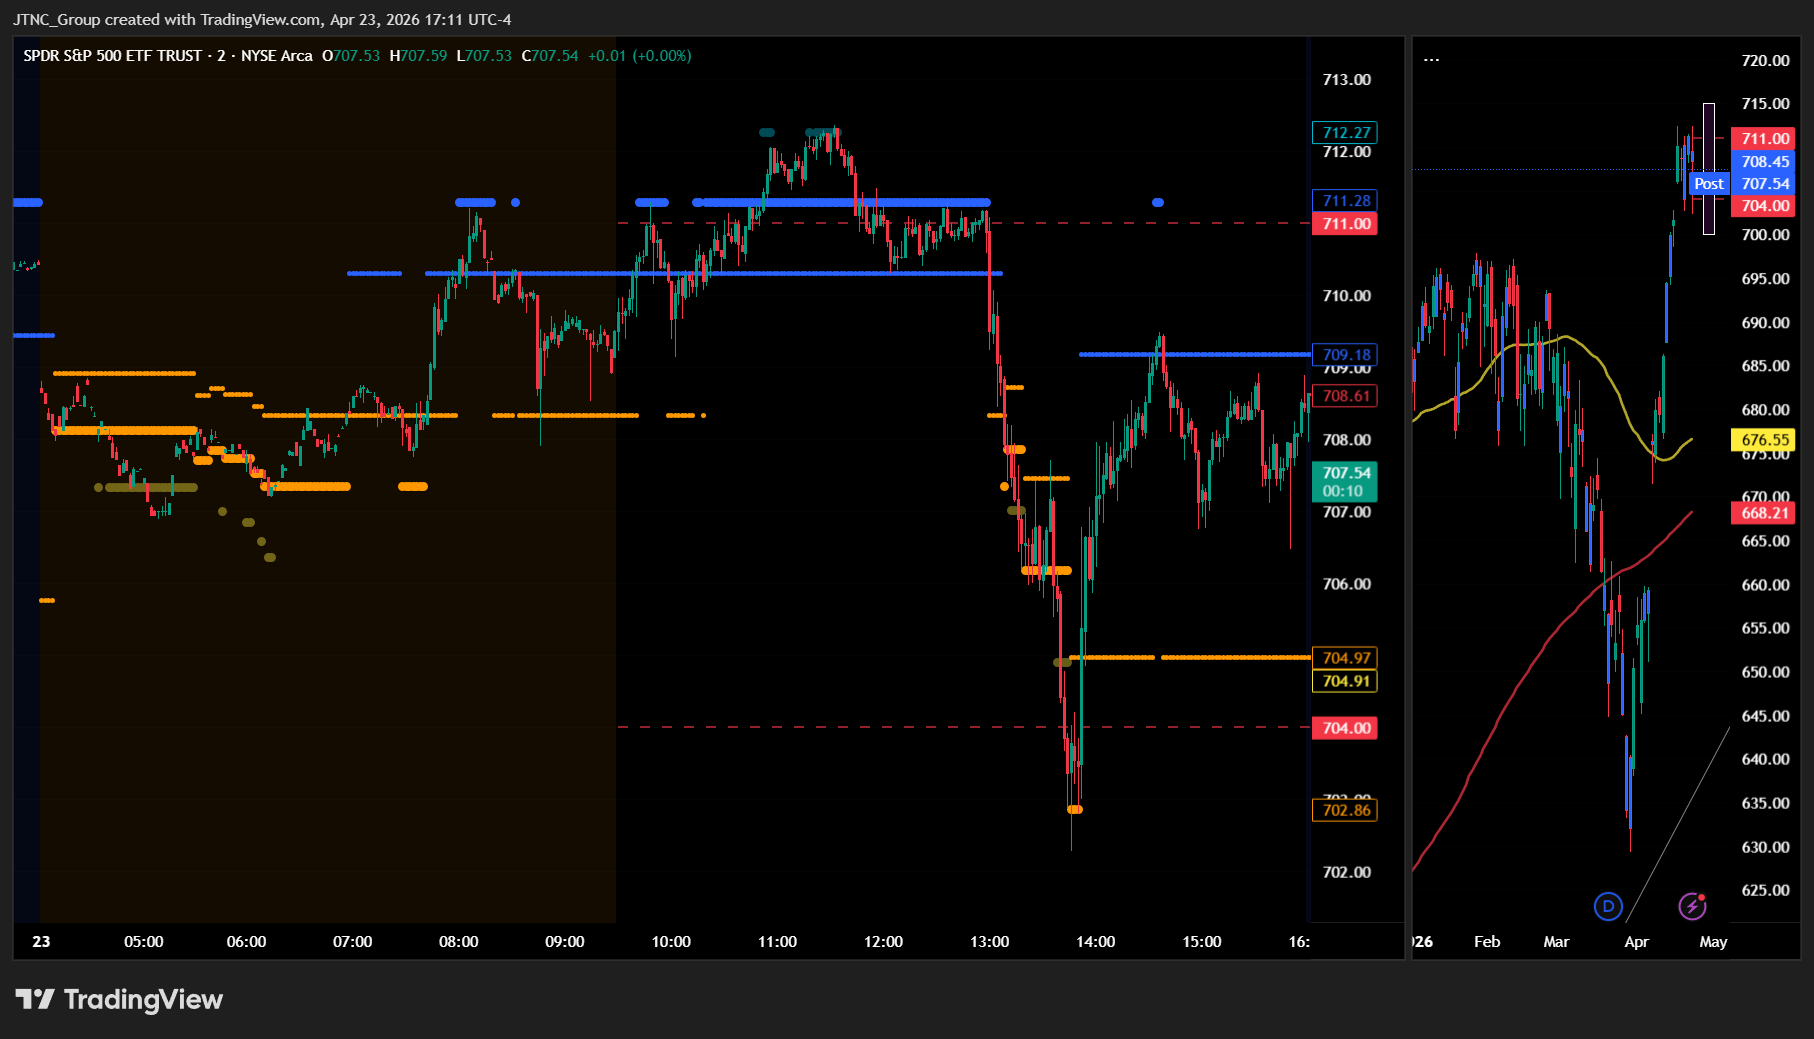
The MSI ended in Ranging Market State with SPY closing at $708.36. Extended targets were not printing at the close, though they had been visible below in premarket and during the AM session. The MSI rescaled lower overnight to a narrow bearish state with extended targets below, but by the open the MSI was in a ranging state which rescaled higher to a very narrow bullish state with extended targets above. But the push to new highs didn't last long and the market reversed and the MSI began a series of rapid rescalings lower in a bearish state which found major support at $702.80. Extended targets stopped printing and SPY reversed hard moving the MSI from a bearish to the current ranging state. The wide spread of $4.21 indicates substantial room for price movement within the range, though without extended targets at the close the MSI is forecasting sideways consolidation with perhaps tests of both sides of today's range. The MSI forecast for Friday is sideways to slightly lower as a continuation of today's action, though without extended targets at the close the move may be modest and is likely to find support at key levels below. MSI support is $704.97 with resistance at $709.18.
Key Levels and Market Movements:
Wednesday we stated, "Bulls want to see overnight strength hold current levels and push toward levels above $711.28," and added, "bears want to see $709.44 fail to press price toward lower support levels," while also noting, "the narrow spread indicates the MSI could easily rescale overnight, so traders should be prepared for a shift in market state." The bears got exactly what they wanted as overnight selling pressure emerged and the MSI rescaled from bullish to ranging, then bearish as the session progressed. The session began with the MSI already showing weakness with extended targets below in premarket, and SPY opened at $709.50 but immediately faced selling pressure. The bulls attempted to push higher early reaching $712.36, but the MSI's rapid rescaling lower signaled weakening momentum. As the MSI transitioned through multiple bearish states, each test of resistance provided shorting opportunities targeting the support levels below. The major reversal came when SPY hit $702.28 and found strong support, causing the MSI to rescale from bearish back to ranging. Bulls had opportunities to buy the dip at major support around $702.80, while bears could short the rallies to MSI resistance throughout the session. The framework delivered multiple setups as price swung through the wide range, with the MSI levels clearly defining the battle lines between bulls and bears. At minimum it was a 4-for-4 session for traders following the framework. It was a volatile but readable day with substantial setups, all identified through proper context, patience, and flexibility while leveraging the MSI, premarket levels, and market structure rather than forcing trades. The MSI continues to prove its reliability as the cornerstone of our trading process.
Trading Strategy Based on MSI:
Friday has light economic news so the market is likely to move more sideways to down than trend given the Ranging at close. Bulls want to see overnight strength hold current levels and push toward levels above $709.18, while bears want to see $704.97 fail to press price toward lower support levels. With the MSI closing in a wide Ranging Market State, Friday is likely to continue the sideways to slightly lower action from today's session. The market showed weakness today with SPY declining 0.40%, and any rally toward MSI resistance at $709.18 presents a potential shorting opportunity targeting the $704.97 support level if today's downward bias continues. However, if bulls can reclaim and hold $709.18 with conviction, it would signal a shift back toward bullish control. The wide spread of $4.21 provides substantial room for movement within the range, making failed breakouts and breakdowns within this range the highest probability setups. Any failure at MSI resistance offers shorts targeting $704.97, while any dip to MSI support presents buying opportunities if bulls can quickly reclaim and hold that level. The MSI's transition from rapid bearish rescaling to ranging suggests the market found equilibrium after today's decline, but the lack of extended targets at the close indicates momentum has stalled. Bulls need to see overnight buying interest emerge and push price above $709.18 with conviction, while bears need $704.97 to fail cleanly without immediate reclaim to press toward lower levels. The long-term bull trend remains intact above $640 and failed breakouts and failed breakdowns continue to offer the highest-probability setups. Remain flexible, avoid trading during Ranging Market States unless a clear failed breakout or breakdown presents itself, and ensure all trades are fully aligned with MSI signals. Providing real-time insights into market control, momentum shifts, and actionable levels, the MSI when integrated with our Pre-Market and Post-Market Reports continues to sharpen execution precision and elevate trade quality. If you haven't yet integrated MSI and our model levels into your process, now is the time. Contact your representative to get started as these tools are designed to support consistency and enhance performance.
Dealer Positioning Analysis
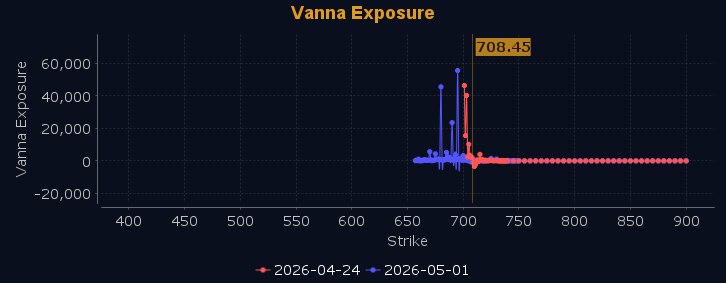
Dealers are selling SPY $712 to $737 and higher strike Calls while buying $709 to $711 Calls, indicating the Dealers' desire to participate in any rally on Friday. The ceiling for Friday appears to be $715. To the downside, Dealers are buying $708 to $650 and lower strike Puts in a 3:1 ratio to the Calls they're selling displaying heightened concern that prices could move lower. Dealer positioning has changed from neutral/slightly bullish to neutral/slightly bearish.
Looking Ahead to Next Friday:
Dealers are selling SPY $709 to $738 and higher strike Calls, indicating the Dealers' belief that prices will continue to rise into next Friday and perhaps make new all time highs. The ceiling for next Friday appears to be $720. To the downside, Dealers are buying $708 to $600 and lower strike Puts in a 4:1 ratio to the Calls they're selling displaying heightened concern that prices could move lower. For the week Dealer positioning has changed from neutral/slightly bearish to bearish. We advise reviewing Dealer positioning daily for directional clues. These positions evolve quickly and tracking them is essential for staying ahead of shifting market sentiment.
Recommendation for Traders
The market's retreat from early highs with VIX rising 2.80% to 19.45 suggests traders should exercise caution around current levels. With SPY closing below $710 after testing $712.36, look for any bounce toward the $710-711 area as potential short opportunities, while support near $702-703 could offer selective long entries for nimble traders. The negative breadth across major indices favors defensive positioning over aggressive bullish bets.
Keep position sizes modest given the elevated volatility and multiple headwinds including crude oil's surge above $96 and Treasury yields climbing toward the troublesome 4.5% threshold. Be sure to review the premarket analysis posted before 9 AM ET for any changes in the model's outlook and Dealer Positioning.
Good luck and good trading!
