Market Insights: Tuesday, April 21st, 2026
Market Overview
US stocks stumbled on Tuesday as geopolitical tensions escalated and investors digested comments from Fed chair nominee Kevin Warsh during his confirmation hearing. The Dow Jones, S&P 500, and Nasdaq all declined 0.6% as afternoon trading brought additional selling pressure after reports that the US suspended Vice President JD Vance's planned trip to Pakistan, effectively putting peace negotiations with Iran on hold. The temporary ceasefire between the US and Iran is set to expire late Wednesday, adding uncertainty to an already tense situation.
Warsh's testimony proved significant for markets as he pushed back against suggestions he would be Trump's "sock puppet," stating "absolutely not" when pressed on whether he'd simply follow presidential directives on monetary policy. This independence signal sent Treasury yields higher and added pressure to equities. Meanwhile, Apple faced a major leadership transition with longtime CEO Tim Cook stepping down to hand over the reins to hardware engineering head John Ternus. Oil prices surged roughly 4.5% on the geopolitical developments, with Brent crude trading around $94.50 per barrel and WTI near $91.30, raising inflation concerns that could keep Fed rates elevated longer.
The commodity complex saw mixed action as gold fell as much as 2% amid dollar strength and rising oil prices, while silver also deepened losses on the escalating tensions. Precious metals faced additional pressure from Warsh's hawkish stance, as non-yielding assets become less attractive in higher-rate environments. United Airlines results after the bell were closely watched for insights into how war-related fuel cost increases might impact airline profitability, while Meta made headlines for plans to track employee computer activity to train AI models.
SPY Performance
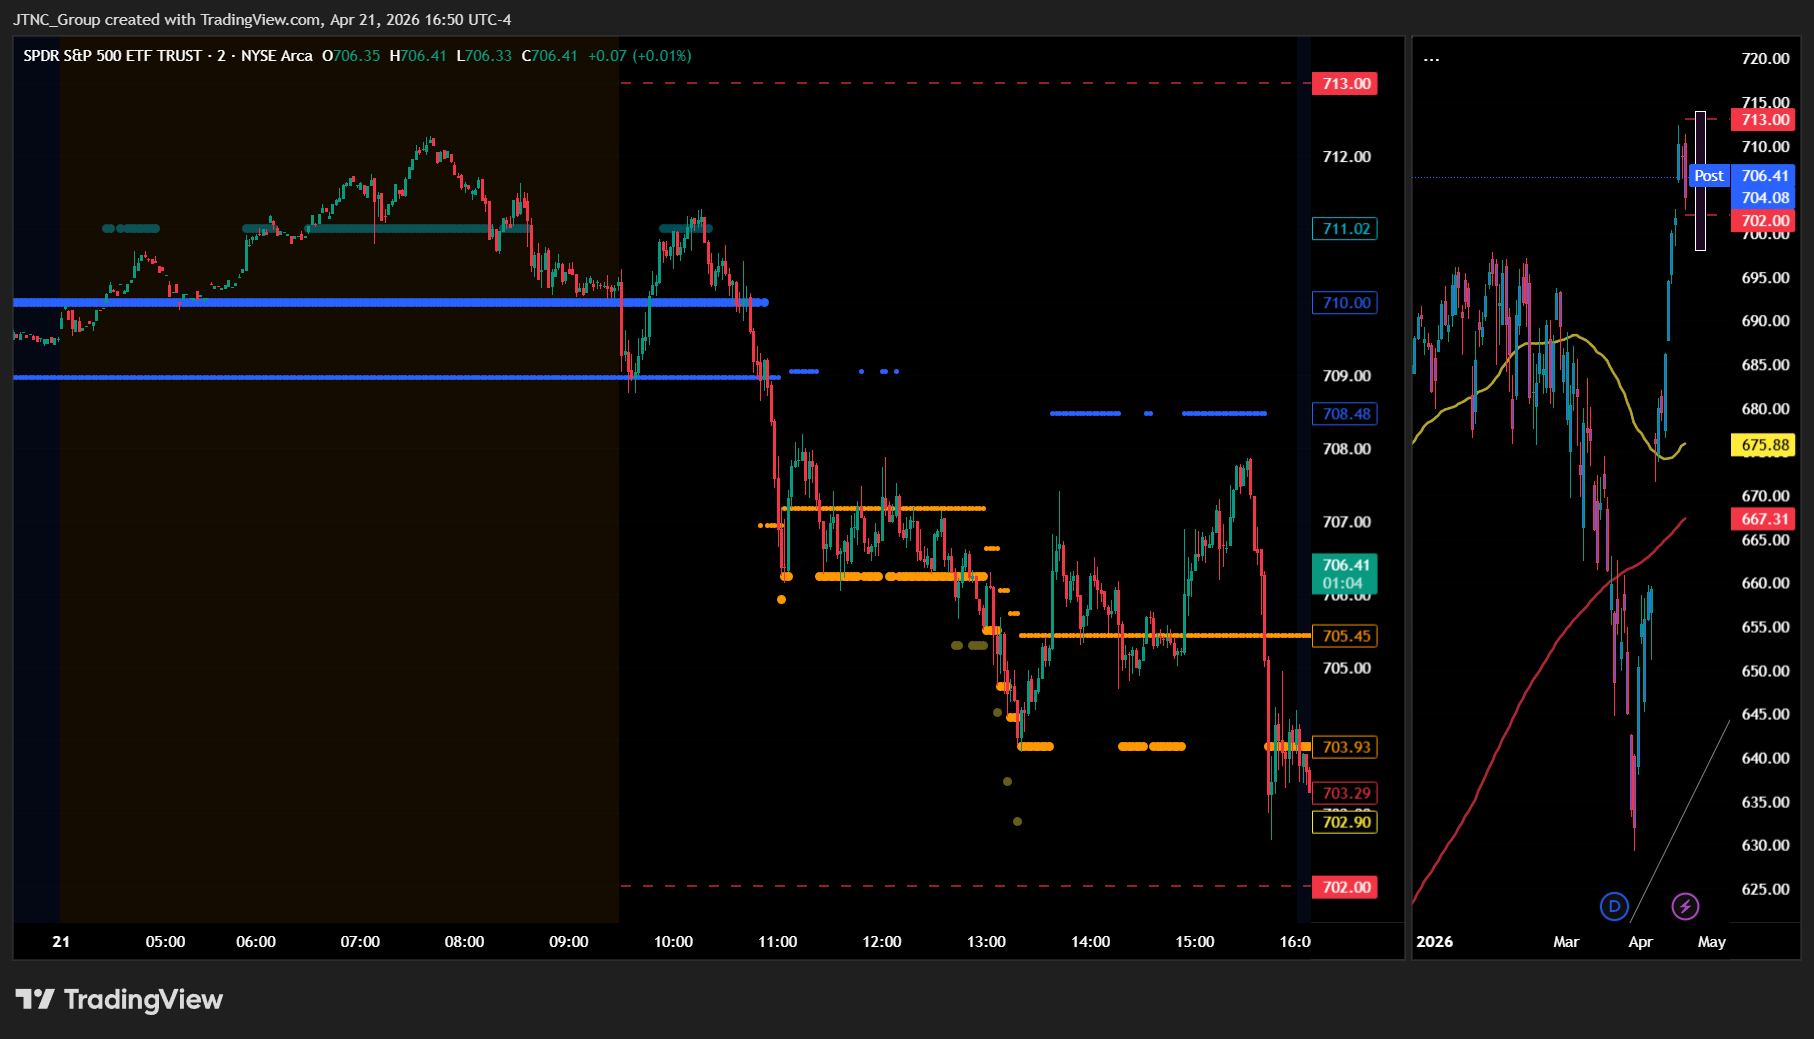
SPY opened at $710.28 and immediately faced selling pressure that intensified throughout the session, ultimately closing at $704.15 for a 0.64% decline. The trading range spanned nearly nine points from the high of $711.28 to the low of $702.64, with bears taking control after the early morning peak. Volume came in at 51.36 million shares, right around average levels, suggesting institutional participation rather than retail-driven moves. The persistent selling created a clear downward trajectory that broke through several technical support levels during the afternoon session. Risk-off sentiment dominated as evidenced by the VIX surging 7.84% to 20.35, signaling increased fear and uncertainty among market participants. The combination of steady selling pressure and elevated volatility readings painted a picture of institutional repositioning ahead of key market events, with traders clearly favoring defensive positioning over risk-taking in the current environment.
Major Indices Performance
The Dow and Nasdaq finished in a virtual tie for the day's best performance among major indices, with both declining 0.59% in synchronized selling pressure. The matching declines reflected broad-based weakness across large-cap names, particularly within technology where Apple's substantial retreat weighed heavily on both indices. The Russell 2000 suffered the steepest losses, falling 1.03% as small-cap stocks bore the brunt of risk-off sentiment that intensified throughout the session.
The parallel performance between the Dow and Nasdaq suggested investors were rotating out of both value-oriented blue chips and growth-heavy technology names simultaneously, indicating concerns that transcended sector-specific issues. Small-cap weakness in the Russell 2000 typically signals broader economic uncertainty, as these companies are more sensitive to domestic conditions and often struggle more during periods of elevated borrowing costs. The heavier selling pressure in smaller companies compared to their large-cap counterparts reinforced the cautious tone that dominated trading across all major equity benchmarks.
Notable Stock Movements
Apple led the Magnificent Seven lower with a sharp 2.52% decline, dragging the tech giants into mostly negative territory during Tuesday's session. The iPhone maker's outsized drop weighed heavily on the group's collective performance, reinforcing concerns about growth momentum among the market's most influential names. Microsoft and Amazon managed to buck the trend by finishing in positive territory, but their gains weren't enough to offset the broader weakness that swept through the remaining mega-cap technology stocks.
The mixed performance within the Magnificent Seven reflected the cautious sentiment that permeated markets as investors grappled with rising Treasury yields and elevated volatility. With the VIX climbing to 20.35, the divergent moves among these heavyweight stocks underscored the selective nature of recent trading, where even minor fundamental concerns can trigger significant price swings in names that have driven much of this year's market gains. The group's lackluster showing contributed to the broader market's subdued performance, highlighting how dependent major indices remain on the continued strength of these technology behemoths.
Commodity and Cryptocurrency Updates
Crude oil surged 2.71% to $92.04, rallying well above recent expectations as the commodity has defied longer-term forecasting models. The move above $70 represents a significant shift from previous projections, with geopolitical tensions and supply concerns likely driving the sustained rally. If energy prices continue contributing to inflationary pressures at these elevated levels, it could complicate Federal Reserve policy decisions moving forward.
Gold retreated sharply, declining 2.18% to $4,702 as the precious metal gave back recent gains amid shifting market dynamics. The pullback comes after gold's recent run higher, suggesting investors may be taking profits or repositioning ahead of key economic data releases.
Bitcoin slipped 0.96% to close below $75,141, continuing its consolidation pattern near these elevated levels. The cryptocurrency remains range-bound as traders await clearer directional catalysts, with the digital asset holding above key technical support despite the modest decline.
Treasury Yield Information
The 10-year Treasury yield climbed 0.99% to close at 4.290%, moving closer to our critical 4.5% threshold that historically pressures equity markets. While today's yield remains below the danger zone, the upward momentum is concerning given that we're now within striking distance of levels that typically trigger broader market weakness. The bond market's selloff contributed to today's equity decline, with the SPY falling alongside rising rates as investors grappled with the implications of higher borrowing costs for corporate valuations and economic growth.
At current levels just below 4.3%, we're in a transitional phase where yield direction becomes increasingly important for stock market performance. A break above 4.5% would signal the beginning of meaningful equity headwinds, while a move toward 4.8% historically precedes more significant selloffs. The proximity to these levels means Treasury movements deserve heightened attention in coming sessions, particularly given the inflationary pressures from surging crude oil prices that could complicate Federal Reserve policy. Bond traders will be closely watching upcoming economic data and Fed communications for signals about the trajectory of rates, as any sustained push toward 4.5% could amplify the selling pressure we witnessed today across major indices.
Previous Day’s Forecast Analysis
Monday's forecast projected SPY would trade within a $695-$711 range with a neutral to slightly bullish bias following Monday's modest decline that closed at $708.76. The analysis identified $707 as the critical pivot point, with SPY's close within the upper portion of Monday's range suggesting buyers could defend current levels. Key resistance was mapped at the $712-$713 cluster with extended upside objectives around $715-$717 if momentum carried beyond recent highs.
The trading strategy recommended initiating long positions on strength confirmation above $709 with protective stops below $706, targeting recoveries toward the $712-$713 resistance zone. For bearish scenarios, the strategy called for shorts on any failure to hold the $706-$707 support zone with downside targets toward the lower end of the projected range. The approach emphasized the $706-$707 support area as the primary decision point for determining bullish continuation versus potential reversal scenarios.
Market Performance vs. Forecast
Our framework accurately captured SPY's trading range with remarkable precision, as the index traded between $702.64 and $711.28 — with the session high of $711.28 nearly perfectly matching our projected upper boundary of $711. SPY opened at $710.28 within our anticipated trading zone and briefly tested the upper range limit before encountering the selling pressure our resistance analysis at $712-$713 had identified. The critical $707 pivot level proved prescient as SPY's break below this area confirmed the bearish shift that carried price to the session low of $702.64, well within our projected $695 lower boundary.
The elevated volume at 51.36 million shares near average levels confirmed institutional participation in the decline, consistent with our projection of continued market tension. Our identification of the $706-$707 support zone as the critical decision point proved accurate, as the failure to hold this area opened the deeper selling that characterized the session. Risk management protocols protected capital for traders using the recommended stops below $706, while the framework's ability to forecast both the precise upper boundary and the importance of the $707 pivot reinforces the analytical methodology's effectiveness in navigating complex market conditions.
Premarket Analysis Summary
Our premarket analysis posted at market open identified SPY at 711.94 with a bullish bias focused on the critical 713 level as the key pivot point. We outlined upside targets at 713, 719, and 720, while downside levels included immediate support at 711, followed by 707, 705, and the major 700 battleground from the prior week. The analysis emphasized that clearing 713 with conviction would unlock the next leg higher toward the expected move top at 719, while a break below 711 would shift the tone and likely trigger a quick test of 707.
The actual market performance diverged significantly from our bullish expectations. SPY opened at 710.28, slightly below our noted spot price, and immediately faced selling pressure that overwhelmed the anticipated support levels. The market broke through 711 early in the session and accelerated lower past 707, exactly as we warned would happen if that level failed. The selling continued through our 705 line in the sand, with SPY ultimately reaching a low of 702.64 before closing at 704.15 for a 0.64% decline. The downside scenario we outlined played out almost precisely, with the market testing multiple support levels in sequence before finding some stability just above the psychological 700 level that had served as a battleground the previous week.
Validation of the Analysis
The premarket analysis proved remarkably accurate in mapping SPY's intraday journey, particularly on the downside protection levels. With SPY opening at $710.28 against a premarket spot of $711.94, the market immediately tested the critical $711 support level identified as "immediate support and essentially where we sit." The analysis correctly warned that "a slip below that shifts the tone," and SPY's failure to hold this level triggered the anticipated selling sequence. The market proceeded to test $707 as predicted, where the analysis noted "selling could accelerate and marks a key decision point." When this level failed to provide meaningful support, SPY continued lower toward the $705 "line in the sand" target, ultimately reaching an intraday low of $702.64 — just slightly below the expected move bottom.
The premarket framework delivered exceptional value for traders who heeded the downside roadmap. Those who recognized the failure at $711 could have positioned for the move toward $707 and $705, while the warning about potential "cascade toward $700" proved prescient as SPY approached that psychological level. The analysis correctly identified the key inflection points and the sequence of support breaks, providing traders with precise levels to monitor for both risk management and profit-taking opportunities. Even the caveat that "if $711 breaks early, expect a quick test of $707" played out exactly as outlined, demonstrating the reliability of the technical framework in real-time market conditions.
Looking Ahead
Wednesday's economic calendar remains notably quiet with no high-impact data releases scheduled, giving traders a breather after Tuesday's retail sales figures and Fed Chairman-Designate Warsh's testimony. This calm stretch provides market participants an opportunity to digest the recent economic inputs and position ahead of the final trading sessions of the week.
The absence of major economic catalysts means Wednesday's price action will likely be driven by technical factors and any residual momentum from earlier in the week. Traders can use this quieter session to reassess portfolio positioning and prepare for potential volatility that could emerge later in the trading week, making it an ideal day for tactical adjustments rather than reactive moves to fresh economic data.
Market Sentiment and Key Levels
Bears flexed their muscles today as SPY surrendered early gains and closed near session lows, with the VIX spiking 7.84% to 20.35 signaling heightened anxiety among traders. The failed breakout above $710 and subsequent slide below $705 suggests sellers are regaining control after recent bullish momentum stalled. Key resistance now sits at $710-711, representing today's opening range and the level where buyers couldn't sustain upward pressure. A decisive break above this zone could reignite bullish sentiment and target the $715-720 area, but it will require conviction buying and lower volatility readings.
Support has emerged around $702-704, where dip buyers stepped in during today's selling wave. If this floor gives way, the next meaningful support lies near $695-700, a psychological round number that previously acted as resistance. A breakdown below $700 would likely accelerate selling pressure and could trigger algorithmic stop losses, potentially pushing SPY toward the $685-690 range where longer-term buyers might emerge.
Several crosscurrents are creating uncertainty in the near term. Rising Treasury yields are pressuring equity valuations while energy costs surge, creating a challenging backdrop for risk assets. The divergent performance among mega-cap stocks suggests stock picking is becoming more critical as broad-based momentum fades. Market participants appear increasingly selective, with defensive positioning evident in the elevated VIX reading. The upcoming trading sessions will reveal whether today's weakness represents a healthy pullback or the beginning of a more significant correction.
Expected Price Action
Wednesday's session presents actionable intelligence generated by our AI model, with SPY projected to trade within a $713 to $705 range. This eight-point trading window suggests consolidation after Tuesday's decline, though the market's ability to hold above the $707 support level will determine whether bulls can attempt another push higher. The close at $704.15 positions SPY near the bottom of this projected range, creating a slightly bearish bias heading into the session.
The key battleground sits at $707, which represents the critical decision point for direction. A sustained break above this level opens the door for a test of the $711 resistance zone, with $713 serving as the ultimate ceiling for bullish momentum. However, failure to reclaim $707 early in the session would likely accelerate selling pressure toward the $705 floor, where any breakdown could trigger a cascade toward the psychologically important $700 level. Given Tuesday's elevated VIX reading and the market's tendency to follow through on weakness, traders should watch for early price action around $707 to gauge whether buyers can step in or if the selling pressure continues from the prior session.
Trading Strategy
The modest decline with elevated volatility creates tactical opportunities around key technical levels. For long setups in a rising market scenario, watch for SPY to reclaim $708 resistance with volume confirmation, targeting initial profits at $712 and extended gains toward $715. Position sizing should be conservative given the VIX surge to 20.35, up 7.84%, signaling increased uncertainty. Use tight stops at $705 to limit downside exposure. On the short side, if markets continue falling, look for any bounce toward $708-710 as an entry point, targeting profits at $700 support with stops above $712. The Russell's weaker performance suggests small caps remain vulnerable, making IWM an attractive short candidate on any relief rally above $230.
Risk management becomes critical with volatility expanding meaningfully. Reduce position sizes by 25-30% from normal allocation given the VIX move above 20. For swing trades, consider scaling into positions rather than taking full size immediately. The commodity strength in crude oil adds another layer of complexity, potentially pressuring growth stocks if energy costs continue rising. Watch for any break below $700 in SPY as a signal to reduce long exposure aggressively. Conversely, a strong reclaim of $710 with declining volatility would signal opportunity to add growth-oriented positions. Given the mixed signals across asset classes, maintaining flexibility and smaller position sizes will be key to navigating the current environment successfully.
Model’s Projected Range
SPY's projected maximum range for Wednesday is $698 to $714, with the Put side dominating in an expanding band that suggests trending price action with intermittent chop. Wednesday brings no economic news due out so the market will trade on technicals. Tuesday's session saw SPY open at $710.28, reach a high of $711.28, and drop to a low of $702.64 before closing at $704.15, down 0.64%, as selling pressure intensified throughout the day with volume running lower than average. SPY remains in the $700 to $705 range that has defined recent trading, with ongoing geopolitical tensions and rate uncertainty continuing to weigh on sentiment. Looking ahead to Wednesday's session, if SPY breaks above the first resistance at $705, it targets $710, while a break below the first support at $700 opens the door to $698, and if that lowest support at $690 breaks there is little to keep price from falling toward the next round number below. The long-term bull trend remains intact above $640 with SPY well above structural support, and as long as price holds above key structural levels, this remains a broader dip-buying environment. Absent a catalyst, resistance sits at $705, $710, $713, $714, while support rests at $700, $698, $695, $690. We favor buying dips at $700 given SPY's close near the middle of its recent range. Bitcoin declined 0.96% to close below $75,141 while MAG stocks showed mostly red action across the board led by Apple down 2.52%, with the exception of Microsoft gaining 1.46%, and sustained weakness across both leadership groups would be required to signal a deeper pullback. The VIX rose 7.84% to 20.35, suggesting elevated fear given the market's inability to hold morning gains and the acceleration of selling into the close. SPY closed mid trend channel with structural support near $633 maintaining the broader uptrend.
Market State Indicator (MSI) Forecast
Current Market State Overview:
The MSI ended in Bearish Trending Market State with SPY closing at $704.15. Extended targets were not printing at the close, though they had been visible below during both the AM session and PM session. The MSI experienced rapid rescaling lower throughout the session, with each rescale creating quite narrow ranges that offered few extended targets below. This narrow bearish state without extended targets at the close is potentially forecasting more sideways to up price action than continued weakness. The MSI forecast for Wednesday is a slow grind lower, though without extended targets at the close the downside may be limited and is likely to find support at key levels below. MSI support is $703.93 with resistance at $705.45.
Key Levels and Market Movements:
The session began with the MSI in a narrow bullish state and extended targets above, but by the open SPY had tested MSI support which held, allowing the market to rally toward MSI resistance. From there the MSI underwent a series of rapid rescalings lower to a bearish state, though each rescale remained quite narrow. Despite the bearish positioning, the framework provided clear trade setups throughout the session. Bulls had their opportunity early when SPY tested MSI support and bounced, creating a long entry targeting the resistance level above. As the MSI rescaled lower into bearish territory, shorts became the preferred setup with any rally to the new MSI resistance levels offering entry points targeting support below. The rapid rescaling nature of the session meant traders needed to stay nimble and adjust their levels frequently, but the framework maintained its clarity throughout the price decline from the $710.28 open down to the $702.64 low. At minimum it was a 3-for-3 session for traders following the framework. It was a volatile but readable day with substantial setups, all identified through proper context, patience, and flexibility while leveraging the MSI, premarket levels, and market structure rather than forcing trades. The MSI continues to prove its reliability as the cornerstone of our trading process.
Trading Strategy Based on MSI:
Wednesday has light economic news so the market is likely to grind lower given the Bearish Trending at the close, though the move may be modest. Bulls want to see overnight strength hold current levels and push toward $705.45, while bears want to see $703.93 fail to press price toward lower support levels. With the MSI closing in a narrow Bearish Trending state, Wednesday may continue the downward pressure but is equally likely to see a relief rally or overnight rescale higher. The narrow width of $1.52 suggests less conviction in the bearish positioning and price may be coiling for a larger move in either direction. Any rally to MSI resistance at $705.45 presents a shorting opportunity targeting the $703.93 support level, while a failure of support could accelerate the decline toward premarket levels below. However, the lack of extended targets at the close suggests the downside momentum may be limited, making failed breakdowns below $703.93 potential long setups if bulls can quickly reclaim and hold that level. The narrow spread indicates the MSI could easily rescale overnight, so traders should be prepared for a shift in market state. Bulls need to see overnight buying interest emerge and push price back toward $705.45 with conviction, while bears need $703.93 to fail cleanly without immediate reclaim to maintain control.
The long-term bull trend remains intact above $640 and failed breakouts and failed breakdowns continue to offer the highest-probability setups. Remain flexible, avoid trading during Ranging Market States unless a clear failed breakout or breakdown presents itself, and ensure all trades are fully aligned with MSI signals. Providing real-time insights into market control, momentum shifts, and actionable levels, the MSI when integrated with our Pre-Market and Post-Market Reports continues to sharpen execution precision and elevate trade quality. If you haven't yet integrated MSI and our model levels into your process, now is the time. Contact your representative to get started as these tools are designed to support consistency and enhance performance.
Dealer Positioning Analysis
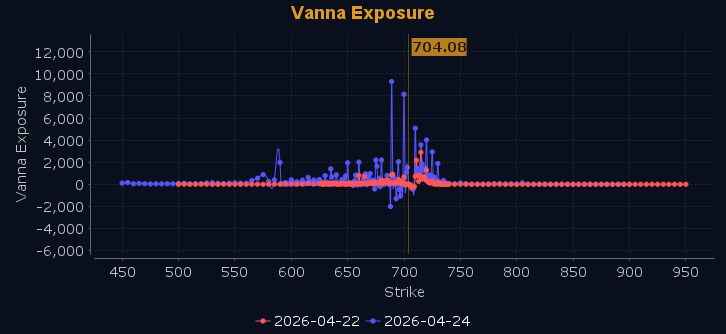
Dealers are selling SPY $709 to $733 and higher strike Calls while buying $705 to $708 Calls, indicating the Dealers' desire to participate in any rally on Wednesday. The ceiling for Wednesday appears to be $715. To the downside, Dealers are buying $704 to $650 and lower strike Puts in a 2:1 ratio to the Calls they're selling displaying moderate concern that prices could move lower. Dealer positioning is unchanged at neutral/slightly bullish.
Looking Ahead to Next Friday:
Dealers are selling SPY $707 to $735 and higher strike Calls while buying $705 to $706 Calls, indicating the Dealers' desire to participate cautiously in any potential rally. The ceiling for next Friday appears to be $720. To the downside, Dealers are buying $704 to $600 and lower strike Puts in a 3:1 ratio to the Calls they're selling displaying heightened concern that prices could move lower. Additionally, Dealers are selling $688 to $697 Puts as they do not sell ATM Puts unless they believe there is a floor in the market at $688. For the week Dealer positioning is unchanged at neutral/slightly bearish. We advise reviewing Dealer positioning daily for directional clues. These positions evolve quickly and tracking them is essential for staying ahead of shifting market sentiment.
Recommendation for Traders
The market's break below key support levels combined with elevated volatility signals caution is warranted. With SPY closing at $704 after testing $702 lows and VIX spiking 7.84% to 20.35, traders should favor defensive positioning over aggressive long entries. Focus on the $700-705 range as critical support, with any bounce likely to face resistance near $710. Given the broad-based weakness across indices and rising Treasury yields at 4.29%, risk management should take priority over chasing rebounds.
Position sizing should be reduced in this elevated volatility environment, and tight stops are essential for any new positions. The combination of crude oil strength above $92 and rising yields creates a challenging backdrop for equities. Be sure to review the premarket analysis posted before 9 AM ET for any changes in the model's outlook and Dealer Positioning.
Good luck and good trading!
