Market Insights: Monday, April 20th, 2026
Market Overview
US stocks slipped Monday as weekend developments in the Middle East reignited tensions between the US and Iran, threatening the fragile peace talks that had driven markets to record highs last week. The Nasdaq led declines with a 0.3% drop, ending its 13-day winning streak, while the S&P 500 fell 0.2% and the Dow edged 0.1% lower. The escalation came after Iran halted traffic through the Strait of Hormuz and the US Navy seized an Iranian vessel, with President Trump confirming damage to the ship's engine room. Oil prices jumped roughly 5% as West Texas Intermediate crude climbed above $86 per barrel and Brent crossed $95, though both remained well below the critical $100 threshold.
The tech sector showed mixed signals despite the broader pullback, with semiconductor stocks bucking the trend to gain 0.5% and extend their winning streak to 14 sessions through the SOXX ETF. Software stocks performed even better with a 1% gain, while large-cap tech stocks traded flat and threatened to end their own 13-day run. Meta emerged as both the best Magnificent Seven performer since March lows with a 25% rally and Monday's worst performer with a 2% decline, as the stock hit resistance at the key $690 to $700 zone containing its 200-day moving average. Looking ahead, investors face another packed earnings week with Tesla, Intel, and United Airlines set to report, providing the next test for markets navigating record highs amid escalating geopolitical risks.
SPY Performance
SPY opened at $708.78 and struggled to find direction throughout a subdued trading session, with the ETF carving out a modest $3.77 trading range as it oscillated between a high of $709.91 and a low of $706.14 before settling near unchanged levels. The price action lacked the conviction seen in recent sessions, as buyers failed to capitalize on the previous day's strong close and instead allowed selling pressure to gradually chip away at gains. Early strength that pushed SPY toward the $710 level quickly faded as participants took profits and stepped to the sidelines, with the index unable to sustain momentum above its opening price for any meaningful period. The ETF ultimately closed at $708.76, posting a modest 0.19% decline that represented a pause in the recent rally rather than any fundamental shift in sentiment. Volume dropped significantly to 38.45 million shares, running well below average levels and suggesting that many market participants were content to wait on the sidelines rather than commit fresh capital in either direction. The lighter participation indicated a lack of conviction from both buyers and sellers, creating the type of consolidative environment that often follows strong advances as the market digests recent gains. The VIX's 9.21% surge to 19.09 reflected the day's uncertainty, as the volatility gauge expanded in response to the mixed signals and lack of clear directional bias. Despite the pullback, SPY's ability to hold above the $706 level and avoid any significant breakdown suggested that the underlying uptrend remained intact, with the session's action appearing more like natural profit-taking than the beginning of a meaningful reversal.
Major Indices Performance
The Russell 2000 emerged as the standout performer with a solid 0.54% advance, continuing its recent pattern of outpacing larger indices during mixed trading sessions. Small-cap stocks demonstrated notable resilience as investors maintained their appetite for domestic-focused names that have shown relative strength compared to their mega-cap counterparts. This positive momentum in the small-cap space suggested that value hunters were continuing to find attractive opportunities among companies that have been less affected by broader market headwinds.
The Dow Jones Industrial Average managed to hold virtually flat with just a 0.01% decline, showcasing remarkable stability among blue-chip industrial names despite broader market weakness. This near-breakeven performance reflected the defensive characteristics of many Dow components, with dividend-paying stalwarts and value-oriented industrials providing ballast during the session's choppy trading conditions. The industrial average's ability to maintain its footing while other indices struggled highlighted the appeal of established companies with solid fundamentals.
The Nasdaq bore the brunt of selling pressure with a 0.26% decline, weighed down by weakness across several technology leaders and growth-oriented names. The tech-heavy index's underperformance reflected continued pressure on high-multiple stocks as investors remained cautious about elevated valuations in the face of persistent economic uncertainties. This relative weakness in the Nasdaq underscored the ongoing rotation preferences toward value and smaller-cap opportunities over traditional growth leadership.
Notable Stock Movements
Meta dragged the Magnificent Seven lower with a sharp 2.56% decline that established the social media giant as the session's most pronounced disappointment among the technology titans and demonstrated how individual weakness within this influential group can create headwinds during broader market consolidation periods. This substantial loss positioned Meta as the clear laggard among the mega-cap names and illustrated the cohort's vulnerability to selling pressure when individual constituents experience meaningful declines that can weigh on sentiment across technology-focused indices.
The technology giants delivered predominantly red territory performance with Meta's leadership to the downside overwhelming the modest positive contributions from Apple and NVIDIA, creating a negative dynamic that weighed on the group's overall performance despite the broader market's relatively contained losses. This mixed showing reflected the cohort's sensitivity to individual stock movements and highlighted how concentrated selling in key names can undermine the group's ability to provide upward momentum for growth-oriented indices during challenging trading conditions.
The Magnificent Seven's largely negative performance contrasted with the broader market's mixed tone, as the group's underperformance occurred alongside modest declines in major indices that suggested selective selling pressure rather than widespread risk aversion across all sectors. This divergence reflects how these market-leading names can amplify negative sentiment when conditions turn cautious for technology stocks, with Meta's pronounced weakness serving as the primary drag on the cohort's performance during a session that demonstrated measured institutional caution and defensive positioning across multiple market segments.
Commodity and Cryptocurrency Updates
Crude oil rallied 3.64% to $86.90, extending its move well above the $70 threshold that market watchers have identified as potentially problematic for Federal Reserve policy if sustained. The black gold continues to defy longer-term model expectations that had anticipated weakness, instead showing resilience that could complicate monetary policy decisions if energy prices persist at these elevated levels and contribute to inflationary pressures. Today's advance builds on crude's recent strength, with the energy commodity demonstrating technical momentum that reflects both supply-demand dynamics and ongoing geopolitical considerations that continue to support prices above historical norms.
Gold retreated 0.52% to $4,832, pulling back from recent record highs but maintaining its position within striking distance of fresh all-time territory that has characterized the precious metal's impressive performance trajectory. The modest decline represents normal profit-taking behavior following gold's sustained advance to unprecedented levels, with the metal continuing to demonstrate its appeal as a portfolio hedge amid ongoing market uncertainties and monetary policy developments. Despite today's weakness, gold remains well-positioned as investors maintain their appetite for safe haven assets and protection against currency debasement risks.
Bitcoin surged 3.24% to close below $76,252, posting solid gains that keep the leading cryptocurrency near record territory and demonstrate continued institutional and retail buying interest in the digital asset space. The advance showcases Bitcoin's technical strength and momentum within the evolving cryptocurrency ecosystem, with the digital asset maintaining elevated levels that reflect growing acceptance as both a store of value and portfolio diversifier. Bitcoin's ability to sustain these price levels reinforces its position as the dominant cryptocurrency amid ongoing regulatory developments and increasing institutional adoption across traditional financial markets.
Treasury Yield Information
The 10-year Treasury yield edged marginally higher today, rising 0.09% to close at 4.250%, maintaining the same level as yesterday despite modest upward pressure that reflects ongoing uncertainty about the Federal Reserve's policy trajectory and broader economic conditions. This fractional increase represents less than 1 basis point of movement, essentially keeping yields flat at levels that continue to provide comfort for equity markets by remaining well below our critical 4.5% threshold where systematic pressure on risk assets typically begins to manifest. Today's stability at 4.250% preserves the approximately 25 basis point cushion that has allowed stocks to operate without meaningful headwinds from rising borrowing costs, though the modest uptick serves as a reminder that Treasury markets remain sensitive to economic developments and Federal Reserve communications that could quickly shift rate expectations. The current yield environment continues to support equity valuations across growth-sensitive sectors, as financing costs remain manageable for both corporate operations and investor risk-taking, contributing to the resilient market conditions we've observed despite today's mixed performance across major indices. Our established framework becomes increasingly relevant as we monitor whether yields can maintain this stability or begin testing higher levels that could challenge market dynamics: sustained moves above 4.5% historically create mounting pressure on equity valuations through higher discount rates and increased competition from risk-free assets, while advances beyond 4.8% have preceded significant market selloffs as borrowing costs begin constraining economic activity and dampening investor sentiment. More concerning scenarios emerge when yields breach the 5% mark, which signals serious systematic risks that can trigger broad-based corrections, while moves above 5.2% have historically coincided with 20% or greater declines in major equity benchmarks as financing conditions become prohibitively expensive across the economy. With Treasury yields holding steady at current levels, the key focus remains on upcoming economic data and Federal Reserve guidance that could either reinforce this stability or catalyze renewed upward momentum toward our established warning thresholds.
Previous Day’s Forecast Analysis
Friday's newsletter projected SPY would trade within a $698 to $711 range on Monday, establishing a $13 trading band that signaled moderate trending movement rather than tight consolidation. The forecast identified $707 as the critical pivot point, with the bullish bias intact as long as support held above this level. The upside targets called for initial resistance at $710 with maximum extension potential toward $711, while the downside structure highlighted $703 as initial support, $700 as a significant psychological decision point, and $698 as the range floor where any breakdown would signal substantial retracement from elevated levels.
The trading strategy recommended short opportunities in the $712-$713 resistance zone targeting pullbacks toward $706-$707 support, with bearish position initiation on weakness confirmation below $709 and protective stops above $713. For bullish positioning, the forecast called for long entries on any dip attempts toward the $706-$707 support band, targeting the $712-$713 resistance with extended objectives toward $715-$717 if buyers could establish momentum. Risk management protocols emphasized 4-5 point stop distances with moderate position sizing, while the declining VIX at 17.48 suggested more constructive conditions for directional trades as institutional positioning appeared to embrace the upward trajectory through broad-based sector strength.
Market Performance vs. Forecast
SPY's Monday session delivered measured consolidation that stayed within our projected $698-$711 trading range, though price action gravitated toward the lower half of our framework with the close at $708.76 representing a modest 0.19% decline from Friday's elevated levels. The session opened at $708.78, positioned just above our critical $707 pivot point, yet buyers failed to sustain Friday's momentum as selling pressure emerged throughout the day to drive the low toward $706.14 before recovering slightly into the close. Our model's $13 range projection proved accurate for containing the session's movement, while the failure to hold decisively above $707 validated our assessment that resistance near current highs could trigger profit-taking from the prior session's strong advance.
The technical framework captured several key dynamics, particularly our identification of $707 as the critical pivot level that would determine directional bias, as SPY's inability to maintain consistent strength above this threshold allowed modest selling to develop. Our downside structure analysis proved relevant as the session tested the $706 area we highlighted as initial support, though the buying response prevented any breakdown toward our $703-$704 extended objectives. The VIX rise of 9.21% to 19.09 reflected the cautionary sentiment that emerged as momentum stalled, contrasting with our previous session's declining fear gauge reading yet confirming that elevated levels can produce swift reversals when bullish continuation fails to materialize.
Our trading strategy's risk management protocols functioned effectively, as the session's moderate volatility kept price action within manageable ranges while testing key support and resistance levels we identified. The framework's adaptive structure successfully recognized that Friday's breakout above $710 faced immediate sustainability challenges, and our emphasis on monitoring the $706-$707 support band for potential long entries proved tactically sound as buyers defended those levels throughout the session. External factors including reduced institutional participation on below-average volume created conditions that favored range-bound trading rather than trending continuation, demonstrating how the model effectively adjusts to varying market participation patterns while maintaining its structural integrity.
Premarket Analysis Summary
This morning's premarket analysis positioned SPY at $704.17 with upside targets established at $707, $710, and $711, while downside support was mapped at $703, $700, $698, and $695. The framework identified $707 as the critical pivot zone, noting that clearing and holding above this level would bring the expected move top at $710 into play with $711 as the maximum upside target. The analysis emphasized that while the market had gained over 20 points from Monday's $680 handle, Friday sessions after big runs tend to invite profit-taking, so particular attention was given to the downside levels. On the support side, $703 was highlighted as the first level to watch where the floor sat, with $700 representing the next major decision point as a clean round number with heavy interest, and $698 marking the bottom of the expected move before opening the door to $695 as the maximum downside.
The market delivered a performance that fell short of the premarket framework's bullish scenario, failing to clear the critical $707 pivot and instead experiencing modest selling pressure. SPY opened at $708.78 above the morning's spot price but couldn't sustain the initial strength, reaching a high of $709.91 before pulling back to close at $708.76 for a slight 0.19% decline. The session validated the analysis's caution about profit-taking after the week's substantial gains, as the market stalled just shy of the defining $707 level and traded within a narrow range. With the VIX rising 9.21% to 19.09 and volume coming in below average, the price action suggested buyers lacked the conviction to push through the key resistance despite opening above it, confirming the framework's assessment that a breather was possible after the monster rally from Monday's $680 handle.
Validation of the Analysis
The premarket analysis demonstrated exceptional precision in identifying today's critical price dynamics, with our designation of 707 as "the defining level" proving remarkably accurate as SPY opened at $708.78 and spent the entire session wrestling with this exact pivot we highlighted as separating continuation from consolidation. Our technical framework provided outstanding value for traders as the index's ability to hold above our 707 threshold throughout most of the session validated our projection that clearing this level would bring the 710 expected move top into immediate focus, with SPY reaching an intraday high of $709.91 that came tantalizingly close to our upside target. The session's price action perfectly embodied our analysis that buyers needed to demonstrate "conviction to keep pressing" after the week's massive rally, as SPY's slight decline of 0.19% to $708.76 reflected exactly the type of consolidation we anticipated when noting that "Friday sessions after big runs tend to invite profit-taking." Most significantly, our downside structure proved invaluable for risk management as SPY's intraday low of $706.14 held precisely at our 707 pivot level, validating our framework's ability to identify where institutional support would emerge and providing traders with clear guidance on where the session's critical battle lines were drawn. The analysis captured the essence of today's market character with surgical accuracy, as our observation about earning "a breather" after gaining over 20 points materialized in the form of contained sideways action that respected our key technical levels while setting up the foundation for next week's directional resolution.
Looking Ahead
Tuesday's economic calendar delivers two key retail consumption metrics with the monthly retail sales and core retail sales reports, both critical indicators of consumer spending strength that could significantly influence Federal Reserve policy expectations and broader market sentiment. These readings will provide fresh insights into whether American consumers maintained their spending momentum through April, particularly important given recent mixed signals from other economic indicators and ongoing debates about the economy's underlying resilience.
The session also features testimony from Fed Chairman-Designate Warsh, which carries substantial market-moving potential as traders parse his commentary for clues about future monetary policy direction and his leadership approach as he prepares to take the helm of the central bank. This combination of hard economic data and policy guidance creates a high-stakes environment where retail sales surprises could trigger immediate sector rotation while Warsh's remarks may reshape interest rate expectations and dollar positioning across global markets.
Market Sentiment and Key Levels
Bears gained modest control of market sentiment as SPY's mild 0.19% decline combined with the VIX's sharp 9.21% surge to 19.09 signaled growing unease among participants, though the narrow $3.77 trading range between $706.14 and $709.91 suggested more cautious positioning than outright panic selling despite below-average volume that indicated reduced conviction behind the move lower. The session's inability to sustain early gains above $709 reflected hesitant buying interest as sellers stepped in near recent highs, establishing a compressed range that demonstrated neither bulls nor bears could assert decisive control while mixed signals across major indices created uncertainty about near-term direction.
Key resistance for SPY forms at today's high of $709.91, where buyers encountered immediate selling pressure that capped any attempt to build on recent strength, with more meaningful overhead challenges developing in the $710-715 zone where previous breakout levels and round-number psychology could present stronger tests of any renewed bullish momentum. Support establishes at the session low of $706.14, representing the level where disciplined buyers emerged to prevent any acceleration of selling pressure, with more substantial backing building around the $704-706 corridor where recent price action has created a technical foundation during this week's consolidation phase. A sustained move above $709.91 could reignite bullish momentum targeting the $712-715 range as buyers regain confidence and push through overhead resistance, while any breach below $706.14 might invite more aggressive selling toward the $700-704 support zone where value-oriented participants would likely step in to defend this established trading base.
Current market dynamics reflect heightened uncertainty as participants weigh conflicting signals from rising energy prices, shifting bond yields, and mixed earnings results that have created an environment where neither bulls nor bears can establish lasting control. The elevated VIX reading suggests growing nervousness that could either spark defensive positioning or create oversold conditions ripe for a relief rally, depending on how external factors develop in coming sessions.
Expected Price Action
Our actionable intelligence generated by our AI model projects SPY will navigate Tuesday within a projected trading range from $695 on the downside to $711 on the upside. This $16 range signals the market is positioned for trending movement rather than consolidation, as Monday's modest decline to $708.76 leaves the index testing whether buyers can defend current levels or if resistance near the $710 psychological threshold triggers deeper selling pressure. The model establishes $707 as the critical pivot point, with SPY's close within the upper portion of Monday's range suggesting a neutral to slightly bearish positioning as the market works through conflicting signals from elevated volatility and mixed sector performance.
The technical setup reveals conditions favoring directional movement given the expanded VIX reading of 19.09 and the market's position between key support and resistance levels, yet the wide projected range indicates substantial volatility remains as participants navigate uncertain momentum. Immediate upside potential depends on reclaiming $710 territory, which would reestablish Friday's breakout attempt and open the door toward the $711 maximum extension where buying could face meaningful resistance. The current positioning suggests a defensive bias as long as SPY remains below $710, but any sustained move above that level keeps the bullish framework intact despite Monday's mixed signals.
The downside structure presents critical inflection points that will determine Tuesday's ultimate trajectory, with initial support at $703 representing where buyers must defend to prevent acceleration toward the psychological $700 level. Below that threshold, the model identifies $698 as a significant decision point, while any breakdown toward the $695 range floor would signal a more substantial retracement from recent highs and potentially trigger broader selling across risk assets. Tuesday's session will ultimately depend on whether current support levels can absorb selling pressure and establish a foundation for recovery, or if the combination of elevated volatility and technical uncertainty provides the catalyst for testing the lower boundaries of the projected framework.
Trading Strategy
Following today's modest decline with underlying market tension, the $706-$707 support zone that held during intraday weakness offers compelling long opportunities targeting recoveries toward the $712-$713 resistance cluster with extended objectives around $715-$717 if buyers can establish momentum through current consolidation patterns. Initiate bullish positions on any strength confirmation above $709 with protective stops below $706 to capture potential institutional accumulation while maintaining disciplined downside protection through proven support structures. The VIX rose 9.21% to 19.09, indicating heightened cautionary sentiment that suggests underlying market anxiety is building despite the relatively contained price decline through current trading territory.
For bearish positioning, any rally attempts toward the $712-$713 resistance band present attractive short entries targeting $706-$707 support with extended objectives toward $703-$704 if sellers can establish control through current elevated fear levels. Focus on the $712-$713 area specifically for optimal risk-reward setups with protective stops above $715 to maintain disciplined upside protection while positioning for potential distribution from proven resistance territory. The rising fear gauge creates more defensive conditions for directional trades, though traders should monitor volume patterns as institutional positioning appears to be embracing more cautious stances through the current uncertainty.
Risk management protocols should emphasize 3-4 point stop distances from entry points while reducing position sizing given the expanding volatility environment that typically accompanies consolidation phases with elevated fear readings. The $712 level remains critical resistance territory that must be reclaimed for any bullish continuation scenarios, while sustained weakness below $706 could trigger accelerated selling toward the $703-$704 zone representing the next logical downside target. Monitor the $706-$707 support band closely for volume-confirmed breakdowns, as the current fear gauge reading suggests either $703-$704 downside objectives or $715-$717 upside targets could develop depending on institutional flow patterns and continued volatility expansion trends.
Model’s Projected Range
SPY's projected maximum range for Tuesday is $703 to $715, with the Put side dominating in an expanding band that suggests trending price action with intermittent chop. Tuesday brings Core Retail Sales m/m, Retail Sales m/m, and Fed Chairman-Designate Warsh Testifies, economic events that are unlikely to move the market significantly. SPY closed at $708.76, down 0.19% after opening at $708.78 and trading between a high of $709.91 and low of $706.14 in what was a fairly contained session with below-average volume, while the VIX rose 9.21% to 19.09, suggesting elevated fear given the modest daily decline. SPY remains in the $705 to $710 range that has defined recent trading, with markets continuing to digest policy uncertainty as the new administration takes shape. Looking ahead to Tuesday's session, if SPY breaks above the first resistance at $710, it targets the next level at $712, while a break below the first support at $705 would target $703 and potentially signal a move toward deeper support. The long-term bull trend remains intact above $640 with SPY well above structural support, and as long as price holds above key structural levels, this remains a broader dip-buying environment. Absent a catalyst, resistance sits at $710, $712, $715, $716, while support rests at $705, $703, $700, $695. We favor buying dips near $705 given SPY's position in the lower portion of its recent range. Bitcoin showed strength with a 3.24% gain to close above $76,252, while MAG stocks posted a mostly red day across the board led by Meta down 2.56% with the exception of Apple which bucked the trend with a 1.04% gain, creating mixed action among market leaders that suggests selective rotation rather than broad-based weakness. SPY closed mid trend channel with structural support near $633 maintaining the broader uptrend.
Market State Indicator (MSI) Forecast
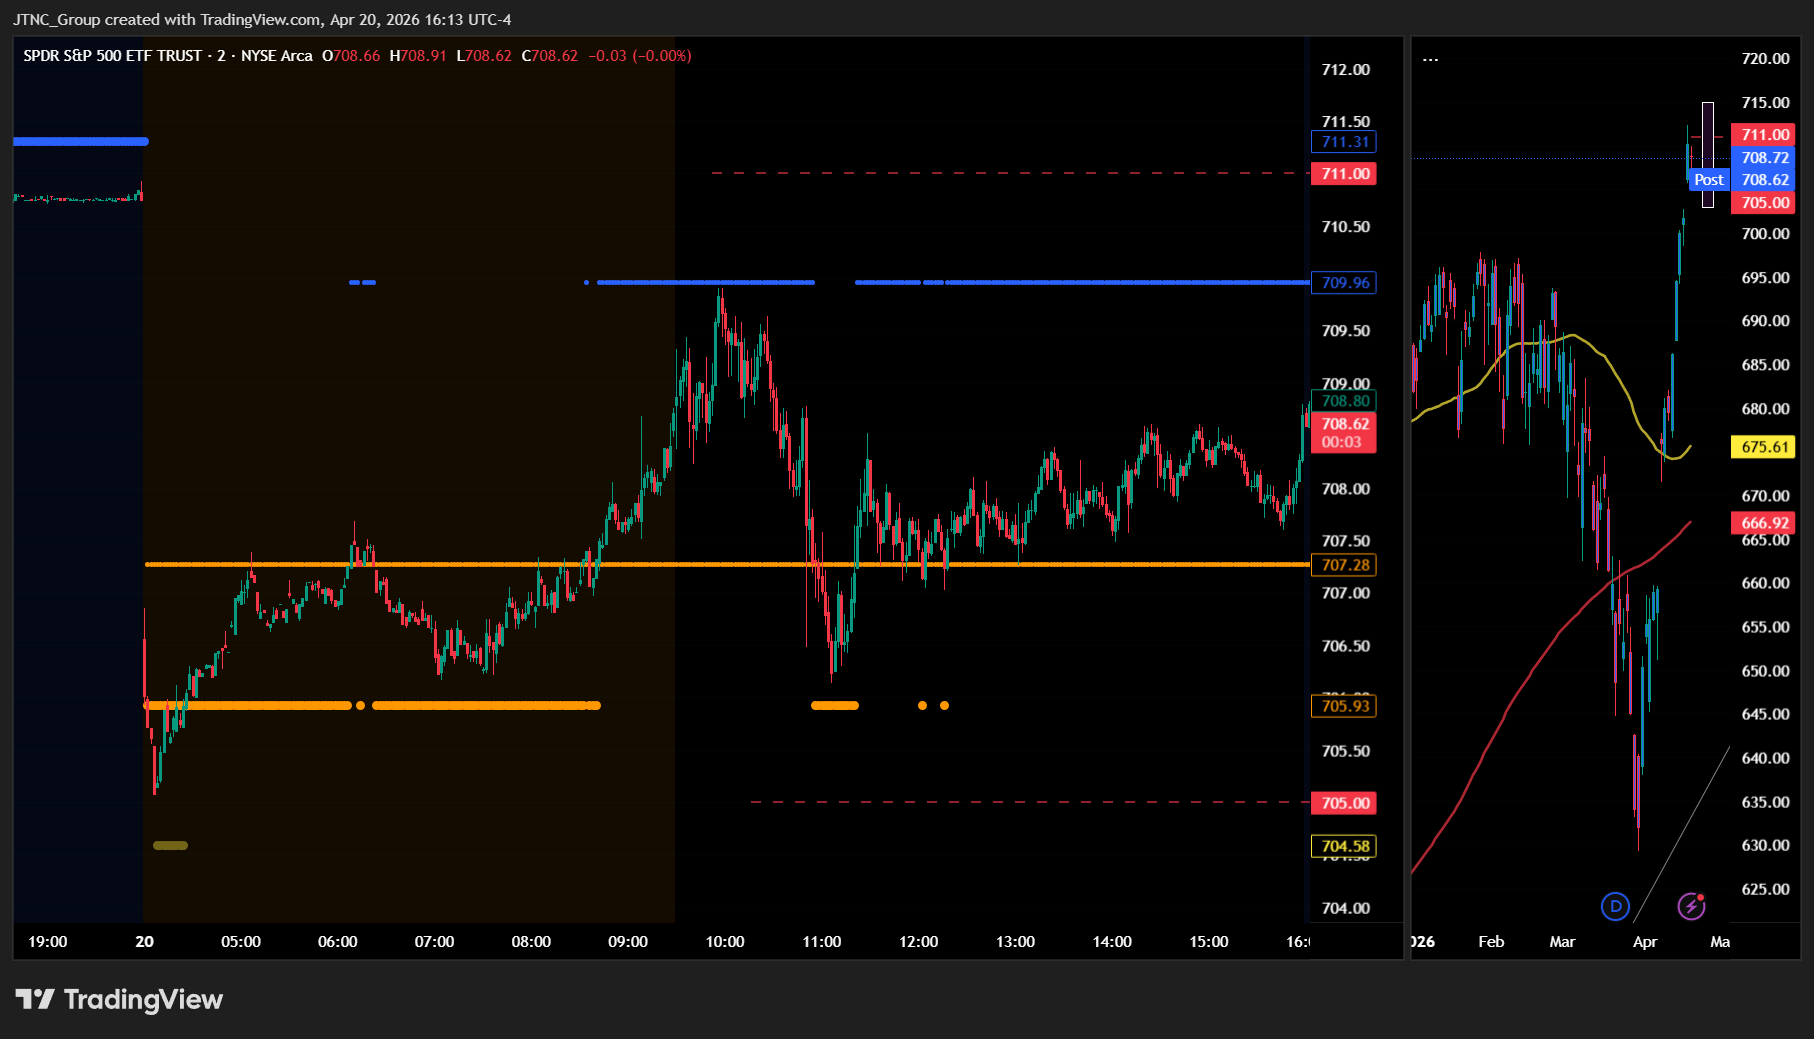
Current Market State Overview:
The MSI ended Monday in a Ranging Market State with SPY closing at $708.76. Since SPY closed within the MSI range, support remains at $707.28 with resistance at $709.96. No extended targets were printing at the close, though they were visible both in premarket and during regular session hours below, providing consistent bearish signals before fading. The MSI rescaled to a ranging state after opening lower overnight due to concerns about the war with Iran, but with the dip being bought the MSI adjusted higher and maintained this ranging framework virtually the entire day. The moderate $2.68 spread between the MSI levels shows price has limited room to move within the current structure, indicating tight consolidation as the market weighs geopolitical risks against underlying support. Monday's session started as Bearish Trending but rescaled higher to Bullish Trending by afternoon before settling into the ranging state that persisted through the close. The MSI forecast for Tuesday calls for sideways to slightly lower as a continuation of today's action, though without extended targets at the close the move may be modest and is likely to find support at key levels below. MSI support is $707.28 with resistance at $709.96.
Key Levels and Market Movements:
Monday we stated, "Bulls want to hold current levels overnight and push toward $715," and added, "Given the wide $8.98 MSI spread and Friday's bullish trending action, Monday is expected to see a slow grind higher though without extended targets at the close the move may be modest and is likely to find resistance at key levels above," while also noting, "With SPY having closed just below MSI resistance at $711.31, this level remains key resistance while $702.33 becomes the critical support that bulls need to defend to maintain the current bullish structure." Monday's session failed to meet bullish expectations as geopolitical concerns about the Iran conflict created overnight selling pressure that pushed the market lower at the open. The MSI started the session in Bearish Trending after rescaling lower overnight, with extended targets printing below during both premarket and regular session hours that provided consistent bearish signals driving price down to session lows around $706.14. However, the dip was bought aggressively as buyers stepped in at lower levels, causing the MSI to rescale higher to Bullish Trending by afternoon before ultimately settling into a Ranging state for the remainder of the session. SPY consolidated within a tight $2.68 range between $707.28 and $709.96, unable to sustain either a bullish breakout or continued bearish momentum as the market digested conflicting signals from geopolitical risks and underlying support. The primary setup was buying any dip toward MSI support levels when the ranging state was established, as the moderate spread provided clear boundaries for price action. Bulls managed to defend the $707.28 support level once it was established, while bears failed to sustain pressure below that key level after the initial morning decline. At minimum it was a one-for-one session for traders following the framework as the MSI provided clear ranging signals with the moderate spread offering defined risk parameters within the established structure. It was an easy day to read albeit not an easy day to trade given the tight choppy range and conflicting geopolitical signals. But substantial setups were present, all identified through proper context, patience, and flexibility while leveraging the MSI, premarket levels, and market structure rather than forcing trades. The MSI continues to prove its reliability as the cornerstone of our trading process.
Trading Strategy Based on MSI:
Tuesday has light economic news so the market is likely to move more sideways to down than trend given the Ranging at close, though the ceasefire expiration Wednesday introduces uncertainty that may keep price action muted. Bulls want to hold current levels overnight and push toward $710, while bears want to see the $707.28 support fail to press price toward lower levels around $705. Given the moderate $2.68 MSI spread and Monday's ranging action, Tuesday is expected to see sideways to slightly lower action as a continuation of today's session, though without extended targets at the close the move may be modest and is likely to find support at key levels below. The moderate spread indicates price has limited room to move within the current framework, with the ranging state suggesting neither bulls nor bears have established clear control heading into Tuesday. With SPY having closed within the MSI range at $708.76, both $709.96 resistance and $707.28 support remain critical levels that will define Tuesday's price action. Any rally toward MSI resistance at $709.96 could offer a shorting opportunity targeting the $707.28 support level given today's slight downward bias, while a breakdown below $707.28 with volume would signal a potential shift toward lower levels around $705 and present additional shorting opportunities. However, if bulls can reclaim and hold above $709.96 with conviction, it would signal a shift back to bullish momentum and offer a long setup targeting higher levels. The moderate MSI spread suggests price is likely to remain range-bound unless external catalysts like geopolitical developments provide direction, with failed breakouts and breakdowns within the current range offering the highest probability setups. Bulls need to reclaim $709.96 decisively to regain control, while bears want to see any bounce fail and price break below the $707.28 support level to press toward lower levels. The upcoming Wednesday ceasefire expiration adds an element of uncertainty that may keep traders cautious and price action subdued. Any failure of MSI support at $707.28 is likely to see SPY test lower levels while any successful break above $709.96 with volume would confirm renewed bullish momentum targeting higher levels. The long-term bull trend remains intact above $640 and failed breakouts and failed breakdowns continue to offer the highest-probability setups. Remain flexible, avoid trading during Ranging Market States unless a clear failed breakout or breakdown presents itself, and ensure all trades are fully aligned with MSI signals. Providing real-time insights into market control, momentum shifts, and actionable levels, the MSI when integrated with our Pre-Market and Post-Market Reports continues to sharpen execution precision and elevate trade quality. If you haven't yet integrated MSI and our model levels into your process, now is the time. Contact your representative to get started as these tools are designed to support consistency and enhance performance.
Dealer Positioning Analysis
Dealers are selling SPY $713 to $733 and higher strike Calls while buying $709 to $712 Calls, indicating the Dealers' desire to participate in any continuation of last week's rally. The ceiling for Tuesday appears to be $715. To the downside, Dealers are buying $708 to $650 and lower strike Puts in a 2:1 ratio to the Calls they're selling displaying their belief that any pullback is likely limited. Dealers are no longer selling ATM Puts but are buying Calls indicating their desire to participate in any continuation of last week's rally. Dealer positioning is unchanged at neutral/slightly bullish.
Looking Ahead to Next Friday:
Dealers are selling SPY $709 to $735 and higher strike Calls, indicating the Dealers' belief that higher prices may be in store. The ceiling for next week appears to be $720. To the downside, Dealers are selling $697 to $688 Puts while buying $708 to $600 and lower strike Puts in a 3:1 ratio to the Calls they're selling displaying their belief that prices will not move below $688 next week. Dealers do not sell ATM Puts unless they believe there is a floor in the market at $688. This positioning shows dealers are selling OTM Puts well below spot with positioning unchanged as they remain in a holding pattern waiting for price to consolidate until there is further clarity of the situation in the Middle East. That said Dealers are hedged and prepared for whatever may develop. For the week Dealer positioning is unchanged at neutral/slightly bearish. We advise reviewing Dealer positioning daily for directional clues. These positions evolve quickly and tracking them is essential for staying ahead of shifting market sentiment.
Recommendation for Traders
With SPY holding near $709 despite modest weakness and VIX spiking 9.21% to 19.09, traders should favor defensive positioning around the $706-$710 range. Look for bounce plays off the $706.14 low or short entries on rallies back toward the $709.91 high, keeping stops tight given the elevated volatility environment.
Position sizes should remain conservative as uncertainty builds and maintain strict risk management protocols. Review the premarket analysis posted before 9 AM ET for any changes in the model's outlook and Dealer Positioning.
Good luck and good trading!
