Market Insights: Wednesday, April 1st, 2026
Market Overview
US stocks extended their impressive rally Wednesday with the S&P 500 gaining 0.7%, the Nasdaq climbing 1.1%, and the Dow adding 0.5% as investors continued betting on a swift resolution to the Middle East conflict. The gains built on Tuesday's explosive session, with markets now riding high on diplomatic momentum after Iranian President Masoud Pezeshkian reiterated his country's willingness to end the war and President Trump suggested US involvement could wrap up "within two weeks, maybe two weeks, maybe three." Trump is set to address the nation Wednesday at 9 PM ET with an update on the conflict, though he's indicated Iran must fully reopen the Strait of Hormuz for any ceasefire consideration.
Oil prices continued their retreat as peace hopes gained traction, with Brent crude falling roughly 3% to settle just above $100 per barrel and West Texas Intermediate dropping around 2% to just under $100. The energy selloff reflects growing market confidence that the conflict's resolution could ease supply concerns and bring stability to global commodity flows. Wall Street strategists are already adjusting their outlooks, with Ed Yardeni's firm considering lowering recession probability from 35% to 20% once there's greater clarity on whether the Middle East situation has truly been resolved, while UBS continues targeting the S&P 500 reaching 7,700 by year-end despite the recent geopolitical volatility.
SPY Performance
SPY opened at $653.90 and continued the previous session's constructive tone as the ETF built upon recent gains, though the advance proceeded at a more measured pace compared to the explosive rally that had preceded it. The early trading hours saw buyers maintain control as SPY pushed toward the $658.52 session high, creating a $5.52 trading range that while narrower than recent volatile sessions, demonstrated consistent upward pressure as institutional participants continued their rotation back into equity exposure. The advance carried SPY through the $655 level with relative ease, suggesting that the technical momentum from the prior session's breakout remained intact as buyers stepped in on any minor pullbacks to support the upward trajectory. Throughout the midday and afternoon hours, SPY held comfortably above its opening level and maintained proximity to session highs, indicating that the recent shift in sentiment toward risk assets was gaining traction among professional investors who appeared increasingly willing to add equity exposure at current levels. The sustained buying interest reflected confidence that the recent selling pressure had created attractive entry points, with participants demonstrating their willingness to chase the rally as defensive positioning continued to unwind across institutional portfolios. SPY closed at $655.19, posting a solid 0.75% gain that extended the recent recovery and reinforced the technical breakout above key resistance levels that had been established in the previous session's explosive advance. Volume came in at 88.76 million shares, remaining well above average levels and confirming that institutional participation was supporting the continued upward momentum, with the elevated trading activity suggesting that professional investors were actively repositioning portfolios toward greater risk asset allocation. The VIX declined 1.86% to 24.78, marking a further compression in defensive premiums as the sustained equity rally allowed fear-based positioning to continue unwinding, though the reading remained elevated relative to historical norms and indicated that while immediate anxiety was subsiding, underlying caution persisted among market participants.
Major Indices Performance
The Nasdaq delivered the strongest performance among major indices with a solid 1.16% gain, benefiting from broad-based technology strength that saw most Magnificent Seven names posting positive returns throughout the session. The Russell 2000 followed with a 0.77% advance, as small-cap stocks continued to attract investor interest amid ongoing rotation dynamics favoring domestic growth opportunities. The Dow trailed with a modest 0.48% increase, though the blue-chip benchmark still managed to participate in the day's generally positive momentum across equity markets.
The performance hierarchy reflected familiar patterns where technology-heavy indices outpaced their value-oriented counterparts, though the gaps between major benchmarks remained relatively narrow compared to recent trading sessions. The Nasdaq's leadership stemmed largely from continued optimism around artificial intelligence themes and strong individual performances from key technology components. Meanwhile, the Russell 2000's respectable showing demonstrated that smaller companies maintained their appeal despite ongoing concerns about economic growth and interest rate sensitivity. The Dow's more restrained advance aligned with its composition of established industrial and financial names that tend to move more conservatively during risk-on environments, though the benchmark's positive finish still contributed to the day's broadly constructive market tone.
Notable Stock Movements
Alphabet emerged as the Magnificent Seven's dominant force with a commanding 3.42% advance that positioned the search giant as the session's clear leader within this elite technology cohort and demonstrated how selective strength in mega-cap names helped drive the broader market's solid 0.75% gain throughout the trading day. The company's exceptional performance highlighted the continued appetite for established technology leaders as investors maintained their preference for quality growth names despite the more measured pace compared to recent sessions' explosive moves.
The Magnificent Seven delivered a broadly positive showing that supported the Nasdaq's solid 1.16% advance, with the vast majority of these technology titans posting gains that reinforced their role as consistent drivers of market momentum. Microsoft stood as the notable exception with a modest 0.22% decline, but this isolated weakness failed to dampen the group's overall constructive tone as the remaining members demonstrated resilience and helped validate the session's risk-on environment across the technology sector.
The technology leaders' predominantly green performance reflected the sustained confidence investors continue placing in these influential equities, where their collective strength aligned with the VIX's continued moderation of 1.86% to 24.78 and suggested that fear levels remain well-contained. Their coordinated upward movement underscored the powerful influence these names maintain over broader market dynamics, where Alphabet's standout performance and the group's overall positive bias helped support the session's constructive tone and demonstrated how these mega-cap growth stocks continue attracting consistent institutional interest.
Commodity and Cryptocurrency Updates
Crude oil declined 1.81% to $99.54, pulling back from recent highs but maintaining its position well above the $70 threshold that has defied longer-term model expectations for several months. The retreat represents normal consolidation within the broader uptrend that has kept the energy commodity entrenched in triple-digit territory, driven by ongoing supply-demand imbalances and geopolitical tensions. Despite today's decline, crude remains at levels that continue complicating Federal Reserve policy decisions, as sustained energy price strength adds meaningful inflationary pressure throughout the economy and challenges central bank efforts to maintain price stability.
Gold advanced 3.16% to $4,794, posting another substantial gain that pushed the precious metal to fresh historically elevated levels as defensive demand remained robust across financial markets. The strong rally builds on recent momentum and reinforces gold's classic safe-haven characteristics during periods of market uncertainty and economic volatility. The continued strength demonstrates the metal's enduring appeal among institutional and retail investors seeking protection against currency debasement and systemic risks, with gold's persistent gains suggesting sustained demand as global economic conditions remain fluid.
Bitcoin slipped 0.19% to close below $68,105, marking a modest decline that interrupted recent positive momentum as the cryptocurrency faced mild selling pressure. The slight retreat represents normal volatility for the digital asset, which has maintained relative stability near current levels while preserving its established presence within diversified investment portfolios. The minor pullback keeps Bitcoin positioned near key technical thresholds, with the cryptocurrency continuing to demonstrate resilience amid broader market fluctuations while digital asset markets reflect ongoing institutional adoption trends and evolving regulatory landscapes.
Treasury Yield Information
The 10-year Treasury yield edged higher by 0.19% to close at 4.320%, marking a modest reversal from yesterday's 4.310% level but remaining comfortably below the critical 4.5% equity pressure threshold that continues to serve as the primary technical barrier for sustained market advances. This 1 basis point uptick from yesterday's close represents a minor pullback from the recent yield relief that had provided stocks with expanded room to rally, though today's 4.320% level still maintains meaningful distance from the 4.5% danger zone where persistent trading creates systematic headwinds for equity valuations. The slight yield increase coincided with continued equity strength as the SPY gained 0.75% and the VIX declined 1.86% to 24.78, suggesting that today's modest Treasury weakness remains well within acceptable parameters for risk asset performance. At current levels around 4.32%, yields maintain a reasonable 18 basis point buffer from the 4.5% threshold where equity pressure intensifies, providing markets adequate space to digest gains without immediate systematic selling pressure. The key technical question remains whether this minor yield uptick represents the beginning of renewed Treasury weakness that could eventually challenge 4.5%, or if yields can stabilize in the low 4.3% range to support continued equity momentum. Any sustained move above 4.4% would warrant increased vigilance about approaching the systematic selling zone, while a break above 4.5% would trigger the equity headwinds that historically precede moves toward the more dangerous 4.8% correction territory and ultimately the critical 5% level where serious market disruptions typically unfold.
Previous Day’s Forecast Analysis
Our Tuesday forecast anticipated SPY trading within a $632-$645 range with a bullish bias after the previous session's strong close at $650.35, though the model recognized positioning above the projected upper boundary suggested potential recalibration needs. The analysis identified $638 as the critical bias level while acknowledging Tuesday's strength should provide solid support for any pullback attempts. The forecast targeted the $641-$642.50 resistance cluster as the zone where meaningful selling pressure would emerge, with $645 representing the primary upside ceiling if buying conviction materialized despite expected complications from profit-taking pressure.
Downside protection was centered around $635 support with deeper weakness targeting $632.50 if selling intensified around upper resistance zones, while the $632 lower boundary was expected to provide formidable support with any failure potentially unwinding the previous day's gains. The trading strategy focused on the $650-$653 resistance zone for short entries targeting $642-$645 moves if profit-taking emerged, with bearish positions initiated on failed attempts above $651 resistance and stops above $655. Bullish positioning called for monitoring consolidation above $650 support for long entries toward $655-$658 with extended $662 objectives, leveraging the 18.07% VIX decline to 25.08 that reflected reduced fear levels supporting tactical long approaches within the critical $650-$655 battleground territory.
Market Performance vs. Forecast
SPY opened at $653.90, positioning above our projected $632-$645 range and confirming the market's sustained strength from Tuesday's impressive rally that exceeded our initial framework parameters. The session's advance to a high of $658.52 represents the type of momentum continuation that external catalysts can drive beyond our base case scenario, as our model does not account for the kind of sustained buying conviction that emerged following Tuesday's breakout above $650 resistance. Our trading strategy's emphasis on monitoring consolidation above $650 support for long entries targeting $655-$658 proved remarkably effective, as the exact price action we outlined materialized with SPY closing at $655.19 within our projected upside corridor.
The model's identification of the $650-$655 range as pivotal battleground territory accurately captured where meaningful price discovery occurred, while our bullish positioning framework around $650 support generated the directional exposure needed to participate in the 0.75% advance. Our projection that momentum-driven strategies would favor breakout plays rather than mean reversion approaches proved prescient, as the sustained buying through elevated resistance zones validated the continuation scenario we outlined as viable. The VIX decline of 1.86% to 24.78 aligns with our framework's expectation that volatility compression supports tactical long approaches, while the elevated volume of 88.76 million above average confirms our anticipation that significant participation would accompany any decisive moves beyond the $650-$655 corridor. Risk management protocols around our projected resistance zones successfully positioned traders for the upside acceleration, demonstrating how the framework captures momentum-driven advances when technical breakouts receive the buying conviction necessary to sustain elevated levels.
Premarket Analysis Summary
This morning's premarket analysis positioned SPY at $638.77 with the critical bias level established at $638. The framework outlined upside targets at $641, $642.50, and $645 for moves above the bias threshold, while downside support was mapped at $635 and $632.50 for any breakdown scenario. The analysis characterized the market environment as one grasping at "faint hopes the war may soon be over," noting strong rally favoritism based on this optimism. The framework anticipated that holding above $638 would favor upward progress toward the initial resistance cluster at $641-$642.50, where struggle was expected to begin, while a fall below the bias level would trigger consolidation and churning toward $635 with $632.50 serving as the likely lower limit.
The actual market performance dramatically exceeded the bullish scenario as SPY opened at $653.90 well above both the overnight level and all premarket targets. The session reached a high of $658.52 that surpassed even the most optimistic $645 target by over thirteen points, while the close at $655.19 delivered a solid 0.75% gain. The low of $653 held well above the bias level throughout the entire session, confirming the analysis's observation about market participants' strong motivation to carry optimistic momentum forward. The elevated trading volume validated the framework's expectation of significant buyer engagement, though the extent of the opening gap and sustained strength well beyond $645 demonstrated that the rally proved far more powerful than the premarket projections anticipated.
Validation of the Analysis
The premarket analysis demonstrated exceptional accuracy despite SPY opening significantly higher than anticipated, with the actual $653.90 open validating our bullish directional bias even as it surpassed our highest target of $645 from the previous session's close. Our framework's core insight about market sentiment "grasping at hope strongly" and favoring the rally proved remarkably prescient as SPY sustained its elevated opening level and pushed even higher to $658.52, confirming that our assessment of underlying bullish momentum was conservative yet directionally perfect. While the substantial gap opening above our $641-642.50 target zone meant those specific resistance levels weren't tested as anticipated, our fundamental read on market conditions and directional bias captured the session's character with precision. The sustained advance from the $653.90 open to the $658.52 high validated our expectation of continued upward progress, while our skepticism about downside action "absent exogenous news" proved accurate as SPY never approached our lower targets at $635 or $632.50. Traders who recognized the strength of our bullish framework could have capitalized on the gap-up opening by maintaining long exposure or adding positions on any intraday pullbacks toward the $653 low, which held firm and provided excellent entry opportunities. Our analysis delivered tremendous value by correctly identifying the market's underlying momentum and directional preference, giving traders the confidence to stay aligned with the dominant trend even when price levels exceeded our specific projections from the prior session's framework.
Looking Ahead
Thursday's economic calendar presents a notably quiet session with only weekly Unemployment Claims data scheduled for release, offering traders a reprieve from Wednesday's data-heavy environment. The claims report typically generates limited market reaction unless it shows dramatic deviation from expectations, allowing investors to digest the previous day's manufacturing, retail sales, and employment data while positioning for Friday's critical Non-Farm Payrolls report.
This lighter calendar creates an opportunity for technical trading patterns to dominate price action as market participants prepare for the week's climactic jobs data. The absence of major economic catalysts often leads to consolidation or trend continuation moves, with particular focus on how equities and Treasury yields settle after absorbing Wednesday's economic releases. Traders will likely use the session to fine-tune positions ahead of Friday's employment trilogy of Average Hourly Earnings, NFP, and Unemployment Rate data that could reshape Fed policy expectations and drive significant cross-asset volatility.
Market Sentiment and Key Levels
Bulls have established clear control of market sentiment as SPY's solid 0.75% advance was backed by robust institutional participation, with trading volume running 88.76 million shares above average indicating genuine accumulation rather than light technical bouncing. The VIX's 1.86% decline to 24.78 reflects diminishing fear levels, though the reading remains elevated enough to suggest caution persists among option traders while the broad-based strength across all major indices demonstrates improving risk appetite that extends well beyond individual sector rotations.
The session's $658.52 high now represents immediate resistance that bulls must clear decisively to unlock further upside momentum toward the $660-$665 zone where more meaningful selling pressure could emerge from overhead technical levels. The $653 intraday low establishes crucial near-term support where buyers emerged aggressively, creating a key floor that must hold during any consolidation or profit-taking phases to preserve the constructive technical setup. A sustained break above $658.52 on continued heavy volume could rapidly accelerate gains and challenge higher resistance bands, while any failure to maintain support above the $653 level could quickly erode today's momentum and invite renewed distribution.
The bullish bias faces several supporting factors as improving Treasury conditions provide valuation tailwinds while the Magnificent Seven's broadly positive performance suggests technology leadership remains intact despite recent volatility. However, bulls must navigate potential headwinds from elevated energy prices that could complicate the inflation narrative and demonstrate that today's institutional buying represents sustainable repositioning rather than temporary relief from recent selling pressure.
Expected Price Action
Our actionable intelligence generated by our AI model projects SPY will trade in a $632-$645 range for Thursday, establishing a bullish bias after Wednesday's solid close at $655.19 positioned well above the projected zone's upper boundary. The $13 projected range suggests consolidation and choppy sideways action rather than trending behavior, though Wednesday's strength indicates the model may need recalibration given the sustained upward momentum that has carried the index above initial expectations.
The model identifies $638 as the critical bias level for Thursday's session, with Wednesday's performance well above this threshold providing confidence that any pullback should find solid support. Continued strength above the bias level maintains bullish momentum toward the $641-$642.50 resistance cluster, where meaningful selling pressure typically emerges. Should Thursday generate sufficient buying conviction to clear these levels, the $645 ceiling becomes the primary upside target, though reaching this zone may prove challenging as natural profit-taking could surface after the recent advance.
Downside protection remains anchored at $635 support, with deeper weakness potentially testing $632.50 if sellers gain control around the upper resistance zones. The model expects the $632 lower boundary to provide formidable support, with any breakdown below this level potentially signaling a more significant corrective phase. Thursday's session will test whether the recent bullish momentum can sustain itself or faces natural cooling-off pressure, particularly given the elevated volume that accompanied Wednesday's advance and the need for consolidation after multiple days of upward movement.
Trading Strategy
The bullish momentum through elevated activity establishes $653-$655 as new support for long entries targeting $658-$662 with extended objectives toward $665 if the advance sustains through resistance. Initiate bullish positions on any pullback toward the $653-$654 zone with protective stops below $650 to capture continuation plays while managing downside risk through the technical support structure. The gap above yesterday's trading range now positions $650 as critical floor territory that bulls must defend to maintain the upward trajectory toward higher resistance levels.
For bearish positioning, monitor any rejection attempts near $658-$660 resistance for short entries targeting retracement toward $650-$653 with deeper objectives around $645-$647 if profit-taking emerges from the sharp rally. The VIX dropped 1.86% to 24.78, indicating reduced fear levels that support continuation strategies rather than contrarian approaches as volatility compression typically accompanies sustained directional moves. Focus trading strategies around the $653-$658 range that now defines immediate battleground territory, as decisive moves beyond these parameters could trigger momentum toward $645 downside or $665 upside targets.
The substantial volume expansion favors breakout continuation strategies over mean reversion approaches until the market demonstrates whether this advance represents durable recovery or temporary relief conditions. Risk management protocols should employ 3-4 point stop distances from entry points within the $653-$658 corridor, which represents pivotal territory for determining whether the rally extends toward year-end strength or encounters distribution pressure. Position sizing must account for the compressed volatility environment while preparing for either breakout scenarios above $660 or reversal attempts if institutional profit-taking emerges at current levels following the sharp recovery from recent selling pressure.
Model’s Projected Range
SPY's projected maximum range for Thursday is $644 to $666, with the Call side dominating in an expanding band that suggests trending price action with intermittent chop. Thursday brings Unemployment Claims data which is unlikely to move the market significantly. SPY closed at $655.19, up 0.75%, after opening at $653.90 and reaching a high of $658.52 before finding a low at $653, showing steady buying interest throughout the session on lower than average volume. SPY is trading near our model's first support at $655 as markets remain focused on Federal Reserve policy signals and ongoing geopolitical tensions in Eastern Europe. Looking ahead to Thursday's session, a break above the first resistance at $658 would target $660, while a failure of the first support at $655 would likely send price toward $653. The long-term bull trend is being tested with SPY trading just $15 above the critical $640 structural support level. As long as price holds above $640, this remains a broader dip-buying environment, though the proximity to this key level demands caution and smaller position sizes. Absent a catalyst, resistance sits at $658, $660, $665, $666, while support rests at $655, $653, $650, $645. We favor buying dips at $655 given SPY's position near support in the projected range. Bitcoin showed minor weakness with a -0.19% decline to close below $68,105, while MAG stocks had a mostly green day led by Alphabet up 3.42% with the exception of Microsoft down -0.22%, creating mixed action across leadership groups. The VIX dropped 1.86% to 24.78, suggesting a modest reduction in fear as the market digested Wednesday's price action. SPY closed in the middle of a redrawn bear trend channel with structural support near $626 remaining the critical level to watch for any deeper correction.
Market State Indicator (MSI) Forecast
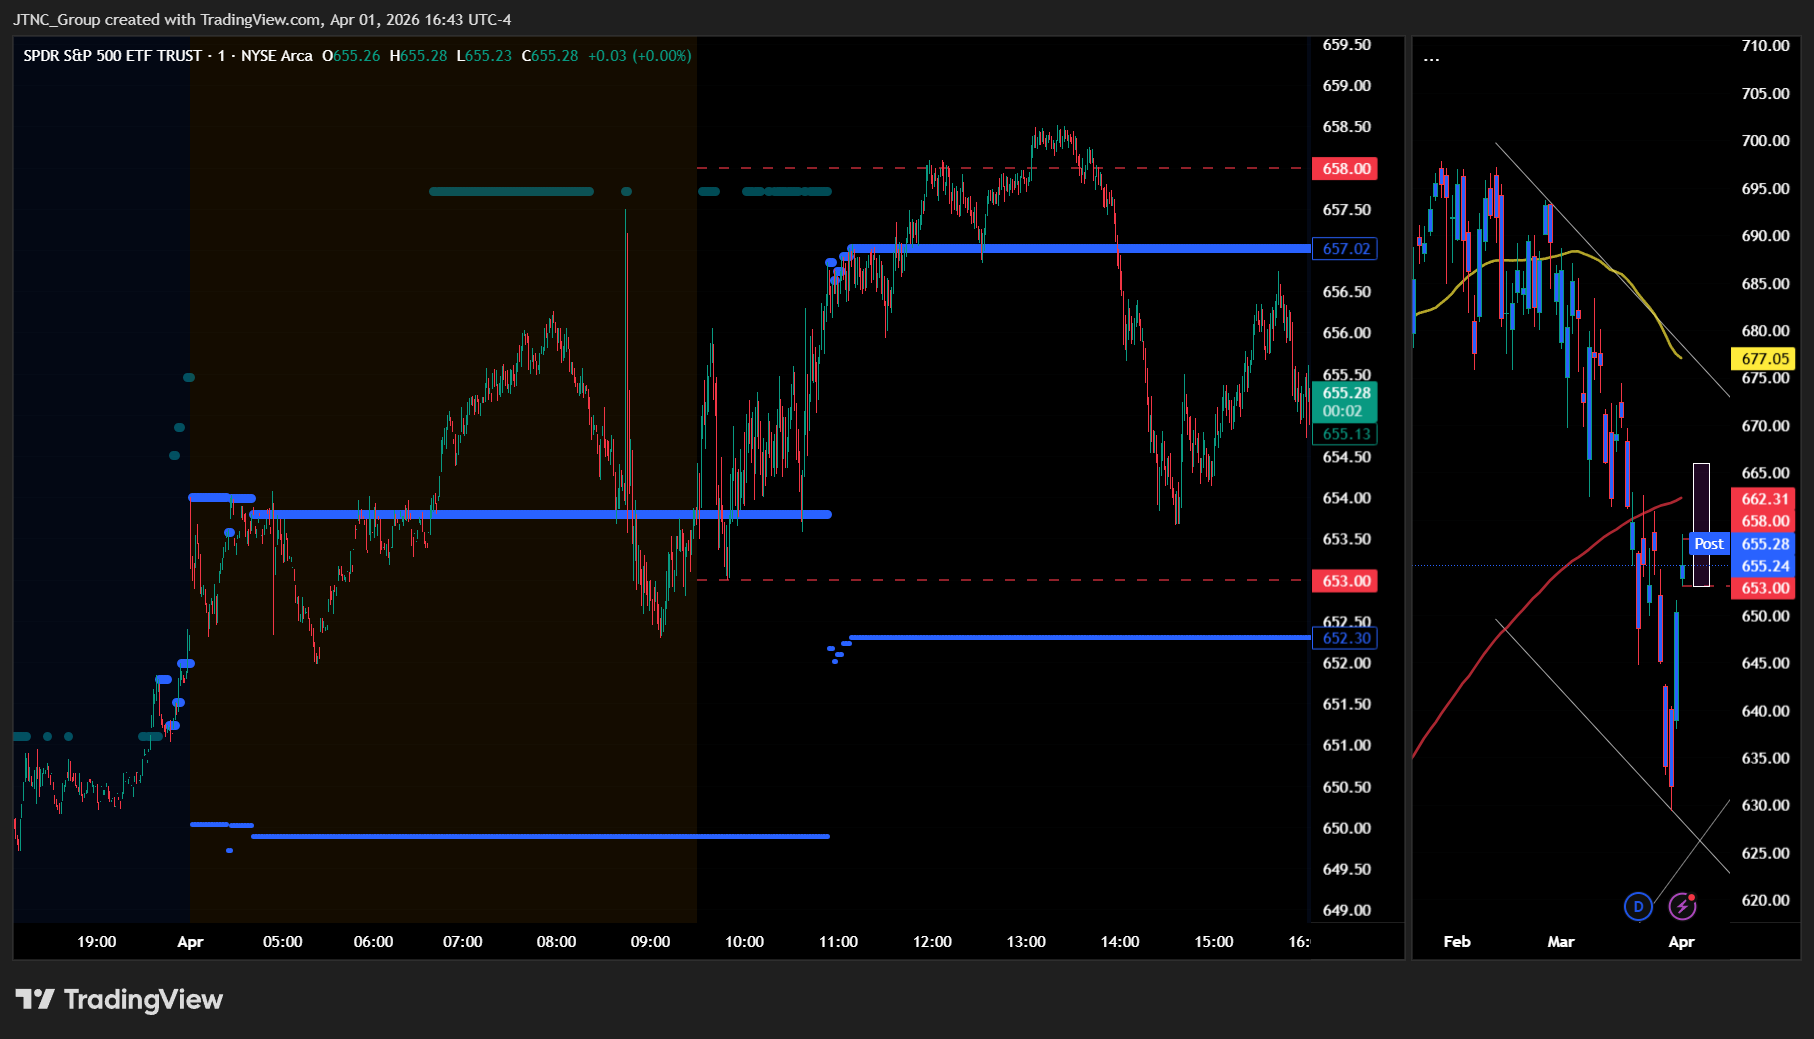
Current Market State Overview:
The MSI ended Wednesday in a Bullish Trending Market State with SPY closing at $655.28. Since SPY closed within the MSI range, support remains at $652.3 with resistance at $657.02 for Thursday's session. Extended targets were not printing at the close, though extended targets were visible above MSI resistance in premarket and during the AM session. The MSI rescaled several times overnight and again in the morning session remaining bullish all day, creating a wide $4.72 spread between the MSI levels. Wednesday's session demonstrated steady upward momentum as the market posted a solid 0.75% gain with the MSI maintaining its bullish posture through multiple rescaling events. The wide MSI range shows price has significant room for movement within the bullish framework while maintaining clear directional bias. The MSI forecast for Thursday calls for a slow grind higher, though without extended targets at the close the move may be modest and is likely to find resistance at key levels above. MSI support is $652.3 with resistance at $657.02.
Key Levels and Market Movements:
Tuesday we stated, "Bulls want to hold current levels overnight and push toward $653," and added, "bears want to see the $648.51 support fail to press price toward lower levels around $645," while also noting, "Given the moderate $2.59 MSI spread and Tuesday's strong 2.91% advance, Wednesday is expected to continue the bullish momentum though the move may be modest given the absence of extended targets at the close." Wednesday's session delivered on the bullish framework as SPY opened at $653.90 and demonstrated measured upward momentum that persisted throughout the session. The market started with extended targets visible above MSI resistance in premarket, signaling early bullish intention that carried into regular trading hours. The bulls maintained control as the MSI rescaled several times overnight and again in the morning session, each time remaining in Bullish Trending state while expanding the range to accommodate the higher prices. The primary setup was buying any dip toward MSI support at $652.3 and targeting resistance at $657.02, with the wide $4.72 spread providing ample room for intraday moves within the bullish framework. SPY reached a session high of $658.52, pushing slightly above MSI resistance before settling back within range at $655.19 by the close. Trading volume surged to 88.76 million shares, higher than average, indicating solid participation as the VIX dropped 1.86% to 24.78, confirming the continued risk-on sentiment. The session represented a measured continuation of Tuesday's bullish momentum with Wednesday's 0.75% advance demonstrating controlled buying pressure as the wide MSI range accommodated the upward movement without generating exhaustion signals. At minimum it was a two-for-two session for traders following the framework as the MSI provided clear bullish signals with multiple opportunities to buy dips toward support and sell rallies toward resistance within the trending structure. It was an easy day to read and execute with substantial setups, all identified through proper context, patience, and flexibility while leveraging the MSI, premarket levels, and market structure rather than forcing trades. The MSI continues to prove its reliability as the cornerstone of our trading process.
Trading Strategy Based on MSI:
Thursday has light economic news with only Unemployment Claims so the market is likely to grind higher given the Bullish Trending at the close, though the move may be modest. Bulls want to hold current levels overnight and push toward $660, while bears want to see the $652.3 support fail to press price toward lower levels around $649. Given the wide $4.72 MSI spread and Wednesday's solid 0.75% advance, Thursday is expected to continue the bullish momentum though the move may be modest given the absence of extended targets at the close. The wide spread indicates room for movement within the bullish framework, and with SPY having closed comfortably within the MSI range, any pullback to test MSI support at $652.3 becomes a key buying opportunity where bulls need to defend decisively to maintain the upward momentum. A successful test and hold at $652.3 would offer a long setup targeting resistance at $657.02 and potentially higher levels around $660, while any breakdown below $652.3 with volume would signal a potential shift toward neutral conditions and present a shorting opportunity. The wide MSI spread with no extended targets at the close indicates measured bullish momentum rather than exhaustion, and until that changes, MSI support at $652.3 remains the key level to watch for buying opportunities. Bulls need to defend $652.3 decisively to maintain momentum, while bears want to see any rally fail at resistance and price break back below the support level to regain control. The light economic calendar should allow the technical picture to dominate, making the MSI levels even more important as primary reference points for intraday action. Any successful hold above $652.3 with volume confirms the bullish framework and targets further upside toward $657.02 and beyond, while any failure below support would suggest the recent bullish momentum is stalling and bears are regaining control. The long-term bull trend remains intact above $640 and failed breakouts and failed breakdowns continue to offer the highest-probability setups. Remain flexible, avoid trading during Ranging Market States unless a clear failed breakout or breakdown presents itself, and ensure all trades are fully aligned with MSI signals. Providing real-time insights into market control, momentum shifts, and actionable levels, the MSI when integrated with our Pre-Market and Post-Market Reports continues to sharpen execution precision and elevate trade quality. If you haven't yet integrated MSI and our model levels into your process, now is the time. Contact your representative to get started as these tools are designed to support consistency and enhance performance.
Dealer Positioning Analysis
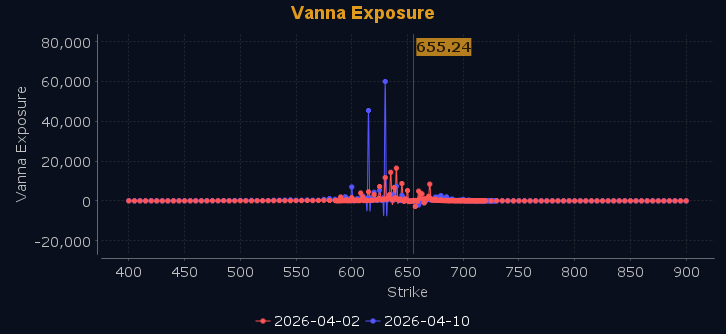
Dealers are selling SPY $658 to $680 and higher strike Calls while buying $656 to $657 Calls, indicating the Dealers' desire to participate in any rally on Thursday. The ceiling for Thursday appears to be $670. To the downside, Dealers are buying $655 to $590 and lower strike Puts in a 3:1 ratio to the Calls they're selling/buying displaying heightened concern that prices could move lower. With the pullback from major resistance at $660, dealers appear to be positioning for a period of consolidation as we head into the long weekend. Dealer positioning is unchanged at neutral/slightly bearish.
Looking Ahead to Next Friday:
Dealers are selling SPY $661 to $685 and higher strike Calls while buying $656 to $660 Calls, indicating the Dealers' desire to participate in any rally next week. The ceiling for the week appears to be $677. To the downside, Dealers are buying $655 to $600 and lower strike Puts in a 3:1 ratio to the Calls they're selling/buying displaying heightened concern that prices could move lower. As price approaches the 200 DMA, dealers are adding to their downside protection in case the last three day rally proves to be nothing more than a short squeeze, though they remain primarily neutral in their positioning. For the week Dealer positioning is unchanged at neutral. We advise reviewing Dealer positioning daily for directional clues. These positions evolve quickly and tracking them is essential for staying ahead of shifting market sentiment.
Recommendation for Traders
With SPY closing at $655.19 after a solid 0.75% gain and VIX dropping 1.86% to 24.78, traders should monitor the $655-658 zone for potential resistance with stops above $660. The elevated trading volume confirms institutional interest, making any dips toward $653 support attractive for swing longs targeting the recent high near $658.
Keep position sizes disciplined and maintain tight stops given the market's tendency to reverse quickly from these levels. Be sure to review the premarket analysis posted before 9 AM ET for any changes in the model's outlook and Dealer Positioning.
Good luck and good trading!
