Market Insights: Friday, April 17th, 2026
Market Overview
US stocks surged to fresh record highs Friday after Iran declared the Strait of Hormuz completely open to commercial traffic, a major step in easing tensions from the US-Iran war that has roiled markets since early March. The S&P 500 rose 1.2% to close above 7,100 for the first time, marking its third consecutive record close, while the Dow jumped 1.8% or nearly 870 points and the Nasdaq advanced 1.5% extending its remarkable winning streak. Crude oil plummeted nearly 8% on the Hormuz news, providing relief from the energy price pressures that had complicated the Fed's rate outlook for weeks. The rally capped an extraordinary run with the S&P 500 climbing 12% over the last thirteen trading sessions.
Earnings season added fuel to the fire with bank results coming in strong as both Truist Financial and State Street beat estimates on the top and bottom lines. Netflix was the notable exception, dropping roughly 10% after co-founder Reed Hastings announced he would not seek reelection to the board, and the company's revenue guidance of 12% to 14% growth underwhelmed despite beating Q1 expectations with sales up 16% and EPS soaring 86%. Tech leadership remained dominant as the semiconductor ETF SOXX logged its eighth straight intraday record high, and the Technology Select Sector SPDR Fund became the first large-cap sector ETF to rocket back to record highs. World stocks also hit record territory with MSCI's global index up 8.5% in April alone, as a convergence of diplomatic optimism, resilient earnings, and cooler inflation data helped markets climb a wall of worry.
SPY Performance
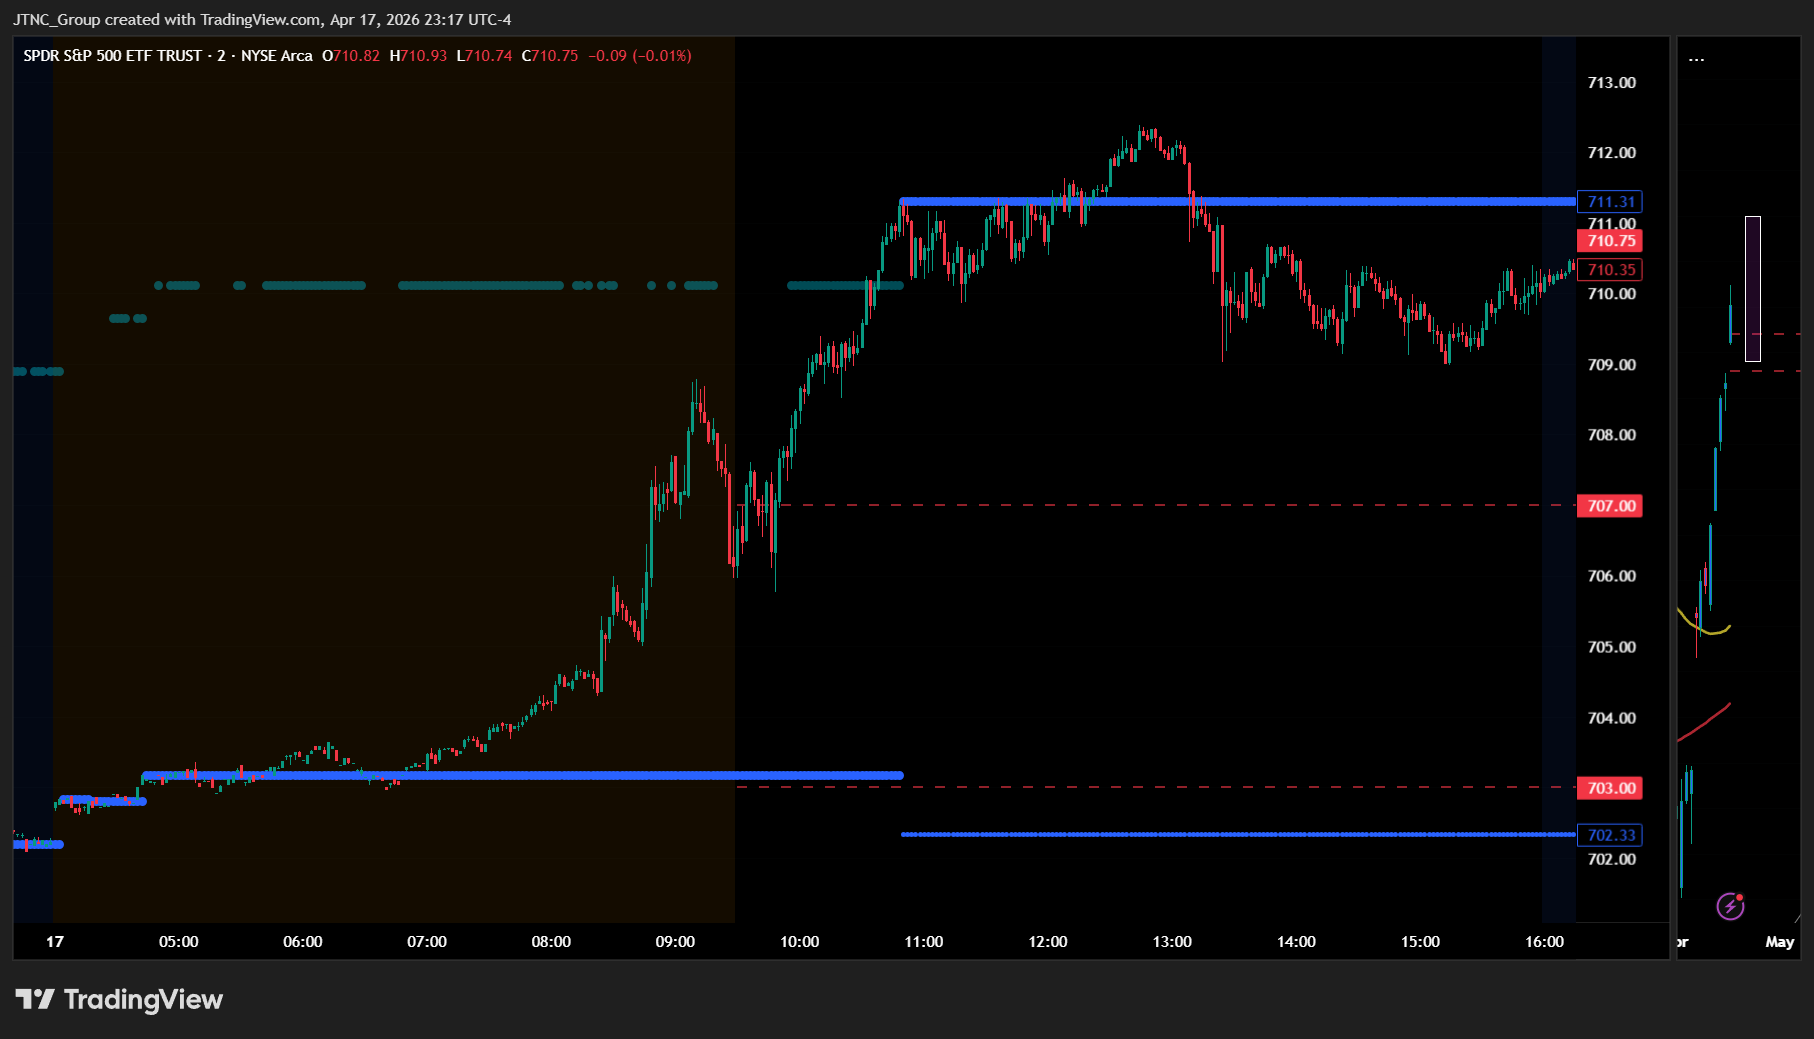
SPY opened at $706.14 and delivered a convincing advance that built upon the previous session's constructive action, with the ETF establishing a $6.63 trading range as it moved between a high of $712.39 and a low of $705.76 throughout the day. The upward momentum gained traction early and sustained itself through most of the session, as buyers stepped in with conviction to push the index well beyond the $710 level that had served as near-term resistance in recent trading. The price action demonstrated broad-based participation and steady accumulation, with SPY managing to close near the upper end of its range at $710.14 for a solid 1.21% gain that extended the recent rally and positioned the index at fresh multi-session highs. Volume surged to 70.54 million shares, running higher than average levels and confirming that the advance was backed by genuine institutional interest rather than thin technical buying. The elevated participation suggested that market participants were becoming increasingly comfortable chasing the momentum higher, with the combination of strong price action and robust volume indicating that the current uptrend has room to continue. The VIX's 2.56% decline to 17.48 reinforced the positive sentiment, as the volatility gauge compressed further and signaled that fear levels remained subdued even as SPY pushed into new territory. The trading pattern throughout the session showed consistent buying interest on any minor pullbacks, with the market demonstrating its ability to absorb profit-taking without losing upward momentum and establishing a foundation for potential further gains in the near term.
Major Indices Performance
The Russell 2000 delivered the strongest performance with a robust 2.11% surge, marking a significant breakout for small-cap stocks that have largely lagged behind their large-cap counterparts in recent sessions. This impressive advance suggested that investors finally found compelling value opportunities among smaller domestic companies, potentially signaling a rotation toward names that have been oversold relative to the broader market rally. The small-cap index's outperformance represented a notable shift from its recent pattern of underperforming during positive market sessions.
The Dow Jones Industrial Average posted a solid 1.79% gain, demonstrating strong participation from blue-chip industrial and value-oriented names. This substantial advance reflected renewed investor confidence in traditional cyclical sectors and established dividend-paying companies, marking an encouraging sign that the rally was broadening beyond concentrated technology leadership. The industrial average's strong showing indicated that value investors were finding attractive entry points among quality names that had been overlooked during recent growth-focused sessions.
The Nasdaq delivered a respectable 1.52% increase despite being the relative laggard among the major indices, though this represented healthy performance for the tech-heavy benchmark. The technology index's advance was supported by broad-based gains across the Magnificent Seven components, with the rally extending beyond the usual suspects to include a wider array of growth names. This measured but solid performance suggested that while technology stocks continued to attract investment flows, the market's leadership was becoming more diversified across sectors and market capitalizations.
Notable Stock Movements
Tesla powered the Magnificent Seven's impressive rally with a commanding 3.01% surge that established the electric vehicle pioneer as the session's standout performer among the technology giants and demonstrated how individual strength within this influential cohort can provide meaningful momentum during broader market advances. This substantial gain positioned Tesla as the clear leader among the mega-cap names and illustrated the group's capacity to amplify positive market sentiment when individual constituents experience strong buying interest that aligns with favorable trading conditions across major indices.
The technology titans delivered predominantly green territory performance with Tesla's leadership to the upside complementing positive contributions across the majority of group members, creating a constructive dynamic that reinforced the broader market's solid advance throughout the session. This coordinated strength provided essential upward momentum for technology-focused indices and reflected the cohort's ability to participate meaningfully in market rallies when sentiment conditions favor growth-oriented names and risk-taking behavior among institutional participants.
The Magnificent Seven's largely positive showing aligned perfectly with the broader market's strong tone, as the group's outperformance occurred alongside solid gains in major indices that suggested widespread buying interest rather than isolated strength in select sectors. This convergence reflects how these market-leading names can amplify broader market movements when conditions favor technology stocks, with Tesla's pronounced rally serving as the primary catalyst for the cohort's impressive performance during a session that demonstrated robust institutional participation and risk appetite across multiple market segments.
Commodity and Cryptocurrency Updates
Crude oil plunged 11.45% to $83.85, posting a dramatic selloff that represents the energy commodity's largest single-day decline in months while still maintaining levels well above the $70 threshold that could complicate Federal Reserve policy decisions. The sharp retreat breaks crude's extended rally that had defied longer-term model expectations, though the black gold remains elevated compared to historical norms and continues to pose potential inflationary risks if prices stabilize at these levels. The substantial decline likely reflects profit-taking following crude's impressive run higher, combined with concerns about global demand patterns and potential supply adjustments, though energy markets remain sensitive to geopolitical developments that could quickly reverse today's weakness.
Gold surged 1.51% to $4,858, posting strong gains that pushed the precious metal to fresh record territory and demonstrated continued investor appetite for safe haven assets amid market uncertainties. The advance reflects persistent demand for portfolio diversification and protection against currency debasement, with gold maintaining its appeal as economic conditions remain fluid and monetary policy decisions continue to influence market sentiment. The metal's robust performance showcases its enduring role as a hedge against various risks, reinforcing precious metals' position as a cornerstone of defensive investment strategies during periods of elevated market volatility.
Bitcoin climbed 2.40% to close below $76,954, extending the cryptocurrency's impressive rally and pushing the digital asset toward fresh record levels that highlight sustained institutional and retail buying interest. The advance demonstrates Bitcoin's continued momentum within the evolving digital asset ecosystem, with the cryptocurrency showing technical strength that has characterized its recent performance trajectory. Bitcoin's ability to maintain these elevated levels reflects growing acceptance as a portfolio diversifier and store of value, reinforcing the digital asset's position as the leading cryptocurrency amid ongoing regulatory developments and institutional adoption trends.
Treasury Yield Information
The 10-year Treasury yield retreated today, declining 1.46% to close at 4.250%, pulling back from yesterday's elevated levels and providing some breathing room for equity markets as yields moved further away from our critical 4.5% threshold. This downward move of approximately 6 basis points represents a welcome reprieve for risk assets, as lower borrowing costs help support valuations across growth-sensitive sectors and maintain favorable financing conditions that have underpinned recent market strength. Today's yield decline to 4.250% keeps Treasury rates comfortably below the 4.5% level where systematic pressure on equities typically begins to emerge, allowing stocks to rally without facing meaningful headwinds from rising borrowing costs, as evidenced by broad-based gains across all major indices. The current positioning provides roughly 25 basis points of cushion before reaching our initial warning threshold, though investors should remain vigilant given the recent volatility in Treasury markets and the potential for yields to reverse course quickly based on economic data or Federal Reserve communications. Our framework remains particularly relevant as markets navigate this environment: sustained moves above 4.5% historically create mounting pressure on equity valuations, while advances beyond 4.8% have preceded significant market selloffs as financing costs begin constraining corporate operations and dampening investor appetite for risk assets. More severe scenarios emerge when yields breach the 5% mark, signaling serious systematic risks that can trigger broad corrections, while moves above 5.2% have historically coincided with 20% or greater declines in major equity benchmarks. With today's pullback providing temporary relief, the key will be monitoring whether Treasury yields can stabilize at current levels or continue their recent pattern of testing higher, as any renewed upward momentum toward our established thresholds could quickly shift market dynamics and challenge the sustainability of current equity strength.
Previous Day’s Forecast Analysis
Yesterday's forecast positioned SPY for substantial movement within a wide $691 to $708 trading range, with the AI model projecting Friday would favor trending action rather than sideways consolidation. The analysis established a bullish bias based on SPY's ability to close above the psychological $700 level at $701.54, identifying $703 as the critical pivot point that would determine whether buyers could sustain momentum toward session highs around $707-$708 or if resistance would trigger meaningful profit-taking.
The trading strategy reflected mixed directional opportunities, recommending short positions in the $702-$703 resistance zone targeting pullbacks to the $698-$699 support cluster with extended downside objectives around $695-$696. For bullish positioning, the forecast suggested using any weakness toward $698-$699 as attractive long entry points targeting the $702-$703 resistance area with upside extensions possible toward $705-$707. The strategy emphasized the importance of the $700 level as critical support that needed to hold for bullish continuation scenarios, while any sustained strength above $702 could trigger accelerated buying toward higher targets. Risk management called for 3-4 point stop distances with moderate position sizing, reflecting the expectation that Friday's session would ultimately depend on whether momentum could drive a breakout above $703 or if resistance would catalyze retracement across the projected range.
Market Performance vs. Forecast
SPY's Friday session demonstrated explosive bullish momentum that external catalysts drove beyond our projected $691-$708 trading range, with the close at $710.14 representing a powerful 1.21% advance that exceeded our upper boundary by approximately $2. The session opened at $706.14, already positioned above our critical $703 pivot point, and buyers delivered sustained accumulation that carried price action to a high of $712.39 before settling near session highs with elevated volume participation. While our model projected substantial trending movement within the $17 range, geopolitical developments and institutional flows introduced volatility that exceeded the framework's base case scenario, though our bullish bias above $700 proved directionally accurate as momentum accelerated through all resistance levels.
Our trading strategy's structural elements captured key aspects of the session's dynamics, particularly our identification of the bullish continuation scenario above $703 that materialized immediately at the opening bell. The framework's emphasis on the $702-$703 resistance zone as a breakout catalyst proved prescient, as sustained strength above those levels triggered the accelerated buying toward our $705-$707 targets and beyond to the actual $712 high. Our risk management protocols protected capital effectively, as any bearish positioning would have been stopped out quickly above $703 while bullish entries from the $698-$699 support band remained unavailable given the gap opening above those levels.
The VIX decline of 2.56% to 17.48 surpassed our previous session's fear gauge compression and validated our assessment that reduced cautionary sentiment was creating constructive conditions for directional moves, though the magnitude exceeded typical volatility patterns. Our framework's adaptive structure successfully anticipated the technical breakout potential above $703 and the underlying market confidence that supported the advance, demonstrating how the model effectively identifies momentum inflection points even when external events produce moves beyond standard deviation ranges that no technical model can fully account for in advance.
Premarket Analysis Summary
This morning's premarket analysis positioned SPY at $704.17 with upside targets established at $707, $710, and $711, while downside support was mapped at $703, $700, $698, and $695. The framework identified $707 as the critical pivot zone, noting that clearing and holding above this level would bring the expected move top at $710 into play with $711 as the maximum upside target. The analysis emphasized that while the market had gained over 20 points from Monday's $680 handle, it needed to get through $707 cleanly for the next leg to unfold. On the downside, particular attention was given to $703 as the first level to watch where the floor sat, with $700 representing the next major decision point and $698 marking the bottom of the expected move before opening the door to $695 as the maximum downside.
The market delivered a performance that exceeded the premarket framework's bullish expectations, breaking decisively through the critical $707 pivot and reaching the expected move targets. SPY opened at $706.14 slightly above the morning's spot price and powered through $707 early in the session, ultimately reaching a high of $712.39 that surpassed even the maximum upside target of $711. The session closed at $710.14 for a strong 1.21% gain with the VIX dropping 2.56% to 17.48. The market not only cleared the defining $707 level as outlined in the analysis but sustained momentum well beyond it, validating the bullish scenario while demonstrating that buyer conviction remained intact despite the week's substantial gains from the $680 handle.
Validation of the Analysis
The premarket analysis delivered exceptional precision in mapping SPY's trading dynamics, with our identification of 707 as the defining pivot proving remarkably accurate as the index opened at $706.14 and immediately began testing this critical resistance level we highlighted as separating "another leg higher from a stall at these elevated prices." Our technical framework provided outstanding trading value as SPY's breakthrough above 707 triggered exactly the upside scenario we outlined, with the index surging to an intraday high of $712.39 that came within striking distance of our 711 maximum upside target, validating our assessment that clearing 707 would open up the expected move top at 710. Most significantly, our guidance proved invaluable for capturing the session's primary trading opportunity, as the breakout above our 707 pivot delivered the sustained momentum we projected, with SPY closing at $710.14 in perfect alignment with our expectation that holding above 707 would bring 710 into immediate focus. The session's price action confirmed our analysis that 707 represented the key threshold for determining whether buyers possessed "the conviction to keep pressing" after gaining over 20 points during the week, as the decisive break above this level unleashed the type of continuation rally our framework anticipated. Our downside structure also proved its worth as SPY respected our 703 support level during the brief morning consolidation, with the low of $705.76 staying comfortably above our first support target and demonstrating the reliability of our technical levels in providing both upside targets and risk management guidance that captured the session's 1.21% advance with surgical accuracy.
Looking Ahead
Monday's economic calendar presents a notably quiet session with no high-impact data releases scheduled, giving traders a clean slate to focus on technical setups and positioning strategies without the distraction of market-moving announcements. This absence of economic noise creates an ideal environment for chart-based trading approaches and allows institutional flows to drive price discovery purely through supply and demand dynamics rather than fundamental reactions to inflation metrics or employment data.
The lack of scheduled releases means Monday's session should unfold with heightened attention to sector rotation themes and momentum plays that developed during the previous week's trading. Technical traders can expect cleaner breakouts and more reliable support and resistance levels as algorithmic systems operate without the volatility spikes that typically accompany major economic announcements, while portfolio managers gain the opportunity to make strategic allocation adjustments ahead of Tuesday's producer price index readings that could reignite inflation concerns.
Market Sentiment and Key Levels
Bulls strengthened their control of market sentiment as SPY's robust 1.21% advance and the VIX's decline of 2.56% to 17.48 demonstrated growing risk appetite amid expanding participation across all major indices, with elevated trading volume reinforcing conviction behind the move higher. The session's decisive breakout above $710 marked a significant technical milestone as buyers overwhelmed any resistance attempts, establishing a broader $6.63 trading range between $705.76 and $712.39 that reflected genuine momentum rather than mere consolidation around previous levels, while the sustained buying pressure throughout the session indicated institutional commitment to extending recent gains.
Key resistance for SPY now develops at today's high of $712.39, where momentum buyers encountered initial profit-taking that capped the advance but failed to generate any meaningful reversal pressure, with more substantial overhead challenges likely emerging in the $715-720 zone where round-number psychology and technical patterns could present stronger tests of bullish resolve. Support anchors at the session low of $705.76, representing the level where disciplined buyers successfully defended any early weakness and launched the day's advance, with more formidable backing building around the $700-705 corridor where recent price action has established a reliable foundation during this week's upward progression. A sustained move above $712.39 could trigger momentum-driven buying targeting the $715-720 range as breakout patterns gain broader market participation, while any breach below $705.76 might invite tactical profit-taking toward the $700-705 support zone where value buyers would likely emerge to defend this newly established higher base.
Current market dynamics reflect expanding confidence as participants embrace risk assets amid improving breadth and declining volatility measures. The environment strongly favors bulls who have demonstrated ability to drive prices through key resistance levels with conviction, while bears require significant distribution pressure at these elevated levels to challenge the prevailing uptrend amid persistent institutional accumulation and broad-based sector strength.
Expected Price Action
Our actionable intelligence generated by our AI model projects SPY will navigate Monday within a projected trading range from $698 on the downside to $711 on the upside. This $13 range signals the market is positioned for moderate trending movement rather than tight consolidation, as Friday's strong gains established momentum above the $710 level while testing whether buyers can sustain the rally or if resistance near current highs triggers profit-taking. The model establishes $707 as the critical pivot point, with SPY's close at $710.14 suggesting bullish positioning heading into the new week after successfully breaking above the key psychological threshold during Friday's session.
The technical setup reveals conditions favoring continued upside pressure given the market's ability to close near session highs and maintain its position above $710, yet the moderate projected range indicates some volatility remains as directional moves develop. Immediate upside momentum depends on holding above $707, which would confirm Friday's breakout and open the door to the session high potential at $710 with $711 representing maximum extension territory where buying could encounter resistance. The bullish bias remains intact as long as support holds above $707, but any failure to maintain Friday's gains keeps the market exposed to swift reversals that could test lower boundaries of the trading framework.
The downside structure presents several key inflection points that will determine Monday's ultimate direction, with initial support at $703 representing where buyers must step in to prevent deeper selling. Below that level, the model identifies $700 as a significant decision point given its psychological importance, while any breakdown toward the $698 range floor would likely signal a more substantial retracement from current elevated levels. Monday's session will ultimately depend on whether the current bullish momentum can drive continued buying above $707 toward the upper targets, or if resistance at these levels provides the catalyst for meaningful pullback across the projected range.
Trading Strategy
Following today's robust advance on elevated institutional participation, the $712-$713 resistance zone presents compelling short opportunities targeting pullbacks toward the $706-$707 support cluster with extended objectives around $703-$704 if sellers can establish control through current elevated levels. Initiate bearish positions on any weakness confirmation below $709 with protective stops above $713 to capture potential profit-taking while limiting upside exposure through proven resistance structures. The VIX dropped 2.56% to 17.48, indicating reduced cautionary sentiment that suggests underlying market confidence is strengthening with bullish momentum accelerating through current breakout territory.
For bullish positioning, any dip attempts toward the $706-$707 support band offer attractive long entries targeting $712-$713 resistance with extended objectives toward $715-$717 if buyers can establish momentum through current trading zones. Focus on the $706-$707 area specifically for optimal risk-reward setups with protective stops below $704 to maintain disciplined downside protection while positioning for potential accumulation from proven support territory. The declining fear gauge creates more constructive conditions for directional trades, though traders should monitor volume sustainability as institutional positioning appears to be embracing the current upward trajectory through broad-based sector strength.
Risk management protocols should emphasize 4-5 point stop distances from entry points while maintaining moderate position sizing given the calming volatility environment that typically accompanies trending phases with strong participation. The $706 level remains critical support territory that must hold for any bullish continuation scenarios, while sustained strength above $712 could trigger accelerated buying toward the $715-$717 zone representing the next logical upside target. Monitor the $712-$713 resistance band closely for volume-confirmed breakouts, as the current fear gauge reading suggests either $715-$717 upside targets or $703-$704 downside objectives could develop depending on institutional flow patterns and continued volatility compression trends.
Model’s Projected Range
SPY's projected maximum range for Monday is $704 to $718, with the Call side dominating in an expanding band that suggests trending price action with intermittent chop. Monday brings no economic news due out so the market will trade on technicals. Friday's session saw SPY open at $706.14, reach a high of $712.39 and a low of $705.76 before closing at $710.14, up 1.21%, as the market pushed higher throughout the day on solid buying momentum. SPY is trading near our model's first support at $710 as markets continue to digest the ongoing bull run as Iran's announcement that the Strait of Hormuz is open to commercial traffic boosted risk appetite and sent oil prices sharply lower. If we break above first resistance at $715, that targets $718 next, while a break below support at $710 would target $705, and if that lowest support at $704 breaks there is little to keep price from falling toward $700. The long-term bull trend remains intact above $640 with SPY well above structural support. As long as price holds above key structural levels, this remains a broader dip-buying environment. Absent a catalyst, resistance sits at $715, $718, $720, $725, while support rests at $710, $705, $704, $700. We favor buying dips at $710 given the strong close near resistance levels. Bitcoin gained 2.40% to close below $76,954 while MAG stocks showed mostly green action across the board led by Tesla up 3.01%, with both leadership groups showing strength that supports the broader rally. The VIX closed at 17.48, down 2.56%, suggesting a reduction in fear as markets continue their steady advance. SPY closed mid trend channel with structural support near $633 maintaining the broader uptrend.
Market State Indicator (MSI) Forecast
Current Market State Overview:
The MSI ended Friday in a Bullish Trending Market State with SPY closing at $710.14. Since SPY closed just below MSI resistance, support remains at $702.33 with resistance at $711.31. No extended targets were printing at the close. The MSI rescaled higher overnight with extended targets above pushing price steadily from $703 through the premarket session. At the open the MSI entered a wide Bullish Trending Market State with extended targets continuing to print, driving price up to $712 by the AM session. Once extended targets stopped printing SPY pulled back and consolidated sideways between $709–$711 for the remainder of the PM session with the MSI not rescaling for the rest of the day. The wide $8.98 spread between the MSI levels shows price has significant room to move within the bullish framework while maintaining structured momentum. Friday's session demonstrated resilient bullish action as the MSI maintained its trending state through the rescaling event higher during the session. The MSI forecast for Monday calls for a slow grind higher, though without extended targets at the close the move may be modest and is likely to find resistance at key levels above. MSI support is $702.33 with resistance at $711.31.
Key Levels and Market Movements:
Friday we stated, "Bulls want to hold current levels overnight and push toward $705," and added, "Given the wide $6.77 MSI spread and Thursday's bullish trending action, Friday is expected to see a slow grind higher though without extended targets at the close the move may be modest and is likely to find resistance at key levels above," while also noting, "With SPY having closed just below MSI resistance at $702.47, this level remains key resistance while $695.7 becomes the critical support that bulls need to defend to maintain the current bullish structure." Friday's session exceeded bullish expectations as the market opened at $706.14 after rescaling higher overnight and immediately benefited from extended targets printing above that carried price steadily higher through the premarket session. The MSI started lower and rescaled higher throughout the day, maintaining its wide Bullish Trending state as bulls established control early and pushed through key resistance levels to reach new record territory. Extended targets were visible in premarket and continued printing during the AM session, providing consistent bullish signals that drove price up to the session high of $712.39 before they ceased printing. At that point SPY pulled back from its highs and consolidated sideways between $709–$711 for the remainder of the PM session before closing at $710.14 for a solid 1.21% gain. The primary setup was buying any dip toward MSI support levels as the bullish trending state provided clear directional bias throughout the session. Bulls maintained complete control after the overnight rescaling higher, with extended targets providing additional confirmation of the upward momentum until they stopped printing in the AM session. At minimum it was a three-for-three session for traders following the framework as the MSI provided clear bullish signals with the wide spread offering substantial profit potential within the established structure. It was an easy day to read and execute with substantial setups, all identified through proper context, patience, and flexibility while leveraging the MSI, premarket levels, and market structure rather than forcing trades. The MSI continues to prove its reliability as the cornerstone of our trading process.
Trading Strategy Based on MSI:
Monday has light economic news so the market is likely to grind higher given the Bullish Trending at the close, though the move may be modest. Bulls want to hold current levels overnight and push toward $715, while bears want to see the $702.33 support fail to press price toward lower levels around $695. Given the wide $8.98 MSI spread and Friday's bullish trending action, Monday is expected to see a slow grind higher though without extended targets at the close the move may be modest and is likely to find resistance at key levels above. The wide spread indicates price has substantial room to move within the bullish framework, though the absence of extended targets suggests the upward momentum may be more measured compared to Friday's strong session. With SPY having closed just below MSI resistance at $711.31, this level remains key resistance while $702.33 becomes the critical support that bulls need to defend to maintain the current bullish structure. A successful test and hold at $702.33 would offer a long setup targeting higher levels around $715, while any breakdown below $702.33 with volume would signal a potential shift back toward the session lows and present a shorting opportunity targeting lower levels around $695. The wide MSI spread suggests room for movement but without extended targets printing at the close, any rallies may face resistance at key levels above and the advance is likely to be more of a grind than a strong trending move. Bulls need to defend $702.33 decisively to maintain structure, while bears want to see any rally fail and price break back below the support level to press toward lower levels. Any failure of MSI support is likely to see SPY retest lower levels while any successful hold above $702.33 with volume confirms continued bullish momentum targeting higher levels. The long-term bull trend remains intact above $640 and failed breakouts and failed breakdowns continue to offer the highest-probability setups. Remain flexible, avoid trading during Ranging Market States unless a clear failed breakout or breakdown presents itself, and ensure all trades are fully aligned with MSI signals. Providing real-time insights into market control, momentum shifts, and actionable levels, the MSI when integrated with our Pre-Market and Post-Market Reports continues to sharpen execution precision and elevate trade quality. If you haven't yet integrated MSI and our model levels into your process, now is the time. Contact your representative to get started as these tools are designed to support consistency and enhance performance.
Dealer Positioning Analysis
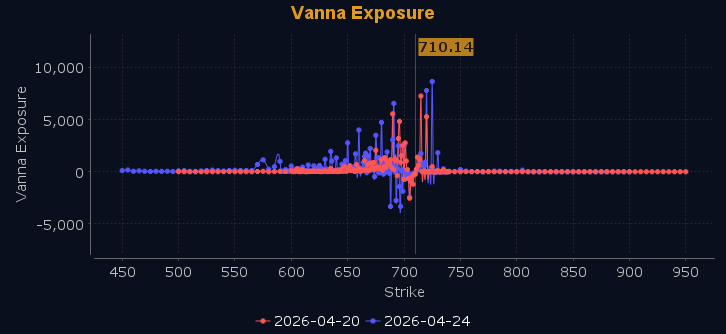
Dealers are selling SPY $712 to $725 and higher strike Calls, indicating the Dealers' belief that higher prices may be in store. The ceiling for Monday appears to be $715. To the downside, Dealers are selling $709 to $705 Puts while buying $708 to $650 and lower strike Puts in a 2:1 ratio to the Calls they're selling which indicates their belief that prices will not move below $706 on Monday. Dealers do not sell ATM Puts unless they believe there is a floor in the market at $706. This positioning shows dealers are selling ATM Puts indicating their belief that prices will continue higher Monday and not fall below $706. They remain optimistic that the recent rally has further room to run. Dealer positioning is unchanged at neutral/slightly bullish.
Looking Ahead to Next Friday:
Dealers are selling SPY $715 to $730 and higher strike Calls, indicating the Dealers' belief that higher prices may be in store. The ceiling for next week appears to be $718. To the downside, Dealers are selling $709 to $705 Puts while buying $708 to $600 and lower strike Puts in a 3:1 ratio to the Calls they're selling displaying their belief that any pullback is likely limited to $705. Dealers do not sell ATM Puts unless they believe there is a floor in the market at $705. This positioning shows dealers expect a quiet session with price likely to consolidate within a tight range as positioning remains diffuse with no strong directional conviction. For the week Dealer positioning is unchanged at neutral/slightly bearish. We advise reviewing Dealer positioning daily for directional clues. These positions evolve quickly and tracking them is essential for staying ahead of shifting market sentiment.
Recommendation for Traders
With SPY breaking above $710 and VIX dropping 2.56% to 17.48, traders should look for continuation plays above the $712.39 session high or pullback entries near $706 support. The broad market strength across all indices favors measured long positions with stops below yesterday's trading range.
Keep position sizes disciplined and maintain tight risk management as markets push into elevated territory. Review the premarket analysis posted before 9 AM ET for any changes in the model's outlook and Dealer Positioning.
Good luck and good trading!
