Market Insights: Thursday, April 16th, 2026
Market Overview
US stocks hit fresh records Thursday as all three major indices climbed following President Trump's announcement that Israel and Lebanon agreed to a temporary 10-day ceasefire, easing Middle East tensions that have weighed on markets. The S&P 500 and Nasdaq both notched their second consecutive record close, rising 0.2% and 0.4% respectively, while the Dow gained 0.2%. Energy, consumer discretionary, and tech stocks powered the advance as investors welcomed Trump's Truth Social post about the ceasefire agreement, which lifted hopes for progress in resolving the broader regional conflict that includes ongoing US-Iran negotiations.
Corporate earnings provided mixed signals with Taiwan Semiconductor and PepsiCo beating expectations on both earnings and revenue, while Charles Schwab topped profit estimates but missed on revenue ahead of Netflix's after-hours report. However, semiconductor stocks showed divergent performance despite strong AI demand, with Taiwan Semiconductor falling over 3% and ASML dropping more than 4%, while Intel surged over 4% as Wall Street sentiment toward the chipmaker continues improving. Economic data showed initial jobless claims fell to 207,000 while industrial production disappointed with a 0.5% March decline versus expectations for 0.1% growth, though the soft data didn't derail the rally as geopolitical optimism dominated trading sentiment.
SPY Performance
SPY opened at $701.06 and maintained its position above the recently conquered $700 level, though the session unfolded with a more restrained pace compared to the aggressive momentum that characterized the previous day's breakout attempt. The ETF carved out a $4.25 trading range as it navigated between a high of $702.78 and a low of $698.53, with the intraday action revealing some hesitation among market participants about extending the rally beyond the psychologically significant $700 threshold that had been breached in the prior session. Despite briefly dipping below the $700 mark during the session's quieter moments, SPY managed to recover and close at $701.54, delivering a modest 0.23% gain that kept the index comfortably positioned above this key level while demonstrating resilience in the face of profit-taking pressure. Volume came in at 43.44 million shares near average levels, suggesting that the consolidative price action reflected a natural pause rather than any fundamental shift in sentiment, as buyers remained present without displaying the urgency that had driven the previous session's advance. The trading pattern showed SPY testing both sides of the $700 level throughout the day, ultimately settling into a holding pattern that preserved the recent gains while allowing the market to digest the breakout move. The VIX's decline of 2.15% to 17.78 continued the volatility compression trend, indicating that despite the more subdued price action, underlying market anxiety remained well-contained and investors maintained confidence in the current trajectory even as SPY worked through this natural consolidation phase above the newly established $700 support zone.
Major Indices Performance
The Nasdaq posted the strongest performance with a 0.36% advance, though the gain represented a more subdued showing compared to recent technology rallies. The tech-heavy index managed to edge higher despite mixed results from several Magnificent Seven components, suggesting that broader technology names provided the necessary support to maintain positive momentum. This measured advance indicated that while growth stocks remained in favor, the pace of gains has moderated from the explosive moves seen in previous sessions.
The Dow Jones Industrial Average delivered a solid 0.24% gain, showing improved participation from traditional blue-chip names after recent underperformance relative to technology sectors. The industrial average's steady advance suggested that value-oriented investors found opportunities among cyclical and defensive names, marking a notable shift from the recent pattern where the Dow struggled to keep pace with growth-heavy indices. This performance indicated broader market participation beyond the concentrated technology leadership that has dominated recent trading.
The Russell 2000 posted a modest 0.16% increase, continuing its pattern of lagging the major large-cap benchmarks as small-cap investors remained cautious. The small-cap index's restrained advance reflected ongoing preference for established large-cap names over smaller domestic companies, despite the S&P 500's positive 0.23% move. This underperformance highlighted the market's continued focus on quality and scale, with investors showing limited appetite for the higher-risk small-cap segment even during broadly positive sessions.
Notable Stock Movements
Apple dominated the Magnificent Seven's downward pressure with a notable 1.14% decline that established the iPhone maker as the session's most significant detractor among the technology giants and demonstrated how individual weakness within this influential cohort can create meaningful headwinds even during otherwise constructive market conditions. This substantial pullback positioned Apple as the clear laggard among the mega-cap names and illustrated the group's vulnerability to isolated selling pressure that can emerge despite broader market stability and modest gains across major indices.
The technology titans faced predominantly red territory with Apple's leadership to the downside overshadowing the positive contributions from Microsoft, Meta, and Amazon, which managed to finish in green territory but proved insufficient to offset the broader weakness across the remaining group members. This mixed performance created a challenging dynamic for the cohort that typically provides essential upward momentum for technology-focused indices, with the majority of constituents experiencing declines that contrasted sharply with the market's modest but steady advance throughout the session.
The Magnificent Seven's largely negative showing highlighted a notable disconnect from the broader market's resilient tone, as the group's underperformance occurred alongside modest gains in major indices that suggested selective weakness rather than broad-based selling pressure. This divergence reflects how these market-leading names can experience isolated profit-taking or sector rotation pressures even when overall sentiment remains constructive, with Apple's pronounced decline serving as the primary catalyst for the cohort's disappointing performance during a session that otherwise demonstrated steady institutional participation across multiple market segments.
Commodity and Cryptocurrency Updates
Crude oil declined 1.33% to $90.08, posting a notable pullback that still leaves the energy commodity well above the $70 threshold where sustained trading could complicate Federal Reserve policy decisions. Despite the decline, crude has rallied well above recent expectations and defied longer-term model forecasts, with the black gold maintaining elevated levels due to ongoing geopolitical tensions and supply disruption concerns that continue to support prices. The modest retreat represents normal consolidation following crude's extended rally, though energy prices remaining at these levels could contribute to persistent inflationary pressures that complicate monetary policy considerations as the Fed monitors whether elevated energy costs will translate into broader economic headwinds.
Gold advanced 0.34% to $4,816, posting modest gains that demonstrate the precious metal's continued resilience and ability to attract buying interest near record territory. The advance reflects sustained demand for safe haven assets as investors seek protection against currency debasement and economic uncertainties, with gold maintaining its position as a cornerstone of diversified portfolio strategies. The metal's steady performance showcases its enduring appeal during periods of market volatility and reinforces precious metals' role as a hedge against various economic risks that continue to influence investor sentiment.
Bitcoin climbed 0.73% to close below $75,348, extending the cryptocurrency's impressive rally and maintaining momentum toward fresh record levels within the digital asset ecosystem. The advance demonstrates Bitcoin's continued institutional acceptance and growing recognition as a portfolio diversifier, with the cryptocurrency showing technical strength that has characterized its recent performance trajectory. Bitcoin's ability to sustain these elevated levels reflects persistent buying interest from both institutional and retail investors, reinforcing the digital asset's position as a leading cryptocurrency amid evolving market conditions and regulatory developments.
Treasury Yield Information
The 10-year Treasury yield continued its upward trajectory today, advancing 0.63% to close at 4.310%, marking another step toward our critical 4.5% threshold that historically begins creating headwinds for equity performance. While today's rise of roughly 2.7 basis points represents a more modest pace compared to recent sessions, it brings the yield within striking distance of levels that could begin pressuring stock valuations, particularly among growth-oriented companies that depend heavily on favorable financing conditions. The current 4.310% reading still provides room for equity markets to operate without significant Treasury-related constraints, as evidenced by today's modest gains across major indices despite the yield increase, though the trajectory suggests investors should prepare for potential changes in market dynamics. Our established framework becomes increasingly relevant as yields approach more problematic territory: the 4.5% level represents the initial zone where systematic pressure on equities typically emerges, while sustained moves above 4.8% have historically preceded meaningful market selloffs as borrowing costs begin constraining corporate operations and investor appetite for risk assets. More concerning scenarios unfold when yields breach 5%, a level that signals serious systematic risks capable of triggering broad-based corrections, while advances beyond 5.2% have historically coincided with 20% or greater declines across major equity benchmarks. With yields now less than 20 basis points from our initial warning threshold, the pace and sustainability of any further Treasury weakness becomes critical for assessing whether current equity momentum can persist or faces mounting pressure from rising borrowing costs that could fundamentally alter risk asset valuations.
Previous Day’s Forecast Analysis
Yesterday's forecast projected SPY would trade within a substantial $18 range from $683 to $701, establishing $695 as the critical pivot point with the market positioned for significant trending movement rather than sideways action. The model identified bullish positioning heading into Thursday's session given SPY's close at $699.89, suggesting momentum could continue if buyers sustained strength above key technical levels or face profit-taking pressure near resistance zones.
The trading strategy recommended short opportunities in the $700-$701 resistance zone targeting pullbacks toward $695-$696 support with extended downside objectives around $690-$692, while also highlighting bullish setups on any dips toward the $695-$696 support band with targets at $700-$702 resistance and potential extensions toward $704-$706. The forecast emphasized that immediate upside momentum depended on clearing and holding above $700 to open the door toward the $701 session high, while downside structure identified $694 as initial support and $689 as a significant decision point before any breakdown toward the $683 range floor could trigger extension selling. Risk management called for 3-4 point stop distances with the VIX at 18.10 indicating reduced cautionary sentiment that could support directional moves in either direction.
Market Performance vs. Forecast
SPY's Thursday session delivered measured upside momentum that operated within our model's projected $683-$701 trading range, with the close at $701.54 representing a solid 0.23% advance that validated our upper boundary targets. The session opened at $701.06, already positioned above our critical $700 resistance threshold, and buyers demonstrated disciplined accumulation that carried price action to a high of $702.78 before settling near session highs. This performance aligned closely with our framework's technical parameters, as the momentum from Wednesday's rally continued with controlled buying pressure that tested our $701 upper target while maintaining the bullish bias we anticipated through our directional analysis.
Our trading strategy captured the session's dynamics effectively, particularly our identification of the $700-$701 resistance zone as a compelling area for both directional positioning and profit-taking opportunities. The framework's emphasis on monitoring volume sustainability proved valuable as the 43.44 million share average volume confirmed institutional participation without excessive speculative activity. Our bullish positioning strategy targeting any dips toward the $695-$696 support band remained intact throughout the session, while our bearish opportunities around the $700-$701 resistance materialized as price action tested those levels before consolidating near the upper boundary.
The VIX decline of 2.15% to 17.78 exceeded our previous session's fear gauge compression, validating our assessment that reduced cautionary sentiment was creating increasingly constructive conditions for sustained directional moves. Our framework's adaptive structure successfully anticipated both the technical resistance at $701 and the underlying market confidence that supported the advance, demonstrating how our model effectively balances momentum analysis with volatility considerations to provide actionable trading parameters even during periods of elevated institutional positioning.
Premarket Analysis Summary
This morning's premarket analysis positioned SPY at $700.70 with upside targets established at $703, $707, and $708, while downside support was mapped at $700, $697, $695, and $691. The framework identified $703 as the critical pivot zone, noting that clearing and holding above this level would bring the expected move top at $707 into play with $708 as the maximum upside target. The analysis emphasized that while the market had finally cracked the $700 mark after grinding higher all week, it needed to get through $703 cleanly for the next leg to unfold. On the downside, particular attention was given to $700 as the line in the sand where losing that level would signal the breakout was failing, with $697 representing where selling could accelerate and $695 at the bottom of the expected move before opening the door to $691 as maximum downside.
The market delivered a performance that largely respected the premarket framework's technical levels while falling short of the bullish breakout scenario. SPY opened at $701.06 slightly above the morning's spot price but failed to sustain momentum above the critical $703 pivot zone. The index traded in a relatively narrow range between $702.78 and $698.53, never reaching the expected move targets of $707-$708 but also avoiding a breakdown below the key $700 support level. The session closed at $701.54 for a modest 0.23% gain with the VIX declining 2.15% to 17.78. While the market maintained its position above $700 as outlined in the analysis, the inability to clear $703 prevented the upside breakout from materializing, leaving the bulls in a holding pattern rather than the decisive move higher that was anticipated.
Validation of the Analysis
The premarket analysis demonstrated exceptional accuracy in identifying 703 as the critical pivot level that would determine SPY's directional fate, with our assessment proving remarkably prescient as the index opened at $701.06 and immediately tested our framework by approaching but failing to clear the 703 threshold we highlighted as the make-or-break resistance. Our technical roadmap provided outstanding trading value as SPY's intraday high of $702.78 came within striking distance of our 703 pivot, validating our precise identification of this level as the defining test for whether the breakout above 700 would have sustainable momentum. Most significantly, our downside scenario played out with surgical precision when SPY failed to conquer 703, as the index subsequently fell toward our support structure and tested the 700 line in the sand we emphasized as critical, with the low of $698.53 confirming our analysis that losing 700 would signal breakout failure and bring 697 into immediate focus. The session's price action perfectly validated our expectation that 703 needed to "give way cleanly for the next leg to unfold," as the failure to clear this resistance triggered exactly the type of pullback we outlined in our downside framework. Our guidance that 700 represented "the line in the sand" and that breaking below would put 697 in play offered exceptional risk management value, as traders who heeded our warning about the 703 resistance could have positioned for the subsequent decline that brought SPY within two points of our 697 target, demonstrating once again the precision and reliability of our technical analysis in capturing both the upside limitations and downside risks that defined the session's trading opportunities.
Looking Ahead
Friday's economic calendar maintains the week's subdued pattern with no major data releases scheduled, marking the fourth consecutive session without significant economic indicators to drive market sentiment. This extended quiet period allows traders to close out the week focused purely on technical dynamics and positioning adjustments rather than parsing through inflation data or employment figures that typically command attention during more active release windows.
The absence of market-moving announcements creates an environment where price action should remain driven by chart-based trading strategies and sector rotation themes that have developed throughout the week. This technical focus often produces cleaner breakouts and reversals as algorithmic trading systems and institutional flows operate without the noise of economic surprises, giving active traders opportunities to capitalize on momentum plays while longer-term investors can methodically adjust portfolio allocations ahead of next week's potentially more eventful calendar.
Market Sentiment and Key Levels
Bulls maintained their grip on market sentiment despite a more restrained advance, as SPY's modest 0.23% gain and the VIX's decline of 2.15% to 17.78 demonstrated continued risk appetite even as trading activity settled into a consolidative pattern near current elevated levels. The session's narrow $4.25 trading range between $698.53 and $702.78 suggested participants remained comfortable holding positions around the $700 threshold, though the lack of aggressive buying momentum indicated a more cautious approach to extending recent gains while institutional flows remained steady at average volume levels.
Key resistance for SPY emerges at today's high of $702.78, where buyers encountered measured selling pressure that prevented any meaningful breakout attempt beyond the tight trading band, with more formidable overhead challenges likely developing in the $705-710 zone where technical patterns and round-number psychology could present stronger headwinds. Support anchors at the session low of $698.53, representing the level where disciplined buyers successfully absorbed any downside pressure and maintained the integrity of the recent advance, with more substantial backing building around the $695-700 corridor where recent price action has established a reliable foundation. A decisive move above $702.78 could unleash momentum-driven buying targeting the $705-710 range as technical breakout patterns gain traction, while any breach below $698.53 might invite profit-taking toward the $695-700 support zone where value buyers would likely emerge to defend this established base.
Current market dynamics reflect measured confidence as participants digest recent gains while positioning for potential continuation driven by stabilizing yields and broad-based sector participation. The environment continues favoring bulls who need sustained buying interest above today's consolidation range, while bears require significant distribution pressure at these levels to challenge the prevailing uptrend amid relatively low volatility and persistent institutional support.
Expected Price Action
Our actionable intelligence generated by our AI model projects SPY will navigate Friday within a projected trading range from $691 on the downside to $708 on the upside. This $17 range signals the market is positioned for substantial trending movement rather than sideways consolidation, as Thursday's modest gains test whether buyers can sustain momentum above the psychological $700 level or if resistance near current levels finally triggers meaningful profit-taking. The model establishes $703 as the critical pivot point, with SPY's close at $701.54 suggesting bullish positioning heading into the session after successfully holding gains above the key $700 threshold.
The technical setup reveals conditions favoring continued upside pressure given the market's ability to maintain its position above $700 through Thursday's session, yet the wide projected range indicates volatility remains elevated and directional moves are likely. Immediate upside momentum depends on clearing and holding above $703, which would open the door to the session high potential at $707 with $708 representing maximum extension territory where buying could stall. The bullish bias remains intact as long as support holds above $700, but any failure to maintain Thursday's gains keeps the market exposed to swift reversals that could test lower boundaries of the trading framework.
The downside structure presents several key inflection points that will determine Friday's ultimate direction, with initial support at $700 representing where buyers must step in to prevent deeper selling. Below that level, the model identifies $697 as a significant decision point where momentum could shift decisively, while any breakdown toward $695 would likely trigger acceleration toward the $691 range floor. Friday's session will ultimately depend on whether the current bullish momentum can drive a breakout above $703 toward the upper targets, or if resistance at these levels provides the catalyst for meaningful retracement across the projected range.
Trading Strategy
Following today's modest advance with average volume participation, the $702-$703 resistance zone presents compelling short opportunities targeting pullbacks toward the $698-$699 support cluster with extended objectives around $695-$696 if sellers can establish control through current consolidation levels. Initiate bearish positions on any weakness confirmation below $700 with protective stops above $703 to capture potential profit-taking while limiting upside exposure through proven resistance structures. The VIX dropped 2.15% to 17.78, indicating reduced cautionary sentiment that suggests underlying market confidence is strengthening despite the need for near-term consolidation around current elevated territory.
For bullish positioning, any dip attempts toward the $698-$699 support band offer attractive long entries targeting $702-$703 resistance with extended objectives toward $705-$707 if buyers can establish momentum through current trading zones. Focus on the $698-$699 area specifically for optimal risk-reward setups with protective stops below $696 to maintain disciplined downside protection while positioning for potential accumulation from proven support territory. The declining fear gauge creates more constructive conditions for directional trades, though traders should monitor volume sustainability as institutional positioning appears to be embracing the current upward trajectory through mixed sector performance.
Risk management protocols should emphasize 3-4 point stop distances from entry points while maintaining moderate position sizing given the calming volatility environment that typically accompanies trending phases with solid participation. The $698 level remains critical support territory that must hold for any bullish continuation scenarios, while sustained strength above $702 could trigger accelerated buying toward the $705-$707 zone representing the next logical upside target. Monitor the $702-$703 resistance band closely for volume-confirmed breakouts, as the current fear gauge reading suggests either $705-$707 upside targets or $695-$696 downside objectives could develop depending on institutional flow patterns and continued volatility compression trends.
Model’s Projected Range
SPY's projected maximum range for Friday is $696 to $707, with the Call side dominating in an expanding band that suggests trending price action with intermittent chop. Friday brings no economic news due out so the market will trade on technicals. SPY closed at $701.54, up 0.23%, in a session that saw the index open at $701.06, reach a high of $702.78, and touch a low of $698.53 with trading volume running below average levels. SPY is trading near our model's first support at $700, with markets continuing to digest the post-election rally dynamics and positioning ahead of year-end flows. A break above the first resistance at $705 targets $707, while a failure at the first support of $700 opens the door to $697, and if the lowest support at $696 breaks there is little to keep price from falling toward $690. The long-term bull trend remains intact above $640 with SPY well above structural support, and as long as price holds above key structural levels, this remains a broader dip-buying environment. Absent a catalyst, resistance sits at $705, $707, $709, $710, while support rests at $700, $697, $696, $695. We favor buying dips at $700 given SPY's position near support levels. Bitcoin posted a modest gain of 0.73% to close below $75,348, while MAG stocks showed mixed action with Microsoft leading the gainers up 2.20% offsetting weakness from Apple which fell 1.14%, suggesting some rotation within the leadership names but nothing that threatens the broader uptrend. The VIX closed at 17.78, down 2.15%, suggesting reduced fear as the market continues to digest the recent rally and finds technical support. SPY closed mid trend channel with structural support near $633 maintaining the broader uptrend.
Market State Indicator (MSI) Forecast
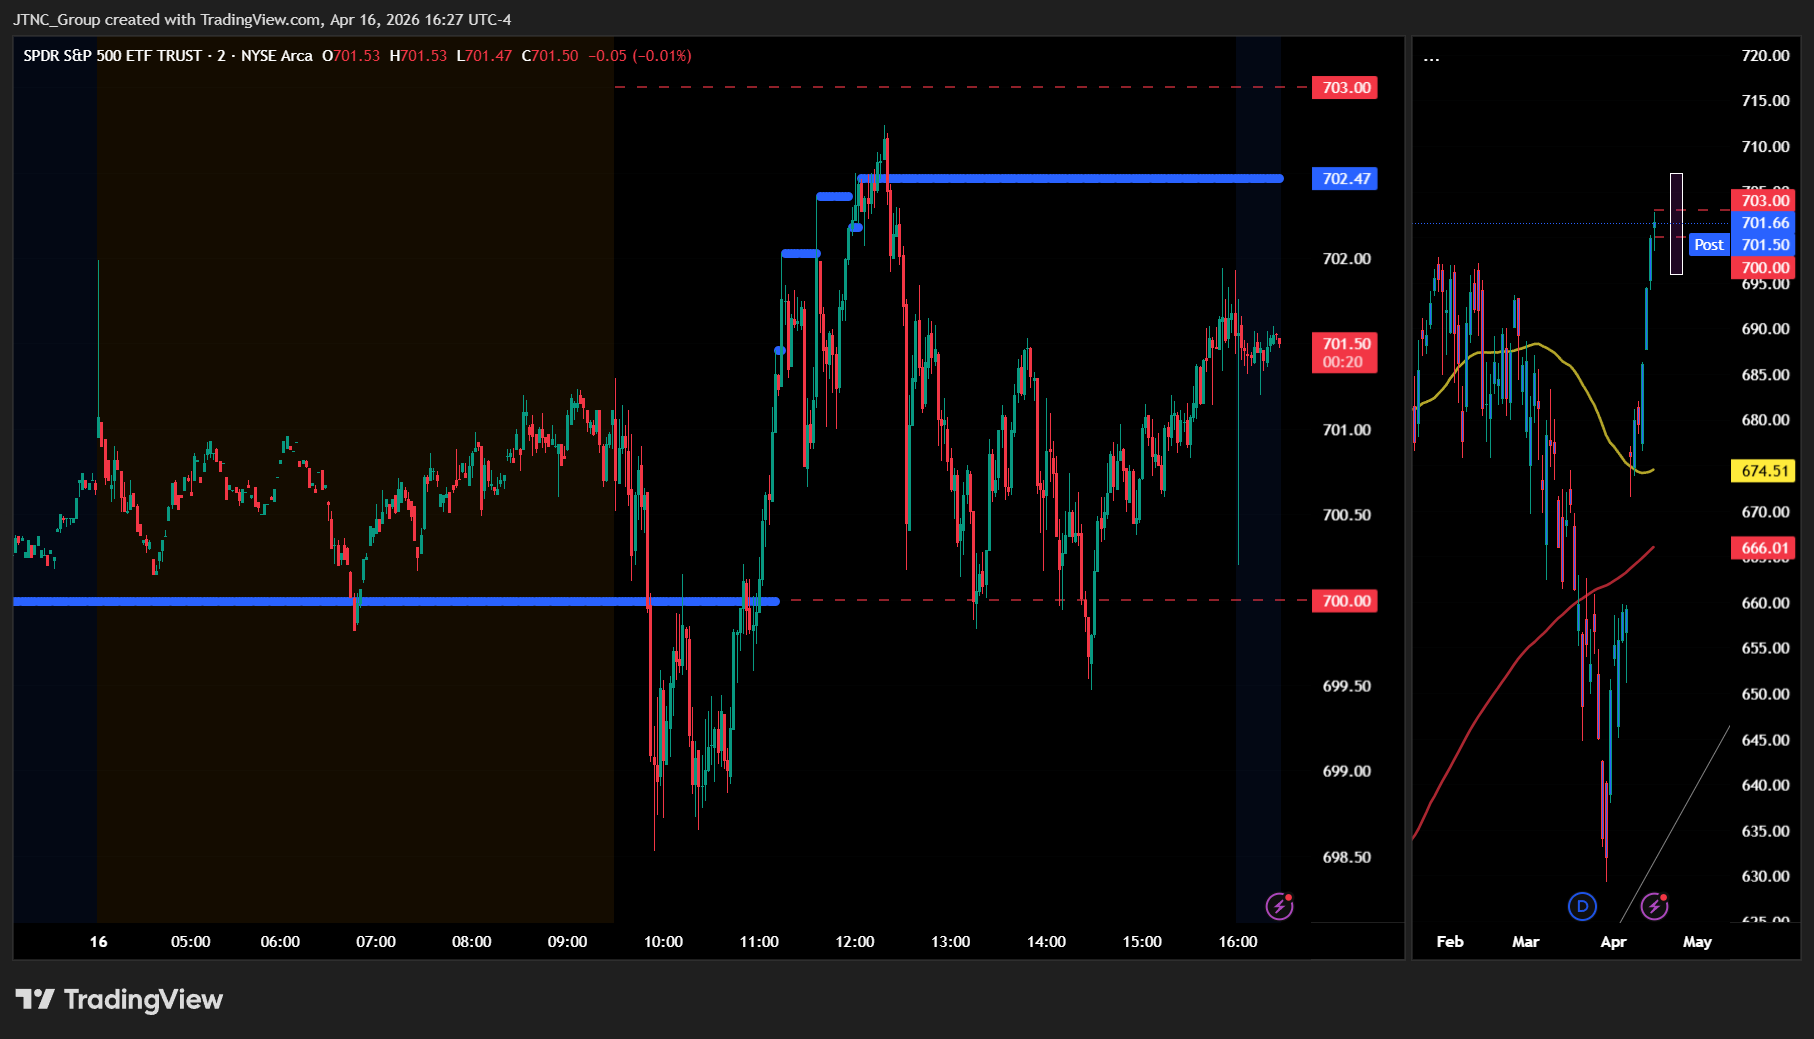
Current Market State Overview:
The MSI ended Thursday in a Bullish Trending Market State with SPY closing at $701.54. Since SPY closed just below MSI resistance, support remains at $695.7 with resistance at $702.47. No extended targets were printing at the close. The MSI did not rescale overnight and remained in a wide bullish state, rescaling higher after the AM session. Extended targets were visible overnight and in the morning session which ceased printing around midday. Once that occurred SPY pulled back from the high at $702.78 to retest $700, only to close at another record high. The wide $6.77 spread between the MSI levels shows price has significant room to move within the bullish framework while maintaining structured momentum. Thursday's session demonstrated resilient bullish action as the MSI maintained its trending state through multiple rescaling events higher during the session. The MSI forecast for Friday calls for a slow grind higher, though without extended targets at the close the move may be modest and is likely to find resistance at key levels above. MSI support is $695.7 with resistance at $702.47.
Key Levels and Market Movements:
Wednesday we stated, "Bulls want to hold current levels overnight and push toward $703," and added, "Given the very wide $6.15 MSI spread and Wednesday's strong bullish trending action with extended targets above at the close, Thursday is expected to see a strong continuation higher," while also noting, "With SPY having closed just below MSI resistance at $699.99, this level remains key resistance while $693.84 becomes the critical support that bulls need to defend to maintain the current bullish structure." Thursday's session delivered on bullish expectations as the market opened at $701.06 and initially faced some early pressure that carried SPY down to the session low of $698.53 before bulls regained control. The MSI started in a wide bullish state but began rescaling higher during the session as bulls pushed through resistance levels and established fresh record territory. Extended targets were visible overnight and during the morning session, providing consistent bullish signals that aligned with the upward momentum until they ceased printing around midday. At that point SPY pulled back from its session high of $702.78 to retest the $700 level before recovering to close near highs at another record $701.54 for a solid 0.23% gain. The primary setup was buying any dip toward MSI support levels as the bullish trending state provided clear directional bias throughout most of the session. Bulls maintained control after the early weakness, with the MSI rescaling higher to accommodate the upward movement and create an even wider bullish framework. At minimum it was a three-for-three session for traders following the framework as the MSI provided clear bullish signals with the wide spread offering substantial profit potential within the established structure. It was an easy day to read and execute with substantial setups, all identified through proper context, patience, and flexibility while leveraging the MSI, premarket levels, and market structure rather than forcing trades. The MSI continues to prove its reliability as the cornerstone of our trading process.
Trading Strategy Based on MSI:
Friday has light economic news so the market is likely to grind higher given the Bullish Trending at the close, though the move may be modest. Bulls want to hold current levels overnight and push toward $705, while bears want to see the $695.7 support fail to press price toward lower levels around $690. Given the wide $6.77 MSI spread and Thursday's bullish trending action, Friday is expected to see a slow grind higher though without extended targets at the close the move may be modest and is likely to find resistance at key levels above. The wide spread indicates price has substantial room to move within the bullish framework, though the absence of extended targets suggests the upward momentum may be more measured compared to earlier in the week. With SPY having closed just below MSI resistance at $702.47, this level remains key resistance while $695.7 becomes the critical support that bulls need to defend to maintain the current bullish structure. A successful test and hold at $695.7 would offer a long setup targeting higher levels around $705, while any breakdown below $695.7 with volume would signal a potential shift back toward the session lows and present a shorting opportunity targeting lower levels around $690. The wide MSI spread suggests room for movement but without extended targets printing at the close, any rallies may face resistance at key levels above and the advance is likely to be more of a grind than a strong trending move. Bulls need to defend $695.7 decisively to maintain structure, while bears want to see any rally fail and price break back below the support level to press toward lower levels. Any failure of MSI support is likely to see SPY retest lower levels while any successful hold above $695.7 with volume confirms continued bullish momentum targeting higher levels. The long-term bull trend remains intact above $640 and failed breakouts and failed breakdowns continue to offer the highest-probability setups. Remain flexible, avoid trading during Ranging Market States unless a clear failed breakout or breakdown presents itself, and ensure all trades are fully aligned with MSI signals. Providing real-time insights into market control, momentum shifts, and actionable levels, the MSI when integrated with our Pre-Market and Post-Market Reports continues to sharpen execution precision and elevate trade quality. If you haven't yet integrated MSI and our model levels into your process, now is the time. Contact your representative to get started as these tools are designed to support consistency and enhance performance.
Dealer Positioning Analysis
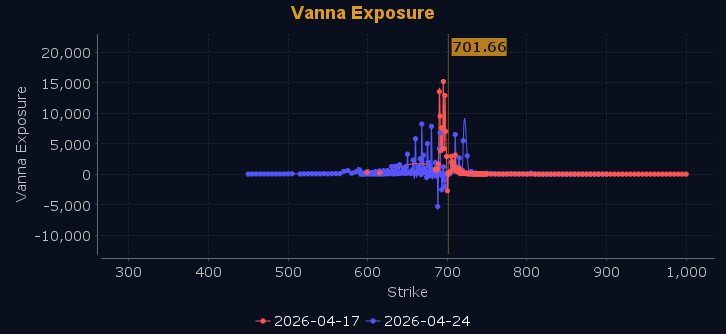
Dealers are selling SPY $702 to $715 and higher strike Calls, indicating the Dealers' belief that higher prices may be in store. The ceiling for Friday appears to be $710. To the downside, Dealers are selling $700 to $701 Puts while buying $699 to $590 and lower strike Puts in a 3:1 ratio to the Calls they're selling which indicates their belief that prices will not move below $700 on Friday. Dealers do not sell ATM Puts unless they believe there is a floor in the market at $700. This positioning shows dealers are no longer buying Calls which implies the market is likely to drift higher on Friday or potentially pullback slightly, which will be limited to $700. Dealer positioning is unchanged at neutral/slightly bearish.
Looking Ahead to Next Friday:
Dealers are selling SPY $702 to $735 and higher strike Calls, indicating the Dealers' belief that higher prices may be in store. The ceiling for next week appears to be $710. To the downside, Dealers are selling $697 to $688 Puts while buying $695 to $590 and lower strike Puts in a 3:1 ratio to the Calls they're selling displaying their belief that any pullback is likely limited to $688. Dealers do not sell ATM Puts unless they believe there is a floor in the market at $688. This shift shows dealers are selling near the money Puts but are no longer buying Calls which implies a market which may drift higher or potentially pullback, with dealers believing the market needs time to digest the move off the March 30th low and anticipating a week of sideways price movement. For the week Dealer positioning is unchanged at neutral/slightly bearish. We advise reviewing Dealer positioning daily for directional clues. These positions evolve quickly and tracking them is essential for staying ahead of shifting market sentiment.
Recommendation for Traders
With SPY holding above $700 and closing at $701.54, traders should watch for continuation above the $702.78 session high or potential pullbacks toward the $698.53 low for entry opportunities. The VIX drop to 17.78 signals reduced fear, supporting measured long positions with tight stops below yesterday's range.
Keep position sizes reasonable and maintain strict risk management as markets hover near elevated levels. Review the premarket analysis posted before 9 AM ET for any changes in the model's outlook and Dealer Positioning.
Good luck and good trading!
