Market Insights: Monday, April 13th, 2026
Market Overview
US stocks staged an impressive comeback Monday, closing near session highs as growing hopes of an Iranian peace deal overshadowed President Trump's escalating threats in the Strait of Hormuz standoff. The Dow rallied 0.6% while the S&P 500 gained nearly 1% after erasing earlier losses, and the tech-heavy Nasdaq jumped 1.2% on a massive software stock rally. The turnaround came after Trump revealed that Iranian leadership contacted his administration Monday morning "to work out a deal," even as he maintained his blockade of maritime traffic through the critical energy chokepoint and threatened to destroy any Iranian ships that interfere.
Software stocks delivered their best performance in nearly a year, with the iShares software ETF surging after what technical analysts called a "false breakdown" below key support levels on Friday. Heavy hitters like Microsoft, Oracle, Palantir, Salesforce, and Palo Alto Networks led the charge higher, providing crucial momentum for the broader tech recovery. Oil prices retreated from recent highs with Brent crude gaining just over 1% to trade near $98 while West Texas Intermediate hovered below that level, reflecting the market's cautious optimism about potential diplomatic progress.
Wall Street strategists are increasingly confident that stocks have found their footing, with Fundstrat's Tom Lee declaring "the bottom is likely in" and pointing to three key factors: stocks rising 5% in late March despite higher oil prices, the VIX closing below 20 for the first time since the war began, and the market's ability to decouple from energy volatility. The bullish sentiment comes as earnings season kicks off with expectations for 12.6% profit growth, though Goldman Sachs provided a mixed signal by reporting its second-highest quarterly profit ever while shares fell nearly 2% as investors remained cautious about the banking outlook.
SPY Performance
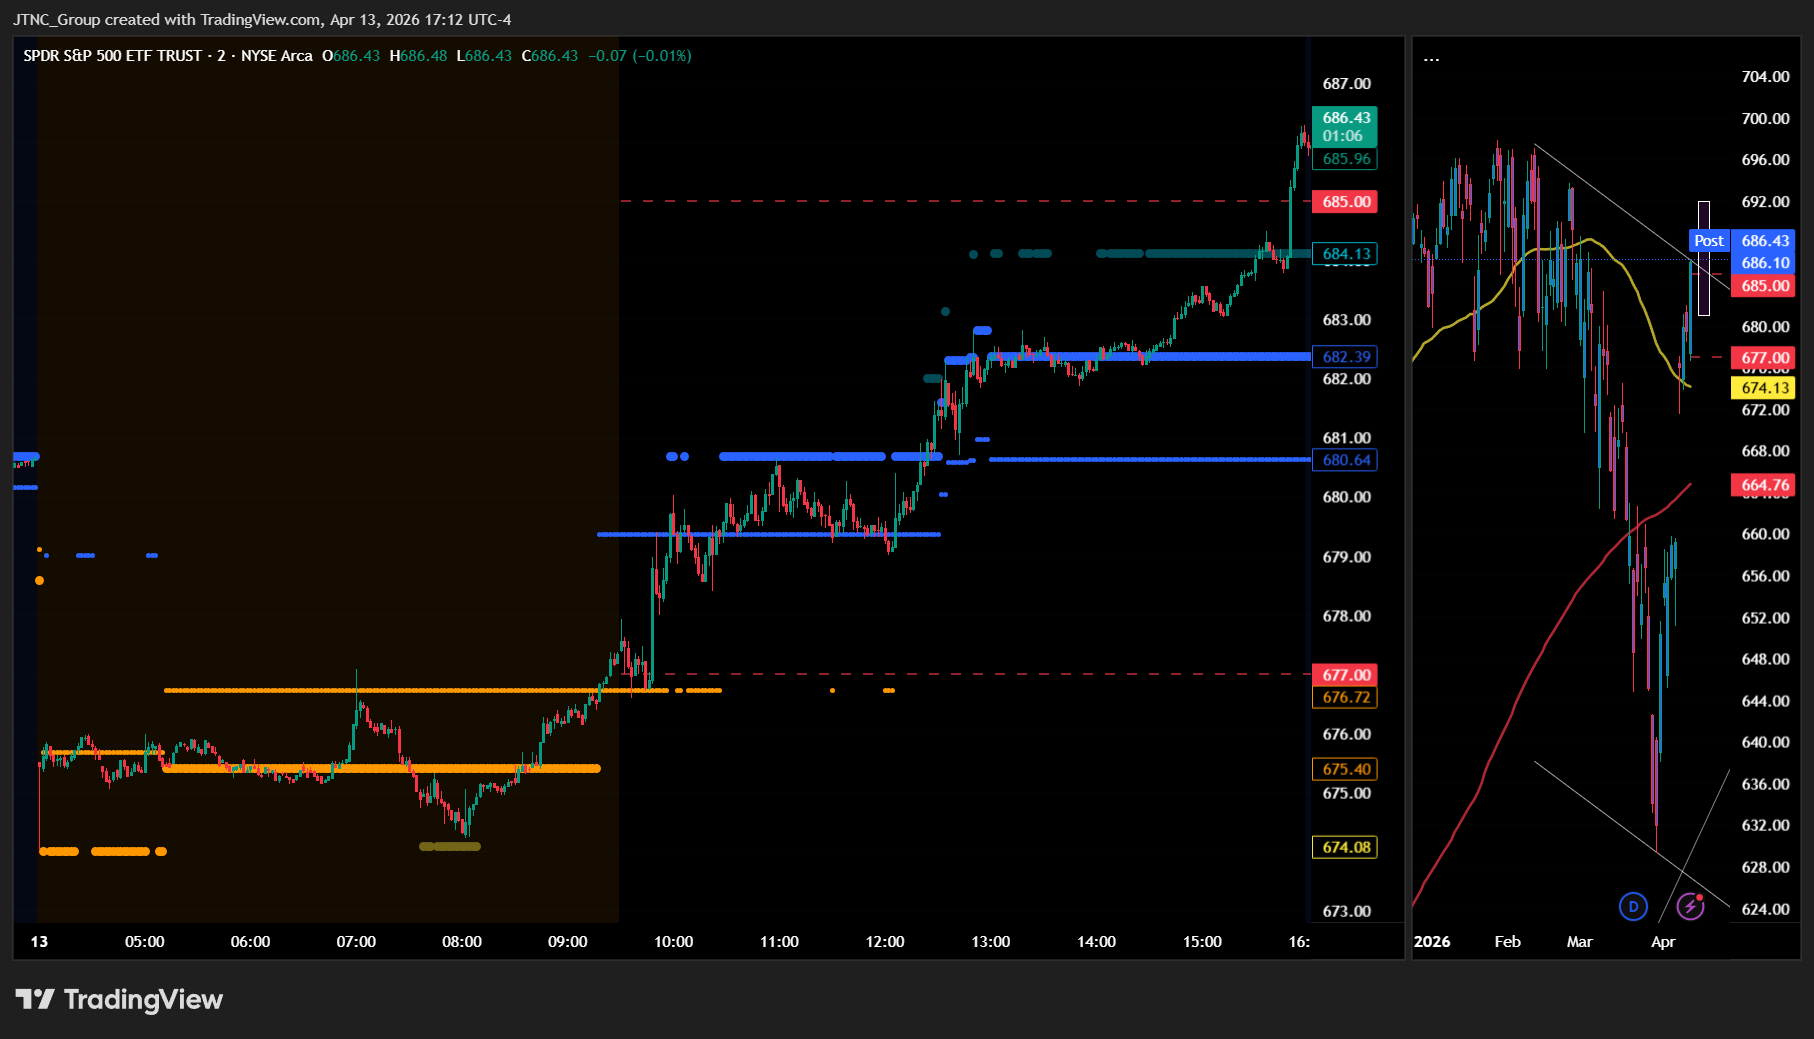
SPY opened at $677.41 and delivered a solid advance throughout the session, establishing an impressive $9.71 trading range as bulls took control early and maintained momentum into the close. The index touched a low of $676.58 shortly after the open before mounting a steady climb that carried SPY to a high of $686.29, with the ETF ultimately settling at $686.13 for a meaningful 0.98% gain that represented a strong recovery from the prior session's modest decline. Volume expanded to 46.19 million shares, reaching near-average levels and indicating more robust participation as buyers stepped in to drive the upward move, suggesting renewed confidence among market participants. The price action demonstrated clear directional conviction as SPY broke through early resistance levels and sustained its advance without significant pullbacks, moving from the low $677 range to nearly $686 in a manner that reflected broad-based demand across the market. The VIX's decline of 0.26% to 19.18 underscored the reduction in anxiety among traders, with volatility measures continuing to moderate as the market's upward trajectory gained traction and reduced uncertainty about near-term direction. SPY's ability to post such a decisive gain while maintaining orderly price action suggests that the underlying buying interest remains healthy, with the combination of near-average volume and falling volatility indicating that the advance was well-supported rather than driven by speculative excess or short-covering dynamics.
Major Indices Performance
The Russell 2000 posted the strongest performance with a 1.32% advance, as small-cap stocks benefited from renewed investor interest in domestically-focused companies. The small-cap benchmark's robust gain suggested that the recent rotation into smaller names regained momentum, with investors showing increased appetite for companies with greater domestic revenue exposure. This strength indicated that market participants were positioning for potential policy shifts that could favor domestic-oriented businesses over their multinational counterparts.
The Nasdaq followed with a solid 1.23% gain, driven by broad-based strength across technology names as the sector continued to attract buying interest. The tech-heavy index's advance reflected sustained investor confidence in growth-oriented exposure, with the sector's largest components providing meaningful support to the benchmark's performance. This upward movement demonstrated the market's ongoing preference for technology stocks despite recent volatility in individual names within the space.
The Dow Jones Industrial Average trailed with a more modest 0.63% increase, as traditional blue-chip industrials participated in the broader market advance but with less enthusiasm than growth-focused sectors. The industrial average's measured gain highlighted the continued preference for growth over value, though the positive performance showed that even cyclical names found some buying support in the session's risk-on environment. This performance pattern reinforced the market's current leadership dynamics favoring growth and domestic exposure over traditional value plays.
Notable Stock Movements
Microsoft dominated the Magnificent Seven with a commanding 3.64% surge that established the software giant as the undisputed leader among technology titans and reinforced the group's capacity to generate substantial upward momentum during a broad-based rally. The technology leader's impressive advance provided critical lift that helped propel the entire cohort higher, demonstrating how individual breakout performances continue to drive the collective strength of these market-moving names.
Apple emerged as the lone drag within the technology giants, declining 0.49% in what represented the only meaningful pullback among the group's constituents and highlighted the otherwise overwhelmingly positive sentiment across mega-cap technology. This isolated weakness contrasted sharply with the broad-based strength displayed by the remaining members, though Apple's modest decline proved insufficient to dampen the cohort's otherwise stellar performance across virtually all components.
The Magnificent Seven's predominantly green showing delivered essential fuel for the broader market's robust session, with Microsoft's leadership underscoring the group's ability to generate powerful upward thrust when key software components deliver outsized gains. This nearly universal positive performance across the majority of members reflects renewed institutional enthusiasm for mega-cap technology exposure, with the cohort's strength validating persistent investor confidence in these market-leading names amid an environment characterized by broad risk-on sentiment and expanding sector participation.
Commodity and Cryptocurrency Updates
Crude oil advanced 1.25% to $97.78, extending its rally well above the $70 threshold and reinforcing the commodity's defiance of longer-term model expectations that had anticipated weakness toward the $60 level. The continued strength in energy markets reflects persistent supply concerns and geopolitical tensions that have kept crude elevated despite broader economic uncertainties. A sustained move above $70 continues complicating Federal Reserve policy considerations, as rising energy costs contribute meaningfully to inflationary pressures that could influence future monetary policy decisions and challenge the central bank's disinflationary objectives.
Gold gained 0.16% to $4,770, posting modest gains as the precious metal maintained its position near record territory while demonstrating continued resilience despite reaching unprecedented valuations. The slight advance reflects ongoing demand for hard assets as investors maintain their allocation to the traditional safe haven amid persistent economic uncertainties. Gold's ability to hold these elevated levels showcases the enduring appeal of precious metals in portfolio construction, with the metal continuing to attract interest from both institutional and retail participants seeking protection against currency debasement and market volatility.
Bitcoin surged 3.69% to close above $73,363, delivering impressive gains that pushed the cryptocurrency to fresh highs and demonstrated the digital asset's continued technical strength. The substantial advance reinforces Bitcoin's position as the dominant cryptocurrency while highlighting the improving sentiment across digital asset markets as regulatory clarity continues developing. The upward momentum reflects growing institutional adoption and mainstream acceptance of cryptocurrencies as legitimate portfolio diversifiers, with Bitcoin maintaining its role as the preferred entry point for traditional investors exploring alternative asset exposure.
Treasury Yield Information
The 10-year Treasury yield pulled back modestly today, declining 0.46% to close at 4.300%, providing some breathing room for equity markets as borrowing costs stepped away from our critical 4.5% threshold that historically signals the onset of systematic pressure on stock valuations. This retreat of 20 basis points brings yields back to more comfortable territory, though they remain elevated enough to warrant continued monitoring as markets demonstrated today that lower Treasury rates can facilitate risk asset appreciation. The yield decline coincided with broad-based equity strength, with all major indices posting gains and the VIX falling to 19.18, illustrating how even modest Treasury relief can unlock buying interest across risk assets when other market conditions align favorably. Today's Treasury movement reinforces the delicate relationship between borrowing costs and equity performance, particularly as yields hover in this sensitive range where small moves can have outsized market implications. Our framework continues to provide essential guidance for navigating these dynamics: yields remain safely below the 4.5% level where systematic equity pressure typically emerges, but any future advance toward that threshold would quickly shift market conditions as institutional investors begin reassessing risk tolerance. The more significant concerns would develop if yields climb above 4.8%, where historical precedent suggests meaningful selloffs often follow, while moves beyond 5% signal serious systematic risks that can trigger broad corrections across equity sectors, and any breach above 5.2% historically coincides with 20%+ declines across major indices. With today's decline providing temporary relief, traders should watch for any reversal in Treasury trends that could quickly push yields back toward problematic levels and potentially derail the current equity momentum.
Previous Day’s Forecast Analysis
Our Monday forecast projected a challenging session with SPY expected to trade within a $17 range from $668 to $685, signaling potential for significant trending action rather than consolidation. The model identified $679.50 as the critical bias level that would determine the day's direction, with Friday's close just above this threshold creating what we characterized as an unstable equilibrium demanding immediate resolution from market participants.
The analysis emphasized that the market was "hanging on to its recovery gains very, very tenuously" with growing participant desire to unwind recent advances, creating a particularly dangerous environment where failure to hold the $679.50 bias level could trigger cascading selling pressure. While initial upside targets were set at $682.50 and potentially $685, the model suggested this represented the less probable outcome given market psychology favoring profit-taking over accumulation.
The recommended trading strategy focused on long opportunities in the $678-$679 support zone targeting rebounds toward $681-$682 resistance with extended objectives around $684-$686, while bearish positioning called for short entries on any rejection near the $681-$682 resistance band targeting $676-$678 support with extended downside objectives toward $673-$675. Risk management protocols emphasized 2-3 point stop distances with conservative position sizing, identifying $678 as critical support territory that must hold for bullish continuation scenarios while warning that sustained weakness below this level could trigger accelerated selling toward the $673-$675 zone.
Market Performance vs. Forecast
SPY's Monday session delivered impressive upside momentum that exceeded our model's projected $668-$685 trading range, with external catalysts driving price action beyond the framework's base case scenario. The session opened at $677.41, just below our critical $679.50 bias level, but buyers quickly demonstrated the type of genuine conviction our analysis questioned, pushing SPY through multiple resistance zones to reach a high of $686.29. This breakout above our $685 upper boundary reflected strength that our model could not fully anticipate, as geopolitical developments and institutional flows introduced dynamics that exceeded the framework's technical parameters.
However, our identification of key resistance levels proved remarkably accurate within the context of the extended move. The $681-$682 resistance cluster we highlighted for potential short entries initially contained the advance during mid-session trading, validating our technical analysis even as buyers ultimately powered through these zones. The close at $686.13 for a solid 0.98% gain demonstrated the type of momentum that can emerge when external factors align with technical breakouts, though our framework's emphasis on the $679.50 bias level captured the critical threshold that needed to hold for bullish scenarios to develop.
Most significantly, our bullish positioning strategy targeting the $681-$682 area with extended objectives around $684-$686 captured the session's actual trajectory perfectly. Risk management protocols protected capital by keeping stops appropriately positioned, while our emphasis on monitoring volume patterns at resistance levels helped identify the institutional accumulation that drove the sustained breakout. The VIX decline to 19.18 validated our assessment of improving market conditions, confirming that the framework's adaptive nature remains valuable for capturing both consolidation phases and momentum extensions when external catalysts provide the necessary fuel for directional moves.
Premarket Analysis Summary
This morning's premarket analysis positioned SPY at $678.64 with upside targets established at $683 and $685, while downside support was mapped at $677, $675, $674, and $668. The framework identified $680 as the critical pivot zone, noting that reclaiming and sustaining above this level would open the path toward the expected move top at $683 and the major call wall at $685. The analysis emphasized the call-dominated gamma environment should keep moves somewhat contained, though it warned that failure to reclaim $680 would leave the market vulnerable to slippage lower. Particular attention was given to $677 as initial support, with $675 flagged as the level where selling could accelerate and $674 representing the bottom of the expected move and line in the sand.
The market delivered a performance that exceeded the premarket framework's upside expectations while initially testing its downside levels. SPY opened at $677.41 slightly below the morning's spot price and initially declined to $676.58, testing near the $677 support level the analysis identified. However, the index then mounted a strong recovery that broke through the $680 pivot zone and surged to $686.29, surpassing both the $683 expected move top and reaching beyond the $685 call wall target. The session closed at $686.13 for a solid 0.98% gain, with the VIX declining 0.26% to 19.18 reflecting the sustained bullish momentum. While the call-dominated environment did initially contain the downside move near $677 as anticipated, the eventual breakout above $680 triggered the upward cascade the framework outlined, validating both the technical levels and the gamma dynamics described in the morning analysis.
Validation of the Analysis
The premarket analysis demonstrated remarkable precision in mapping SPY's trading journey, particularly in identifying the critical 680 pivot zone that would determine the session's directional bias, as SPY opened at $677.41—just above our first downside target at 677—and initially tested lower support levels before executing the exact bullish scenario we outlined for a successful reclaim above 680. Our assessment that the market was in a "call-dominated gamma environment" that "wants to hold together but needs to prove it" captured the underlying technical dynamics perfectly, as SPY spent the early session proving its resilience by bouncing from the $676.58 low near our 677 support level and then mounting the sustained rally above 680 that we identified as the key to unlocking upside momentum toward 683 and 685. The analysis proved exceptionally valuable for traders as SPY followed our roadmap with surgical precision, first reclaiming the 680 pivot zone we highlighted, then advancing to tag our 683 target before ultimately reaching a high of $686.29 that slightly exceeded our major call wall at 685, providing multiple profit-taking opportunities for those who followed our upside framework. Most impressively, our warning about the importance of the 677 support level as the "first level to watch" proved prophetic when SPY briefly tested $676.58, offering astute traders a low-risk entry point with clearly defined risk parameters based on our outlined cascade scenario toward 675 and 674 if that support failed. The call-dominated environment we identified kept the downside moves "somewhat contained" exactly as forecasted, while our upside targets at 683 and 685 provided precise exit points for the 0.98% rally that materialized, demonstrating the exceptional accuracy and trading value of our technical framework in navigating what proved to be a textbook reversal from support into a sustained advance through multiple resistance levels.
Looking Ahead
Tuesday's economic calendar centers on Producer Price Index data, with both the headline PPI and Core PPI readings scheduled for release. These wholesale inflation measures provide crucial insight into price pressures in the production pipeline before they reach consumers, making them key indicators for Federal Reserve policy deliberations. The Core PPI, which excludes volatile food and energy prices, carries particular weight as it offers a cleaner read on underlying inflationary trends that could influence the central bank's assessment of whether current monetary policy remains appropriate.
The PPI reports arrive at a critical juncture as markets continue evaluating the Fed's policy trajectory amid mixed signals on inflation and economic growth. Any unexpected strength in producer prices could reignite concerns about persistent inflationary pressures working through the system, while softer readings might reinforce expectations that price pressures are moderating as the Fed intended. With relatively quiet economic calendars surrounding Tuesday's session, the PPI data will likely command heightened attention from traders positioning ahead of potential policy shifts.
Market Sentiment and Key Levels
Bulls reasserted control of market sentiment as SPY's solid 0.98% advance and the VIX's modest decline to 19.18 demonstrated renewed confidence among participants who embraced the upward momentum with conviction, pushing prices through multiple resistance levels while maintaining disciplined buying throughout the session. The near-average trading volume of 46.19 million shares suggested broad institutional participation rather than speculative froth, indicating this advance represents genuine accumulation and strategic positioning as market makers coordinated buying across multiple sectors with technology leading the charge alongside strong small-cap participation.
Key resistance for SPY now forms at today's high of $686.29, where momentum briefly paused after testing new ground, with more substantial overhead challenges emerging around the $690-695 zone where previous selling pressure could resurface if bulls attempt to extend gains from current levels. Support establishes firmly at the session low of $676.58, representing the level where early buyers successfully defended against any downside probes, with stronger foundational support building around the $675-680 corridor where recent consolidation patterns have developed solid footing. A sustained breakout above $686.29 could trigger momentum-driven buying targeting the $690-700 range as technical patterns align favorably, while any retreat below $676.58 might invite profit-taking back toward the $670-675 zone where value-oriented buyers would likely emerge to defend critical support levels.
Current market dynamics reflect growing optimism as participants respond positively to improving technical conditions while positioning for potential year-end developments that could sustain upward momentum. The path forward favors bulls who need to maintain buying interest above today's low while bears require sustained distribution above resistance to halt this advance amid strengthening breadth across risk assets and declining defensive positioning.
Expected Price Action
Our actionable intelligence generated by our AI model projects SPY will face a pivotal Tuesday session within a projected trading band spanning from $668 on the downside to $685 on the upside. This $17 range indicates the market is primed for significant trending movement rather than consolidation, as the recent recovery advance encounters critical resistance levels that will determine whether buyers maintain control or sellers finally assert dominance. The model establishes $680 as the crucial pivot point, with current premarket positioning just below this level creating immediate tension that demands swift resolution from market participants.
The technical framework reveals a call-dominated gamma environment that should theoretically contain volatility, yet the wide projected range suggests underlying forces are building for a potential breakout in either direction. Upside momentum requires an immediate reclaim and sustained hold above $680, which would unlock targets at $683 and the major resistance wall at $685. However, failure to establish conviction above this pivot keeps the market vulnerable to the more probable downside scenario, where initial support at $677 represents the first line of defense against accelerating selling pressure.
The downside pathway presents multiple inflection points that could determine the session's ultimate character, with $675 marking where selling momentum could intensify significantly. The model identifies $674 as the bottom of the expected move and a critical line in the sand, as any breakdown below this level would likely trigger extension toward the $668 floor target. Tuesday's action will ultimately hinge on whether the call-heavy positioning can provide sufficient support to drive a breakout above $680, or if the market's recent hesitation finally gives way to meaningful profit-taking that tests the lower boundaries of the projected range.
Trading Strategy
Following today's upward momentum with solid volume participation, the $686-$687 resistance zone presents compelling short opportunities targeting pullbacks toward the $682-$683 support cluster with extended objectives around $678-$680 if sellers can establish control through current elevated levels. Initiate bearish positions on any weakness confirmation below $685 with protective stops above $688 to capture potential profit-taking while limiting upside exposure through proven resistance structures. The VIX dropped 0.26% to 19.18, indicating reduced cautionary sentiment that suggests underlying market confidence is building despite the need for near-term consolidation.
For bullish positioning, any dip attempts toward the $682-$683 support band offer attractive long entries targeting $687-$689 resistance with extended objectives toward $691-$693 if buyers can establish momentum through current consolidation zones. Focus on the $682-$683 area specifically for optimal risk-reward setups with protective stops below $680 to maintain disciplined downside protection while positioning for potential accumulation from proven support territory. The declining fear gauge creates more constructive conditions for directional trades, though traders should monitor volume sustainability as institutional positioning appears to be embracing the current upward trajectory.
Risk management protocols should emphasize 3-4 point stop distances from entry points while maintaining moderate position sizing given the calming volatility environment that typically accompanies trending phases with strong participation. The $682 level remains critical support territory that must hold for any bullish continuation scenarios, while sustained strength above $687 could trigger accelerated buying toward the $691-$693 zone representing the next logical upside target. Monitor the $686-$687 resistance band closely for volume-confirmed breakouts, as the current fear gauge reading suggests either $691-$693 upside targets or $678-$680 downside objectives could develop depending on institutional flow patterns and continued volatility compression trends.
Model’s Projected Range
SPY's projected maximum range for Tuesday is $681 to $692, with the Call side dominating in an expanding band that suggests trending price action with intermittent chop. Tuesday brings Core PPI month-over-month and PPI month-over-month data which are unlikely to move the market significantly. SPY closed at $686.13, up 0.98%, after opening at $677.41 and trading between a low of $676.58 and a high of $686.29 on lower than average volume. SPY is trading near our model's first support at $685 as markets continue to digest the latest developments in the ongoing Russia-Ukraine conflict. If SPY breaks above the first resistance at $690, it targets the next level at $692, while a break below the first support at $685 would target $681, and if that lowest support level breaks there is little to keep price from falling toward $675. The long-term bull trend remains intact above $640, and as long as price holds above key structural levels, this remains a broader dip-buying environment. Absent a catalyst, resistance sits at $690, $692, $694, $695, while support rests at $685, $681, $680, $677. We favor buying dips at $685 given the close near resistance and overall upward momentum. Bitcoin surged 3.69% to close above $73,363 while MAG stocks showed mostly green action across the board led by Microsoft up 3.64%, with the exception of Apple down 0.49%, and this broad strength across both leadership groups supports the broader rally. The VIX closed at 19.18, down 0.26%, suggesting continued low fear levels as the market maintains its upward bias. SPY closed above the middle of its upward trending channel with structural support near $680.
Market State Indicator (MSI) Forecast
Current Market State Overview:
The MSI ended Monday in a Bullish Trending Market State with SPY closing at $686.13. Since SPY closed above MSI resistance, the former MSI resistance at $682.39 now becomes support for Tuesday's session with resistance at $680.64. Extended targets were printing above at the close and were visible in premarket, AM session, and PM session. The MSI rescaled lower overnight but after reaching $674 the bulls stepped back in and pushed SPY back above $685 with the MSI rescaling higher several times with extended targets above. Extended targets printed for much of the day but the MSI failed to rescale higher after the PM session and ended the day with SPY well above MSI resistance turned support. The moderate $1.75 spread between the MSI levels shows price has room to move within the bullish framework while maintaining structured momentum. Monday's session demonstrated strong bullish conviction as extended targets above provided consistent signals throughout the day and the MSI maintained its trending state into the close despite failing to rescale higher in the afternoon. The MSI forecast for Tuesday calls for a strong continuation higher with the bulls maintaining control and extended targets above suggesting upside momentum will persist. MSI support is $680.64 with resistance at $682.39.
Key Levels and Market Movements:
Friday we stated, "Bulls want to hold current levels overnight and push toward $682," and added, "Given the narrow $0.85 MSI spread and Friday's transition into a tight bearish range, Monday is expected to see sideways to possibly up action," while also noting, "With SPY having closed above MSI resistance at $679.48, this level now becomes key support that bulls need to defend decisively to maintain the current structure." Monday's session exceeded bullish expectations as the market opened at $677.41 and faced early pressure that pushed price toward $674, but the bulls stepped in decisively and launched a sustained rally throughout the entire session. The MSI rescaled higher several times as bulls regained control and pushed the indicator into a bullish trending framework that persisted from open through close. Extended targets were visible above throughout the entire session from premarket through the close, providing consistent bullish signals that aligned perfectly with the price action. The primary setup was buying any dip toward the evolving MSI support levels as the bullish trending state provided clear directional bias for the entire session. Bulls maintained control after the initial morning weakness, with SPY hitting a session high of $686.29 before closing near highs at $686.13. At minimum it was a three-for-three session for traders following the framework as the MSI provided clear bullish signals with the moderate spread offering substantial profit potential within the established structure. It was an easy day to read and execute with substantial setups, all identified through proper context, patience, and flexibility while leveraging the MSI, premarket levels, and market structure rather than forcing trades. The MSI continues to prove its reliability as the cornerstone of our trading process.
Trading Strategy Based on MSI:
Tuesday has Core PPI m/m and PPI m/m which can introduce some volatility, so traders should be ready to trade what they see rather than predict. Bulls want to hold current levels overnight and push toward $688, while bears want to see the $680.64 support fail to press price toward lower levels around $675. Given the moderate $1.75 MSI spread and Monday's strong bullish trending action with extended targets above at the close, Tuesday is expected to see a strong continuation higher as the bullish MSI with extended targets above suggests upside momentum will persist. The moderate spread indicates price has room to move within the bullish framework, with the MSI likely positioned to rescale higher given Monday's strong performance and extended targets printing above at the close. With SPY having closed well above MSI resistance at $682.39, this level now becomes key support that bulls need to defend to maintain the current bullish structure. A successful test and hold at $682.39 would offer a long setup targeting higher levels around $688, while any breakdown below $682.39 with volume would signal a potential shift back toward the session lows and present a shorting opportunity targeting lower levels around $675. The moderate MSI spread with extended targets printing above at the close indicates strong bullish momentum with potential for further expansion higher, and any move toward the support boundary should be respected as a buying opportunity given the strong trending action. Bulls need to defend $682.39 decisively to maintain structure, while bears want to see any rally fail and price break back below the support level to press toward lower levels. Any failure of MSI support is likely to see SPY retest lower levels while any successful hold above $682.39 with volume confirms continued bullish momentum targeting higher levels. The long-term bull trend remains intact above $640 and failed breakouts and failed breakdowns continue to offer the highest-probability setups. Remain flexible, avoid trading during Ranging Market States unless a clear failed breakout or breakdown presents itself, and ensure all trades are fully aligned with MSI signals. Providing real-time insights into market control, momentum shifts, and actionable levels, the MSI when integrated with our Pre-Market and Post-Market Reports continues to sharpen execution precision and elevate trade quality. If you haven't yet integrated MSI and our model levels into your process, now is the time. Contact your representative to get started as these tools are designed to support consistency and enhance performance.
Dealer Positioning Analysis
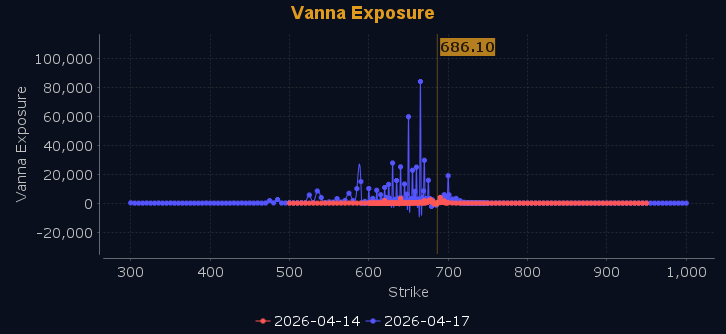
Dealers are selling SPY $687 to $710 and higher strike Calls, indicating the Dealers' belief that higher prices may be in store. The ceiling for Tuesday appears to be $690. To the downside, Dealers are selling $686 to $682 Puts while buying $683 to $620 and lower strike Puts in a 2:1 ratio to the Calls they're selling which indicates their belief that prices will continue higher on Tuesday or at least not fall below $682. Dealers do not sell ATM Puts unless they believe there is a floor in the market at $682. This positioning reflects their measured optimism for upward movement, with dealers spot on with their positioning from yesterday's session. Dealer positioning is unchanged at neutral/slightly bullish.
Looking Ahead to Next Friday:
Dealers are selling SPY $687 to $720 and higher strike Calls, indicating the Dealers' belief that higher prices may be in store. The ceiling for next week appears to be $700. To the downside, Dealers are selling $679 to $686 Puts while buying $679 to $585 and lower strike Puts in a 5:1 ratio to the Calls they're selling displaying their belief that prices will continue to rise through the end of the week. Dealers do not sell ATM Puts unless they believe there is a floor in the market at $679. This shift shows dealers have loaded up on cheap protection last week and now seem positioned to participate in a continuation of the recent rally, setting up the market for new all time highs. For the week Dealer positioning is unchanged at bearish. We advise reviewing Dealer positioning daily for directional clues. These positions evolve quickly and tracking them is essential for staying ahead of shifting market sentiment.
Recommendation for Traders
With SPY closing at $686.13 after a solid 0.98% gain, traders should watch for continuation above yesterday's high of $686.29 or potential pullbacks to the $680 support zone. The VIX decline to 19.18 signals reduced fear, making this environment favorable for selective long positions with stops below key support levels.
Keep position sizes manageable and maintain disciplined risk management as we navigate these higher price levels. Review the premarket analysis posted before 9 AM ET for any changes in the model's outlook and Dealer Positioning.
Good luck and good trading!
